2510
Reproducible fast T1 mapping of the human cervical spinal cord in vivo1UCL Institute of Neurology, Queen Square MS Centre, UCL, London, United Kingdom, 2Philips Healthcare, Guilford, United Kingdom, 3Translational Imaging Group, Centre for Medical Image Computing, Department of Medical Physics and Biomedical Engineering, UCL, London, United Kingdom, 4Department of Brain and Behavioural Sciences, University of Pavia, Pavia, Italy, 5Brain MRI 3T Mondino Research Center, C. Mondino National Neurological Institute, Pavia, Italy
Synopsis
The T1 relaxation time is a fundamental quantitative Magnetic Resonance parameter widely used to characterize healthy and pathological tissue. However, quantitative T1 mapping in the human spinal cord (SC) has been limited to date, mainly due to its small size and sensitivity to artefacts. Here we assess the reproducibility of a time efficient (<5min) SC protocol for Inversion Recovery T1 mapping, which is considered the gold-standard method for T1 estimation. Scan-rescan experiments were performed in a cohort of 4 healthy subjects. High reproducibility (whole cord intraclass correlation=0.94) of T1 estimates was found, with whole cord intra-subject coefficient-of-variation<15% for all subjects.
Purpose
To assess the reproducibility of a fast (<5 minutes) protocol for measuring T1 in the whole cervical spinal cord in vivo at 3T.Introduction
The longitudinal relaxation time (T1) is related to macromolecular concentration, water binding and water content1, and is therefore important for tissue characterisation and assessment of pathology. Furthermore, the accurate knowledge of T1 serves as the basis for several other quantitative MR methods, including in vivo spectroscopy, perfusion imaging, quantitative magnetization transfer imaging and macromolecular total volume mapping, in addition to sequence optimisation and development.
In the spinal cord, standard protocols using Inversion Recovery (IR) for T1 estimation are hampered by low resolution, limited coverage and long scan times. Furthermore, fast T1 mapping techniques such as Look-Locker or Variable-Flip-Angle-based methods suffer from poor accuracy and precision2.
Here, we investigate the reproducibility of a recently developed fast T1 mapping protocol for the spinal cord3, which is able to simultaneously address spatial coverage and scan time limitations by combining reduced field-of-view (FOV) acquisition with an IR approach.
Methods
A spatially non-selective adiabatic inversion pulse is combined with multi-slice reduced FOV imaging using ZOOM-EPI4. The repetition time for the inversion pulse (TR) is set to allow complete recovery of the longitudinal magnetization of the tissue of interest (i.e. TR≥5T1). Slice acquisition order is shuffled alongside sequence repetitions to allow sampling of magnetization recovery at different delays from the inversion without increasing the nominal TR3.
In vivo imaging uses a stack of 24 5mm-thick slices to achieve full coverage of C2-C7 cervical cord levels, with an axial FOV of 64×48mm2, giving an in-plane resolution of 1×1mm2. The recovery curve is sampled at 8 TIs (TImin/ΔTI=100ms/320ms), TR/TE=8345ms/24ms. Total scan time is 4:10min, including an additional noise-only scan (with no RF and no gradients applied, during the last sequence repetition) to characterise noise in the T1 fitting.
4 healthy subjects (3M, 27-38 years) were each scanned twice to assess reproducibility of T1 estimates for the proposed protocol. A 3D gradient-echo anatomical scan was also performed to facilitate delineation of the whole cord, white matter (WM) and grey matter (GM) regions-of-interest (ROIs) in the subsequent analysis.
Motion correction was performed on the IR data using a model-based image registration approach5, to deal with highly varying (or reversed) contrasts along different time points. Spinal cord straightening6 was used to co-register IR data to 3D anatomical images. A mono-exponential model was fitted to magnitude data using maximum likelihood estimation, assuming Rician distributed noise.
Coefficient-of-variation (COV) and intra-class correlation coefficient (ICC) among scans and subjects, defined as in7, were calculated for T1 estimates for whole-cord, WM and GM ROIs. These regions, defined in a common template8, were warped to each subject’s native space through non-linear transformation. COVs and ICC were calculated between C2-C7 after template registration.
Results
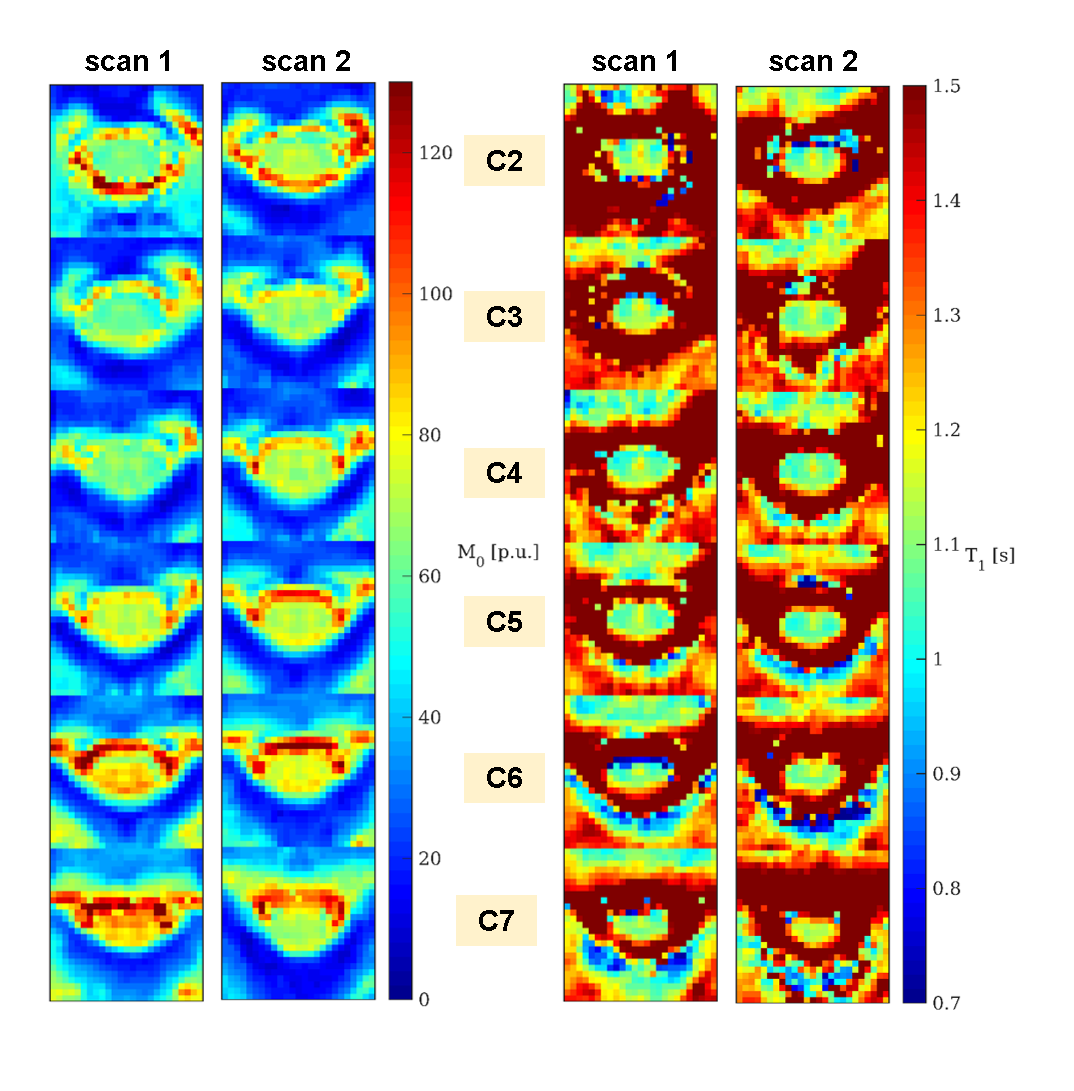
Figure 1 shows a scan-rescan comparison in one subject of T1 and M0 per spinal cord level, as identified using the spinal cord template8. Overall, good qualitative correspondence between scan and rescan is observed.
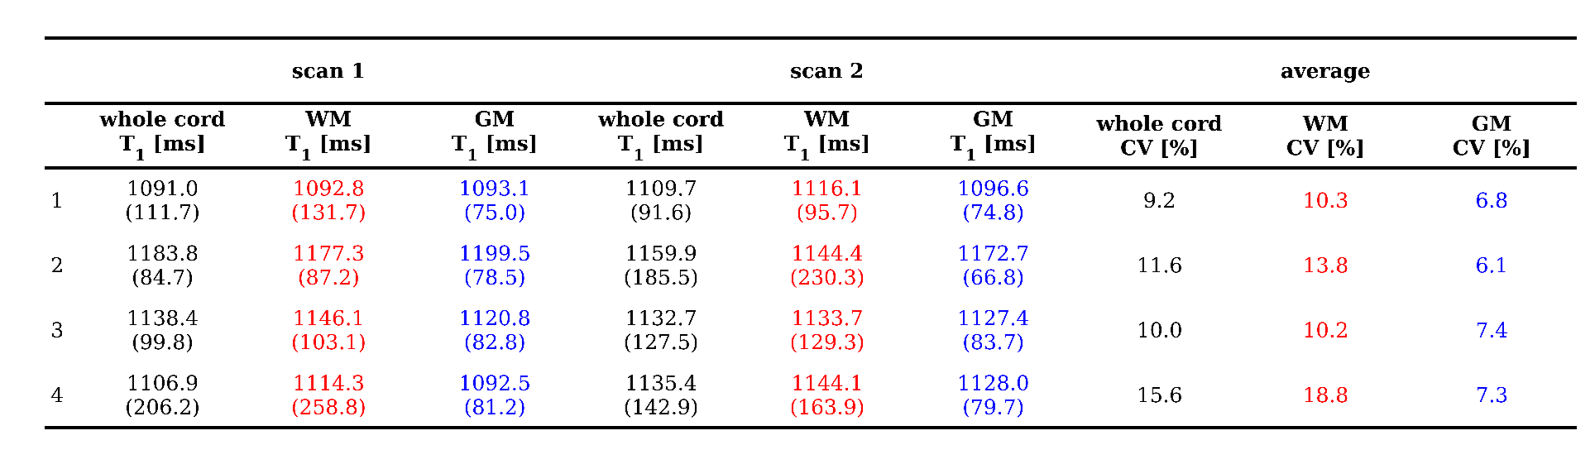
Mean and standard deviation (SD) scan-rescan T1 values for all the subjects are reported in figure 2, for whole-cord, WM and GM ROIs.
T1 COVs within subject, averaged among two repetitions, are below 19% for all the ROIs considered. Total T1 variability between subjects and scans is very low: COVs of 3.5%, 3.0% and 4.4% are found for the whole-cord, WM and GM respectively. For the same ROIs, ICC values of 0.94, 0.95 and 0.88 were found.
Discussion
We have proposed a scan time efficient T1 mapping protocol for large coverage in the spinal cord. Reproducible T1 estimates can be obtained within approximatively 4 minutes examination. High ICC index indicates that most of the variability in the T1 estimates is driven by biological differences among the subjects.
Scanner time can be further reduced through protocol optimisation (allowing reduction in the number of sampled TIs) or through combination with ultra-fast imaging techniques (e.g. simultaneous multi-slice imaging). Additional time gain could be, in turn, used to increase SNR through signal averaging.
Compared to previous measurements in the spinal cord at 3T2, we found higher T1 values for both WM and GM. Further work is required to investigate T1 in the different tissue types in more detail.
Due to the short acquisition time and the excellent reproducibility, the protocol proposed could easily be added as a routine method for spinal cord T1 quantification in a variety of applications, including clinical trials.
Acknowledgements
The UK MS Society; Brain Research Trust; NIHR BRC UCLH/UCL High Impact Initiative (BW.mn.BRC10269); EPSRC (EP/H046410/1, EP/J020990/1, EP/K005278); MRC (MR/J01107X/1); ISRT, WfL & CHNF (INSPIRED); Horizon2020-EU3.1 CDS-QUAMRI (ref: 634541).References
[1] Mezer A, Yeatman J, Stikov N, et al. Quantifying the local tissue volume and composition in individual brains with magnetic resonance imaging. Nature medicine 19.12(2013):1667-1672. [2] Smith S, Edden R, Farrell J, et al. Measurement of T1 and T2 in the cervical spinal cord at 3 Tesla. Magnetic Resonance in medicine 60:213-210(2008). [3] Battiston M, Schneider T, Gandini Wheeler-Kingshott C AM et al. In vivo T1 mapping of the spinal cord using a reduced Field-of-View Inversion Recovery sequence (IR-ZOOM-EPI). In: Proceedings of ISMRM 2016, Singapore, p.4390. [4] Wheeler-Kingshott C, Hickman S, Parker G, et al. Investigating cervical spinal cord structure using axial diffusion tensor imaging. Neuroimage 16.1(2002):93-102. [5] Ben-Amitay S, Jones D, Assaf Y. Motion correction and registration of high b-value diffusion weighted images. Magnetic resonance in medicine 67.6(2012):1694-1702. [6] Cohen-Adad J, Levi S, Avants B, et al. Slice-by-slice regularized registration for spinal cord MRI: SliceReg. In: Proceedings of ISMRM 2015, Toronto, Canada. p.5553. [7] Grussu F, Schneider T, Zhang H, et al. Neurite orientation dispersion and density imaging of the healthy cervical spinal cord in vivo. NeuroImage 111(2015):590-601. [8] Fonov V, Le Troter A, Taso M, et al. Framework for integrated MRI average of the spinal cord white and gray matter: The MNI–Poly–AMU template. NeuroImage 102(2014):817-827.
Figures