2507
Perfusion of Spinal Cord in postoperative patient with Cervical Spondylotic Myelopathy using MR DSC technique1CBIR, School of Medicine, Tsinghua University, Beijing, People's Republic of China, 2Jishuitan hospital, Beijing, People's Republic of China
Synopsis
Cervical Spondylotic Myelopathy (CSM) is a major cause of spinal cord dysfunction. However, the relationship between the degree of stenosis, tissue degeneration and sensorimotor dysfunction have not been well understood.In this study, 3 healthy volunteers and 17 CSM patients with different postoperative recovery degree were involved. We investigate the perfusion of spinal cord using MR DSC technique. The results showed a significant correlation between CBV and the postoperative severity of symptom (Japanese Orthopaedic Association score), which indicate that MR DSC perfusion of spinal cord could be an imaging biomarker to evaluate and understand CSM.
Introduction
Cervical spondylotic myelopathy (CSM) is a neurological disorder caused by the degeneration of the spinal axis and resultant spinal cord compression, which has become a major cause of spinal cord dysfunction in adults globally1. The current treatment for CSM is spinal cord decompression operation. However, the reason for the fact that why a certain proportion of patients after decompression operation suffered from the poor recovery or recurrence despite the release of compression is still unknown2. In this study, we sought to investigate the relationship between spinal cord blood supply and clinical symptom after decompression operation using MR Dynamic Suspensibility Contrast enhanced imaging technique (DSC).Method and materials
Image acquisition
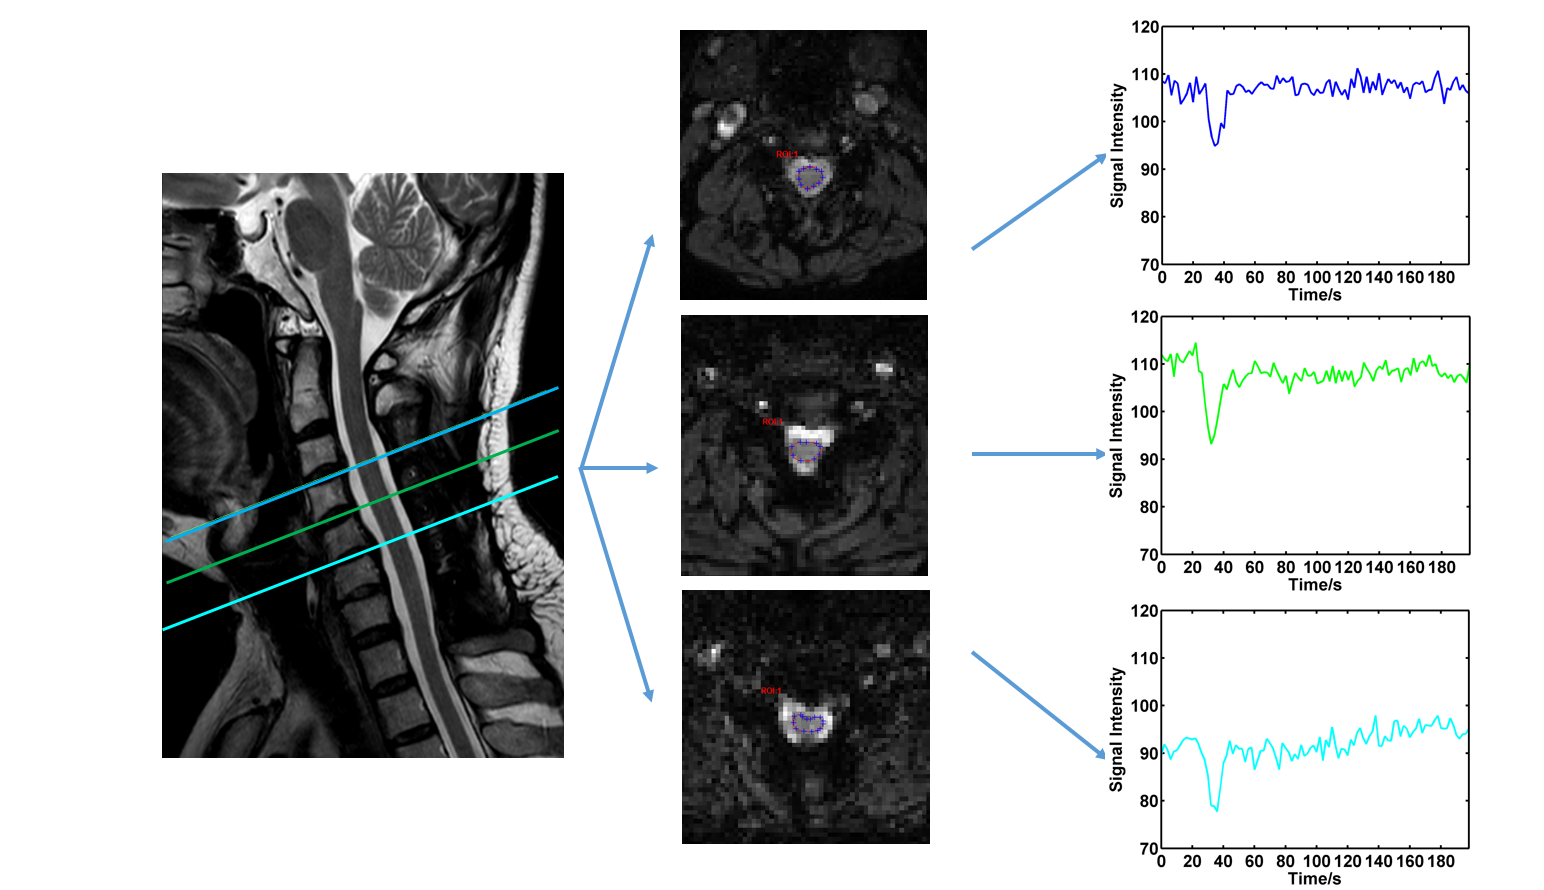
After signed written consent form obtained, 17 patients with CSM several month after decompression operation were called back and scanned on a Philips Achieva 3.0T (Achieva, Philips Healthcare, Best, The Netherlands). Except for traditional T1W, and T2W image acquisition, DSC images of spinal cord of all the patients were obtained (Fig.1) by using a EPI DSC sequence with the following parameter: TR/TE, 2000/30; flip angle, 75°; slice orientation, transverse; Field of View (FOV) 160*160mm2; spatial resolution, 1.5*1.5mm2 in-plane; slice thickness, 3.0mm; 25 number of slices. Totally 60 dynamic scans were acquired with temporal resolution of 2.0s. All imaging were done to cover all the compressed segments. During acquisition, 0.1mmol/kg of Gd-DTPA3 was injected by a power injector at 2.0ml/sec together with the 4th dynamic. Three healthy volunteers were also included as controls and imaged with the same imaging protocol.
Data processing
In patients, transverse slices containing the compressed segments (usually C2 to C6) were selected for analysis, while in the controls, the slices covering C3-C6 were selected. The ROIs of spinal cord were depicted manually on all selected slices with the guidance of sagittal anatomic T2W image (Fig.1). After the intensity curve S(t) by averaging the pixels within ROI of all dynamics have been obtained, it was converted to Gd concentration C(t) by1: $$C(t) = -K \times ln\frac{S(t)}{S_{0}}$$
Where S0 was set as the mean signal of the pre-contrast dynamics, K is a proportionality constant related to TE and the MR scanner1. Classic Indicator Dilution Theory1 was taken to quantify the Spinal Cord Blood Volume (SCBV). In this study, the strategy for automatic calculation of the Arterial Input Function was adopted3. All of results were analyzed case-based by averaging all the results across slices for each case. Japanese Orthopaedic Association score (JOA)2, a standard to evaluate the severity of CSM, was carried out for each subject at the same day with imaging. The correlation coefficient based on linear regression was used to compare the spinal cord SCBV and JOA in patients. Moreover, a "normal" SCBV range were calculated from healthy controls(mean+-2*SD), the JOA between patients with "normal" SCBV and "abnormal" SCBV were compared using nonparametric-test.
Results
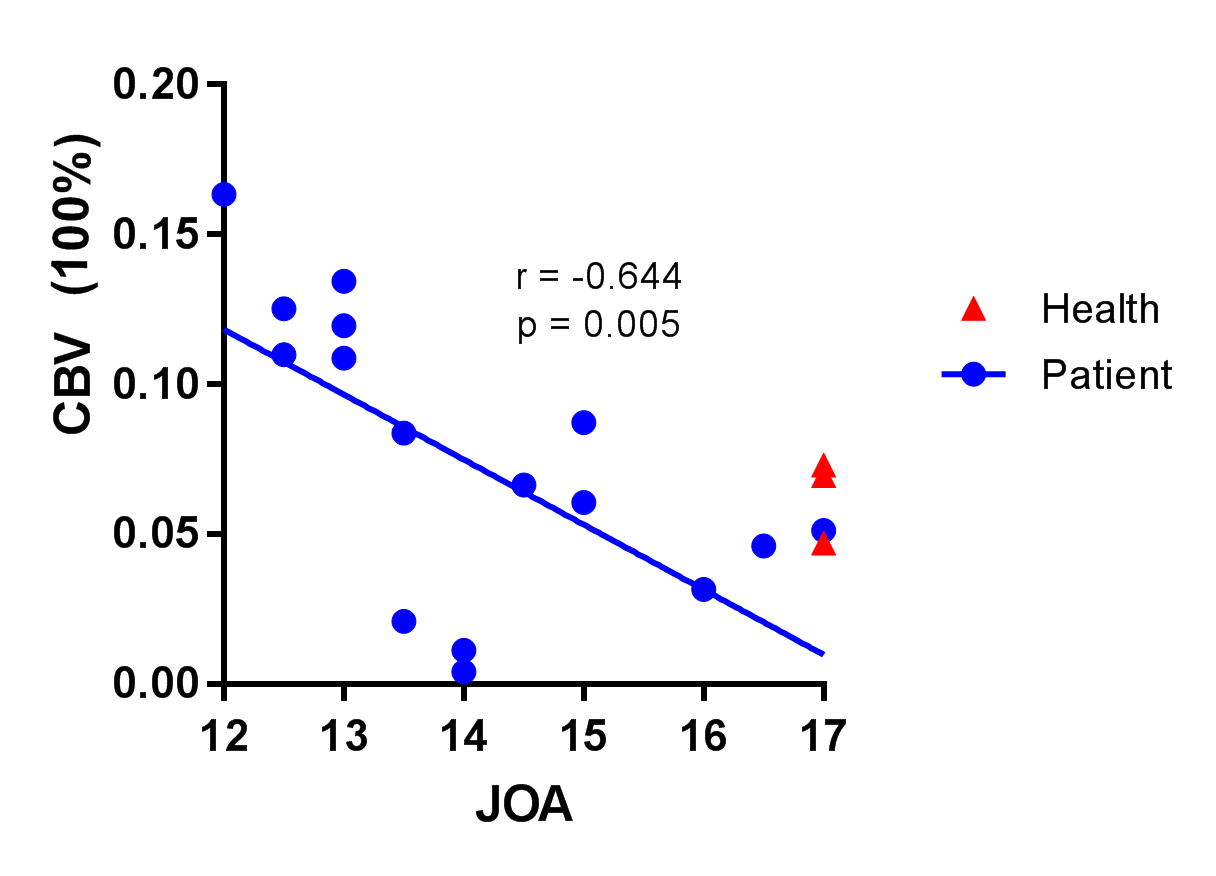
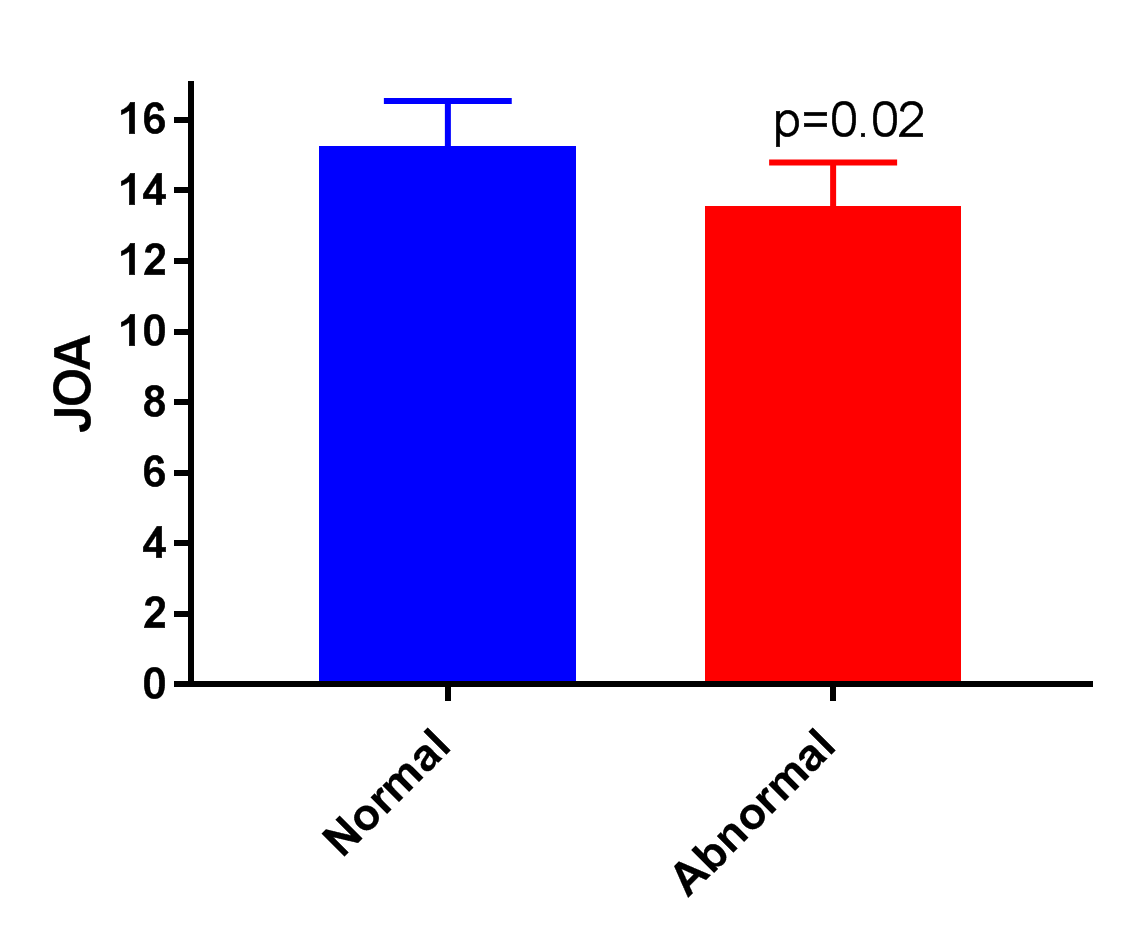
As shown in Fig 2, a significant negative correlation (r=-0.64, p=0.005) between SCBV and JOA can be found. Compared with healthy controls, the SCBV(100%) of patients can be lower or higher (Fig 2). The "normal" SCBV(100%) range calculated from healthy controls from 0.035 to 0.091. The patients with SCBV in "normal" range has significantly higher JOA than the patients with SCBV outside of "normal" range (Fig3.JOA: 15.3±0.5 vs 13.6±0.4, p=0.02 ).Discussion and conclusion
This study successfully quantify the perfusion using MR DSC imaging. The findings of this study indicate that the both reduction and increase of SCBV(100%) can be related to poor postoperative recovery in CSM patients. However, the physiological mechanism leading to the significant change of SCBV(100%) has not been understood. Tissue degeneration and inflammation could be the reasons for fall and rise of SCBV(100%), respectively. In conclusion, MR EPI DSC technique can evaluate the spinal cord blood flow perfusion, providing a good tool to evaluate the spinal cord of CSM patients.
Acknowledgements
NSFC funding 81371540 and 81571667References
1. Smith, A. M., et al. (2000). "Whole brain quantitative CBF, CBV, and MTT measurements using MRI bolus tracking: Implementation and application to data acquired from hyperacute stroke patients." JOURNAL OF MAGNETIC RESONANCE IMAGING 12(3): 400-410.
2. Tetreault, L., et al. (2015). "Degenerative Cervical Myelopathy: A Spectrum of Related Disorders Affecting the Aging Spine." Neurosurgery 77 Suppl 4: S51-67.
3. Carroll, T. J., et al. (2003). "Automatic calculation of the arterial input function for cerebral perfusion imaging with MR imaging." Radiology 227(2): 593-600.
Figures