2505
Improvement in Visualization of Brachial Plexus by 3D TSE MR Neurography Using Combination of STIR with SPIR at 3.0T1Department of Radiology, Kumamoto Saishunso National Hospital, Kumamoto, Japan, 2Department of Medical Imaging, Faculty of Life Sciences, Kumamoto University, Kumamoto, Japan
Synopsis
Magnetic resonance neurography (MRN) of the brachial plexus using a 3D turbo spin echo (TSE) sequence with short-term inversion recovery (STIR) reduces the effect of fat suppression at 3.0 T. In addition, the signal intensity of the brachial plexus is influenced by changing the effective echo time (TEeff). Therefore, we optimized the fat suppression technique and TEeff so that the 3D TSE sequence, using a combination of STIR with SPIR and an optimal TEeff (from170 ms to 293 ms), achieved better visualization of the brachial plexus without residual fat.
Purpose
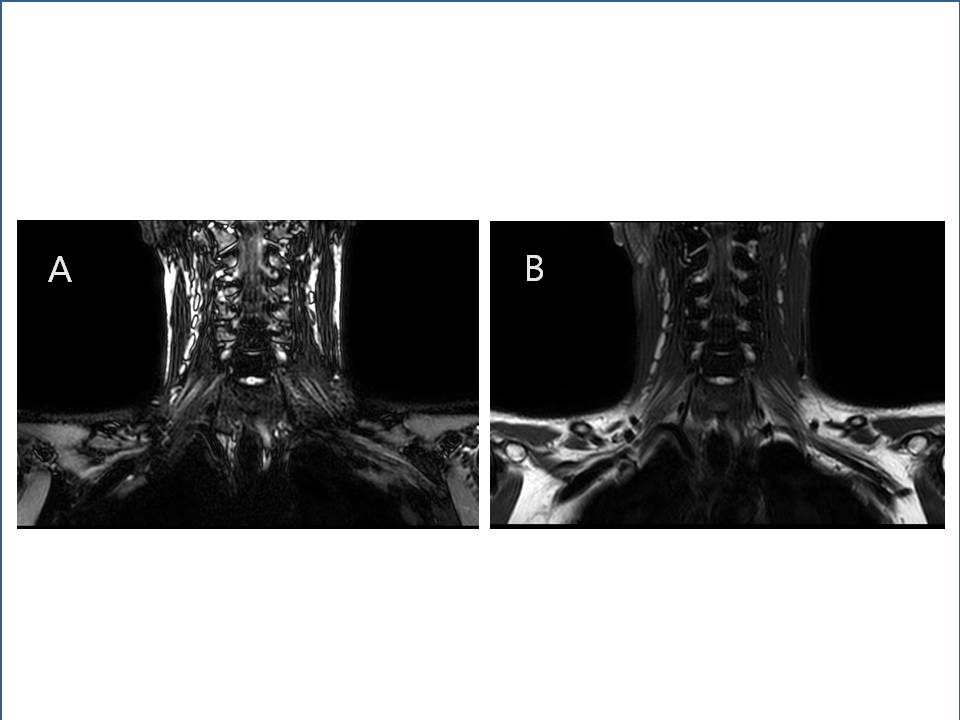
Magnetic resonance neurography (MRN)1) has been used to evaluate abnormal conditions of entire nerves and nerve bundles. A fat-suppressed 3D turbo spin echo (TSE) sequence is one of the imaging techniques for MRN, which has been widely adopted at 1.5T.2) For short-term inversion recovery (STIR) as a fat suppression technique at 3.0T, the signal intensity of fat tissue in the peripheral area of the brachial plexus is decreased due to the reduced accuracy of excitation by an RF pulse. Moreover, the use of spectral pre-saturation with inversion recovery (SPIR) does not result in uniform fat suppression due to the inhomogeneity of the static magnetic field (Fig.1). On the other hand, it is well known that the visibility of the brachial plexus using a 3D TSE sequence greatly changes with the effective echo time (TEeff). The purpose of this study was to improve image quality for MRN of the brachial plexus using a 3D TSE sequence through optimization of the fat suppression technique and the setting of TEeff at 3.0T.Materials and Methods
The 3D TSE sequence was performed with a 3.0T whole-body clinical systems (Ingenia, Philips Healthcare).
Phantom study
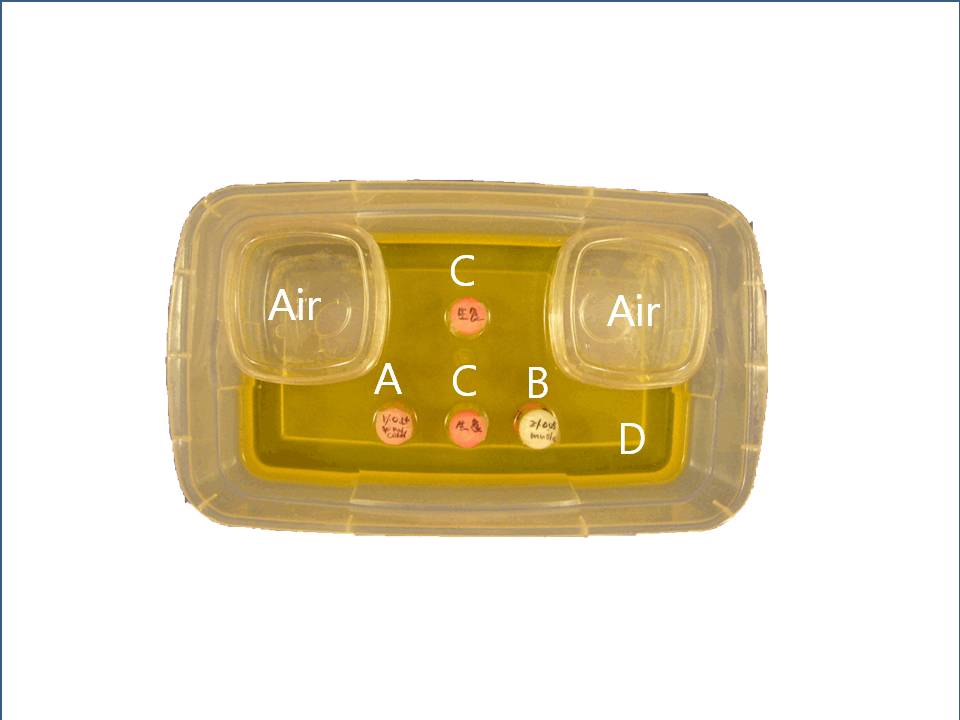
We employed a custom-made phantom to mimicking a human neck (Fig.2). Four vials were filled with a mixture of 1.0 % or 2.0 % agarose solution, different concentrations of Gd contrast agents, and saline. The periphery of the vials was filled with olive oil to represent fat and the phantom also contained plastic boxes filled with air. To determine the optimal fat suppression technique, the phantom was imaged by 3D TSE sequences with three different fat suppression techniques, which are STIR, SPIR, and both together (a combination of STIR with SPIR). The imaging parameters used for the phantom study were as follows: field of view (FOV)=200×200 mm2; repetition time (TR)=2000 ms; TEeff=240 ms; refocus control angle=50°; spatial resolution=1.35×1.36×2.0 mm3; slice thickness=2.0 mm; number of slices=40; and sensitivity encoding factor=2.6. Then, the regions of interest (ROIs) were set in the olive oil section of the phantom images, and the homogeneity of the fat-suppressed signal was evaluated by the coefficient of variation (CV) of the ROIs. From this results, we determined the optimal fat suppression technique. Next, the phantom was imaged with a 3D TSE sequence using optimal fat suppression techniques with different TEeff values (170, 232, 293, 356, 417, and 479 ms). Then, the contrast-to-noise ratio (CNR) was calculated between the nerve mimicking vial and muscle mimicking vial.
In vivo study
Fourteen volunteers (mean age: 34.5 years) were enrolled in this study. To define the optimal TEeff setting, the volunteers’ images were obtained by 3D TSE sequences with three TEeff (170, 293, and 479 ms) using the optimal fat suppression technique. The volunteers’ images were obtained using the same imaging parameters as those used in the phantom study, except for the TEeff. Then, the visibility of the brachial plexus in the images was assessed at four levels by eight raters.
Results
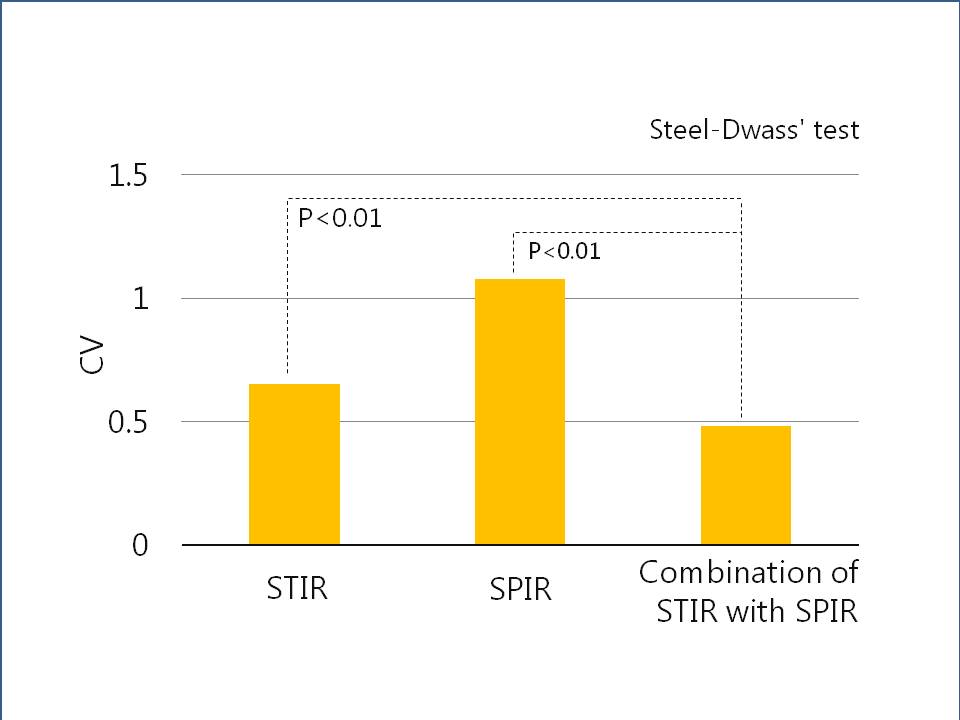
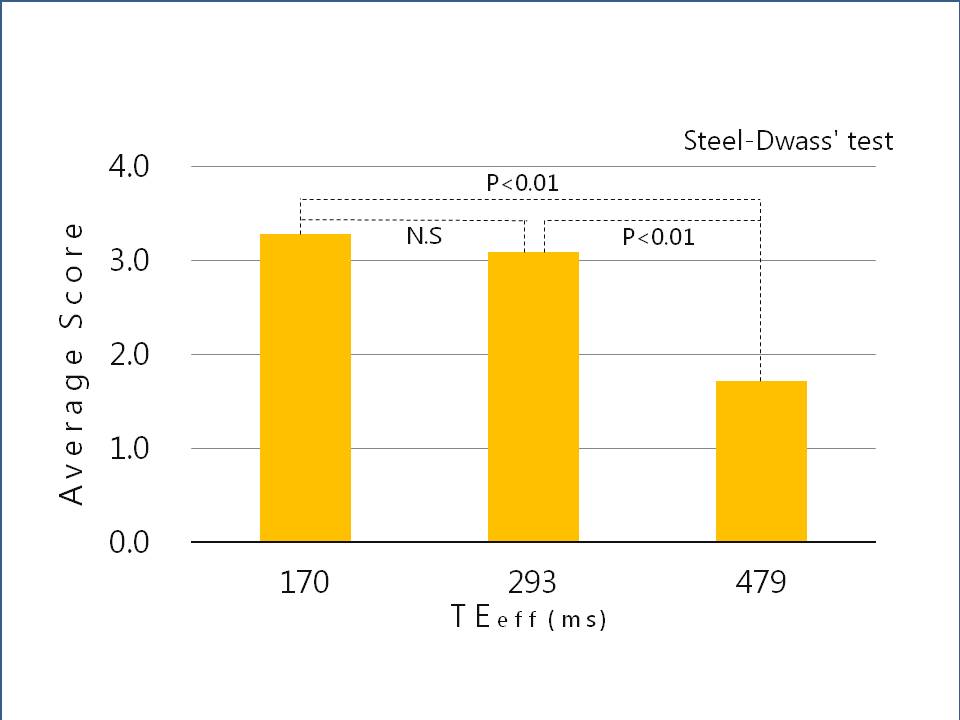
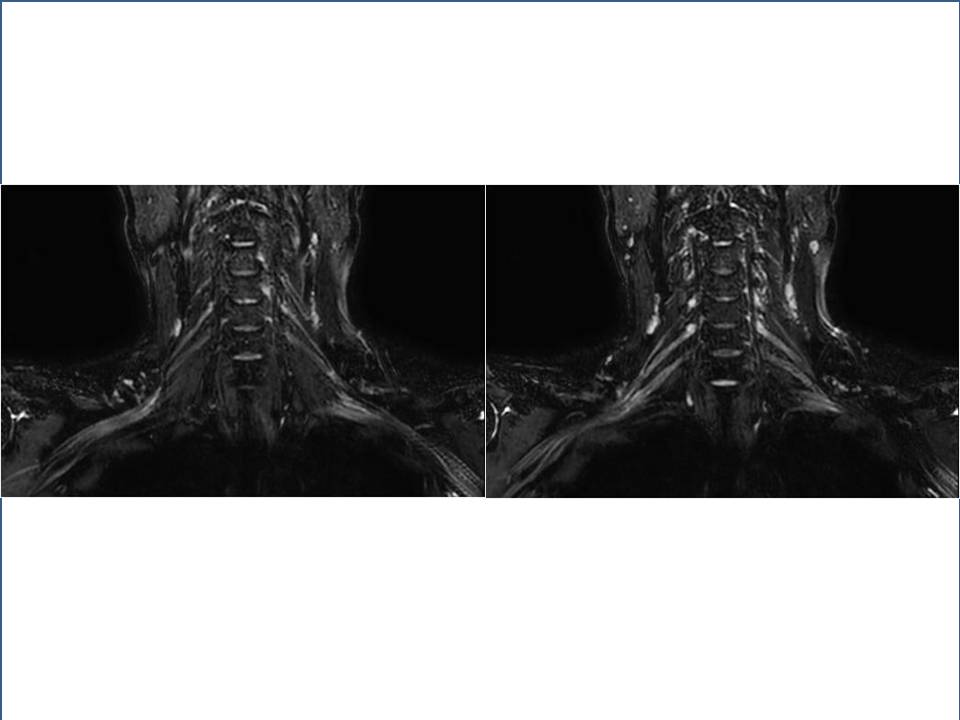
In a phantom study, the CV of the fat suppression technique with the combination of STIR with SPIR decreased in comparison to that with the use of each technique alone. This suggested that the combination of STIR with SPIR makes it possible to obtain robust fat suppression (Fig.3). The CNR of the nerve and muscle mimicking phantom increased when the TEeff was less than 356 ms. In the in vivo study, there were no statistically significant differences between the visibility of the brachial plexus images for TEeff=70 ms and TEeff=293 ms. However, the difference in visibility of the brachial plexus in images obtained with TEeff=479 ms and with TEeff less than 293 ms was significantly different (p < 0.01) (Fig.4, 5).Discussion
STIR and SPIR did not provide uniform fat suppression for visualization of the brachial plexus. However, the combination of STIR with SPIR achieved robust fat suppression. This is because the combination of STIR with SPIR compensated for the inhomogeneity area of fat suppression by STIR and SPIR, respectively. Moreover, in vivo study, it is suggested that the optimal setting of TEeff is in the range from 170 ms to 293 ms. The longer TEeff values decreased the CNR of the brachial plexus due to the decrease in the signal by T2 relaxation. Therefore, it was suggested that the image quality for MRN is improved by using a medium TEeff setting.Conclusion
3D TSE sequences using a combination of STIR with SPIR and medium TEeff (in the range from 170 ms to 293 ms) achieved better visualization of the brachial plexus at 3.0T.Acknowledgements
No acknowledgement found.References
1). Filler AG, Howe FA, Hayes CE, et al. Magnetic resonance neurography. Lancet 1993; 341:659-661.
2). Viallon M, Vargas MI, Jlassi H, et al. High-resolution and functional magnetic resonance imaging of the brachial plexus using an isotropic 3D STIR (short term inversion recovery) SPACE sequence and diffusion tensor imaging. Eur Radiol 2008;18:1018 –23
Figures