2503
Cortical Recruitment of Motor Imagery in Timed Up and Go Task1Department of Neuology, University of California, San Francisco, San Fransisco, CA, United States, 2Department of Physical Therapy and Rehabilitation Science, University of California, San Francisco, 3Department of Radiology and Biomedical Imaging, University of California, San Francisco
Synopsis
A paradigm was developed to evaluate neural pathophysiology of gait and turning in individuals with Parkinson’s disease (PD) using fMRI. BOLD signal change of imagined walking and turning was compared to resting state activation in PD patients and controls. Subjects performed physical examinations including the Timed Up and Go (TUG) task, ten-meter walk and a timed 360-degree turn to assess motor performance. Brain activity was compared between groups and to motor performance. This study concluded that a neural correlate of the TUG task exists in BOLD signal change in the premotor and primary motor area when imagining-turning compared to imagining-walking.
Introduction
Parkinson’s disease (PD) is a highly prevalent, neurodegenerative movement disorder4. Gait disturbances and postural instability, symptoms that produce the highest incidence of morbidity in individuals with PD7, respond poorly to dopaminergic treatment . The neural correlates underlying these disabilities are currently uncharacterized. It is essential to identify early, quantitative biomarkers that correlate with clinical motor outcomes as PD progresses. The Timed-Up and Go (TUG) task is a clinical marker for PD. It integrates several motor components including gait speed, initiation of movement, and turning – and performance does not significantly improve with dopaminergic therapy3. A fMRI paradigm was developed in order to quantitatively evaluate neural correlates related to PD motor dysfunction, which could be directly compared to performance on the TUG task2.Methods
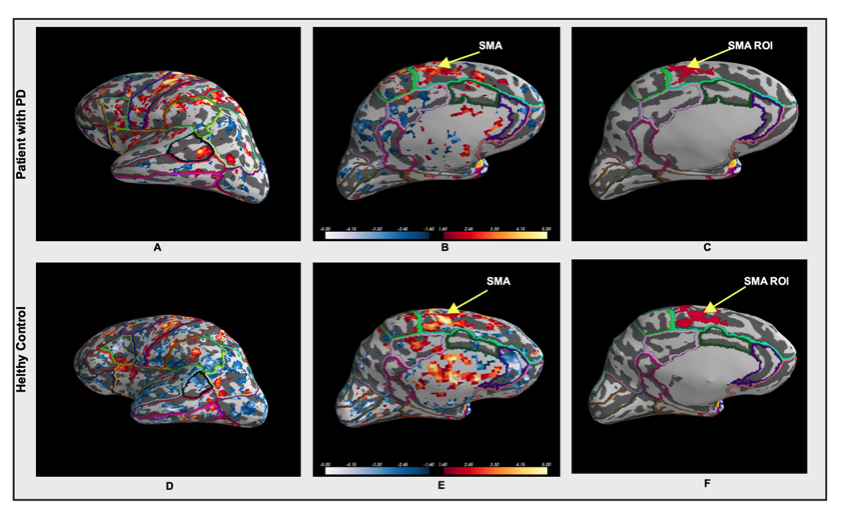
fMRI brain activation patterns of 11 patients with PD and in 11 age-matched controls were compared. During a six-minute randomized fMRI block exam, subjects were asked to imagine themselves walking, imagine themselves turning in 360-degree circles, and rest. A structural, whole brain T1-weighted MPRAGE, (TR 2300 ms, TE 3 ms, TI 900 ms; 1x1x1 mm3 resolution) and a GE-EPI fMRI sequence (TR 1200 ms, TE 30 ms, 306 volumes, 2.50×2.50×2.50 mm resolution) was acquired. Motor performance on three physical tests - the TUG task, 10-meter walk test and timed 360-degree turn were also recorded. Activation maps of fMRI data were created to visualize four signal contrasts (imagined-turning versus rest, imagined-walking versus rest, imagined-turning and imagined-walking versus rest, and imagined-turning versus imagined-walking). Functional supplementary motor area (SMA) ROIs were selected using activation clusters in the SMA (t-stat threshold = 2mm). The t-statistic data across all subjects was normalized to MNI space and was compared between the two groups and four contrasts with performance on motor examinations.Results
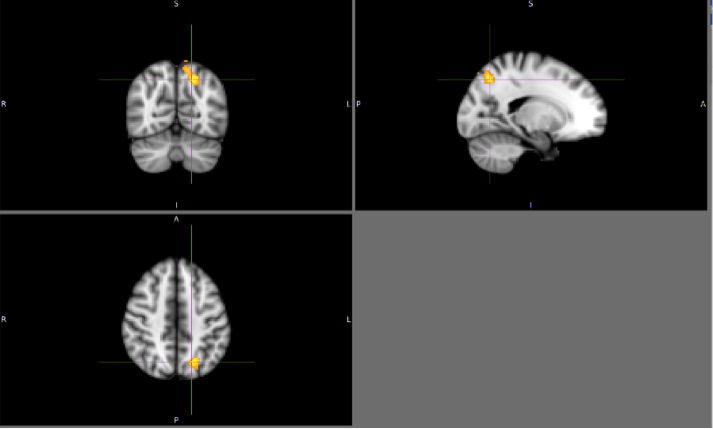
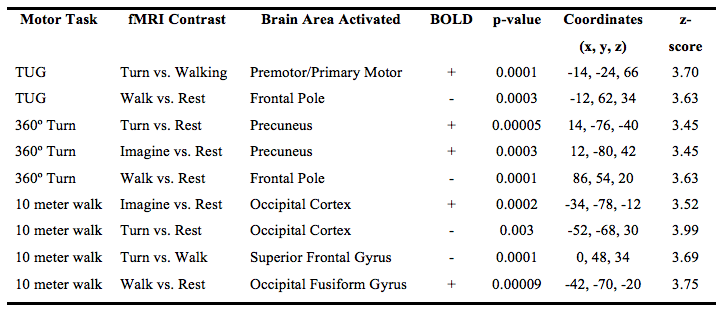
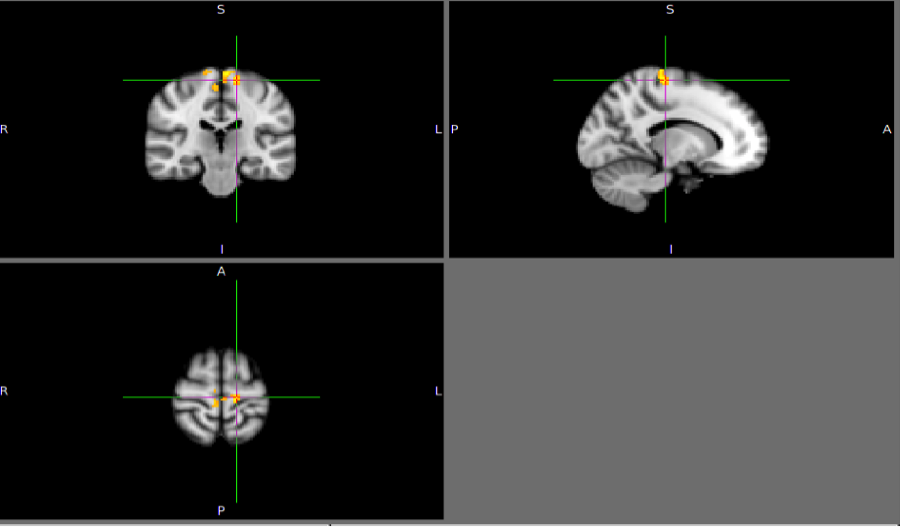
There were no detectable differences between the outcomes on the physical tasks, the TUG, 10-meter walk, or a 360-degree turn between patients with PD and controls. Cortical activation in the supplementary motor area (SMA) was localized in all subjects during motor imagery tasks (Figure 1). No significant differences were found between patients and controls relative to SMA activation. Individuals with PD had a significant increase in lateral occipital lobe activation when imagining-turning compared to imagining-walking (Figure 2, 3). Activity in the premotor and primary motor area during the imagined-turning versus imagined-walking contrast was significantly correlated to performance on the TUG test for both groups (Figure 3, 4). Activation in the precuneus was correlated with performance on the 360-degree turn during the imagined-turning condition (Figure 3). Activation in the occipital gyrus was correlated with the 10-meter walk for several motor imagery contrasts (Figure 3).Discussion
This study concludes that SMA activation was documented in all subjects during the motor imagery task. It is promising this block design yielded distinct motor activation patterns among subjects and between task conditions. Significantly higher BOLD signal response was found in the lateral occipital region for patients with PD during the imagined-turning condition, but not the imagined-walking condition. This may indicate that individuals with PD recruit more of their visual network to compensate for turning disability. Individuals with slower TUG task results had an increase in premotor and primary motor activation during imagined-turning, compared to imagined-walking. This suggests a possible correlation between turning disability and increased recruitment of premotor and primary motor activity. Hyperactivity to the premotor and primary motor areas could be attributed as adaptive plasticity of the motor system, due to deficient projections to the motor pathway2,5,6. The medial part of BA6, or the SMA, is more involved in the activation that relates to TUG performance and imagined-turning, than to imagined-walking. It is possible that the disturbance in the basal ganglia could result in over-activation in the SMA, and disturb eventual movement execution1. It is significant that there is a distinction between the imagined-turning and imagined-walking outcomes because turning requires more postural balance and attention compared to forward ambulation.Conclusion
The focus of this study was to evaluate neural activation patterns in patients with PD and healthy controls as potential biomarkers, which relate to clinical motor outcomes. Identifying a neural biomarker is essential for future treatments to be targeted and tested. This study concluded that a neural correlate of the TUG task exists in BOLD signal change in the premotor and primary motor area when imagining-turning compared to imagining-walking. Assessing the relationship between postural instability and the corresponding functional brain areas has the potential to increase our understanding of the breakdown of motor control in PD.Acknowledgements
With greatest appreciation to Dr. Roland Henry for his guidance and management of this study, and for his unending support, advice and enthusiasm for neurological imaging research. Special thanks to Ph.D. student Anisha Keshavan whose proficiency in fMRI design and processing helped guide this study. I would like to thank Tracy Luks for her help with the fMRI study design, and Nancy Byl for her help in advising this study and managing the motor performance tests. I am grateful to Stacy Hatcher for her help in coordinating the patients for this study. Thank you to all the members in Roland Henry’s lab for their advice and input during this study.References
1. Borrione, Paolo, Tranchita, Eliana, et al. Effects of physical activity in Parkinson’s disease: A new tool for rehabilitation. World Journal of Methodology 2014; 4(3): 133-143.
2. Buhmann, C., et al. Abnormal excitability of premotor-motor connections in de novo Parkinson’s disease. Brain 2005; 127 (12) 2732-2746.
3. Franzén, Erika, et al. Reduced performance in balance, walking and turning tasks is associated with increased neck tone in Parkinson’s disease. Experimental Neurology 2009; 219(2):430–4.
4. Olanow, C.W., Tatton, W.G. Etiology and pathogenesis of Parkinson’s disease. Annual Review of Neuroscience 1999; Pages 123-144.
5. Sabatini, U, Boulanour K, et al. Cortical motor reorganization in akinetic patients with Parkinson’s disease: a functional MRI study. Brain 2000; 123 (Pt 2):394-403.
6. Udupta, Kaviraja and Chen, Robert. Motor cortical plasticity in Parkinson’s disease. Frontiers in Neurology 2013; 4: 128.
7. Wood, BH, JA Bilclough. Incidence and prediction of falls in Parkinson's disease: a prospective multidisciplinary study. Journal of Neurology Neurosurgery Psychiatry 2002; 72:721-725.
Figures