2499
Deep grey matter T2 relaxometry at 3T in Huntington’s disease1Lysholm Department of Neuroradiology, National Hospital for Neurology and Neurosurgery. UCL Hospitals NHS Foundation Trust, London, United Kingdom, 2Academic Neuroradiological Unit. Department of Brain Repair and Rehabilitation, UCL Institute of Neurology, London, United Kingdom, 3Huntington's Disease Centre, UCL Institute of Neurology, London, United Kingdom
Synopsis
Iron levels in the basal ganglia in Huntington’s disease (HD) have been previously investigated at 3T with MRI using magnetic field correlation imaging, T2*, quantitative susceptibility mapping (QSM), as well as T2 relaxometry mostly at lower fields of 1.5T or less. We performed T2 mapping at 3T in a group of pre-HD (n=10) and HD patients (n=11) to investigate its association with Disease Burden Score and structural measures (caudate volume) of disease load. We found significant correlations between T2 and disease progression measures in nucleus accumbens, putamen and pallidum.
Introduction and Purpose
Basal ganglia neuronal loss in Huntington’s disease (HD) is thought to be accompanied by iron accumulation. It is theorised that this is due to iron homeostasis impairment1. However the nature of iron content change during disease progression is still unclear. Iron accumulation in HD has been evaluated at 3T using T2* relaxometry2-3 , quantitative susceptibility mapping (QSM)4 , magnetic field correlation imaging (MFC)5 and T2 relaxometry mostly at fields of 1.5T or less6-8. MFC, T2, T2* and QSM are all linked to iron concentration9; the relative sensitivity of these techniques has been compared in Parkinson’s disease10 but not in HD. Whilst susceptibility measured at 3T in putamen and caudate showed a correlation with disease severity4, no such correlation was demonstrated for T2 or T2*.
Here, we measured T2 at 3T in the basal ganglia of manifest and pre-manifest HD patients to investigate its association with clinical and structural measures of disease load.
Methods and Materials
MRI. Siemens 3T Tim Prisma, 64-channel coil. Structural imaging (T1w): 3D-MPRAGE, TR=2000ms, TE=2.05ms, TI=850ms, flip angle 8°, 1mm3 resolution, GRAPPA 2, 4’48” acquisition. T2 relaxometry: Turbo Spin Echo, TR=7.94s, TEs=13, 81, 121ms, turbo-factor=4, 55 axial slices, voxel resolution 1x1x2.5mm3, GRAPPA 2, acquisition 4’23”.
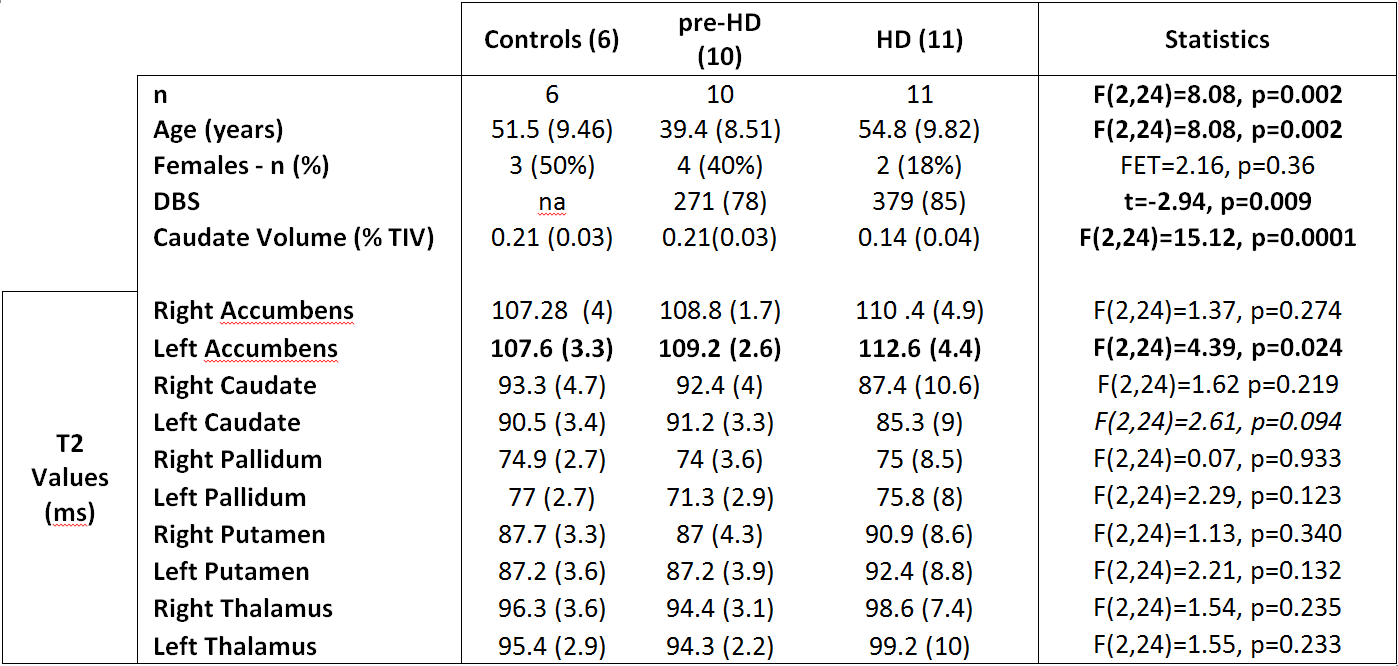
Subjects. Thirty-one participants recruited so far as part of a larger study (HD-CSF) were included. Four datasets were excluded (motion artefacts), leaving data from 6 controls, 11 manifest HD and 10 pre-manifest participants (pre-HD) (Table 1). Disease burden score (DBS) was calculated as age*(cytosine-adenine-guanine repeats-35.5)11.
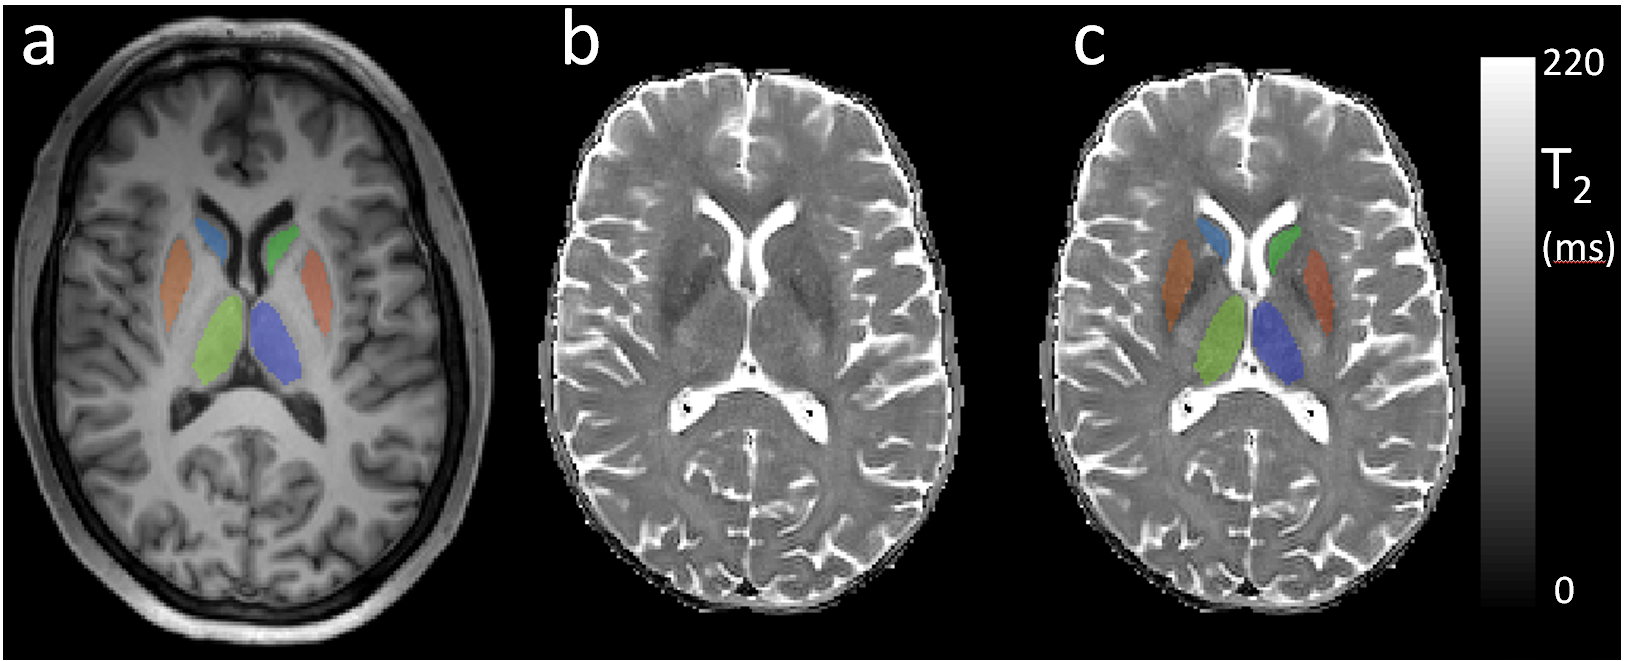
Data Processing. T2 maps were created with NiftyFit12 using all 3 TE datasets. T1w data was simultaneously segmented and regional labels estimated using a joint multi-atlas and Gaussian mixture model method13-14. Caudate volume (as % of total intracranial volume) was calculated. T1w data was affine-registered to the T2 data space using nifty_reg15. Corresponding parcellations/probability maps for grey matter, white matter, cerebrospinal fluid (GM, WM CSF) were also downsampled to the T2 space16. Average T2 values for five regions of interests (ROI; caudate, putamen, globus pallidus, thalamus and accumbens) were calculated after manually trimming each ROI to exclude voxels with more than 2% estimated cerebro spinal fluid or 10% WM partial volume fractions.
Statistical Analysis. ROI-averaged T2 values were compared across group (controls, pre-HD, HD) using univariate analysis (SPSS). Partial correlations between T2 and disease progression measures (DBS, caudate volume) were performed in all HD gene-carriers. All analyses were adjusted for age and sex. P-values <0.05 were considered significant.
Results
Mean caudate volume was significantly lower in HD participants (Table 1). As expected there was a significant negative correlation between the 2 markers of disease progression: caudate volume and DBS (Spearman's Rho 0.702, p=0.001).
Standard deviations of the T2 values (Figure 1) over each group where on average 4(SD 1)% for controls and pre-HD and 9(SD 3)% for HD participants. T2 only differed significantly between groups in left accumbens (T2 increase in HD) and showed a trend towards decreased T2 for left caudate. Post-hoc pairwise comparison showed lower T2 in pre-HD left pallidum vs controls (p=0.01).
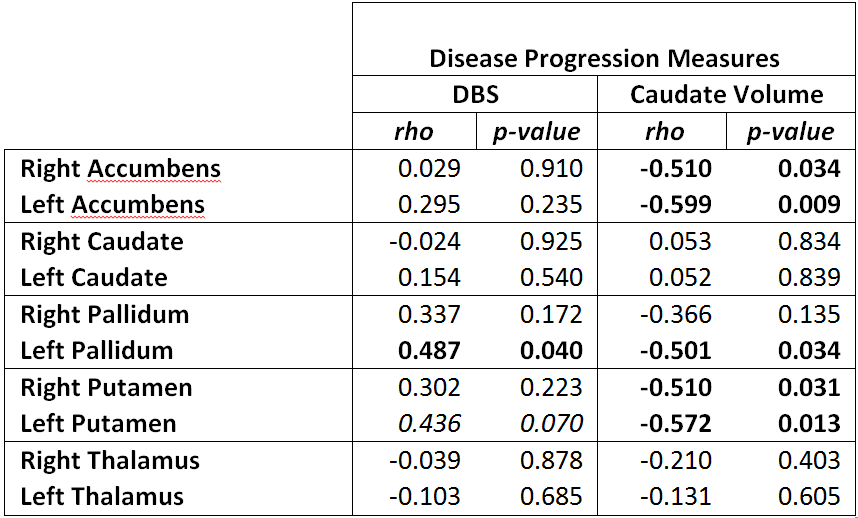
T2 in left and right accumbens and putamen negatively correlated with caudate volume (Table 2). T2 in left pallidum negatively correlated with caudate volume and positively correlated with DBS. There was a trend for positive correlation of left putamen and DBS.
Discussion and Conclusions
We have shown a T2 increase in the accumbens as HD progresses and trend towards decrease in T2 in left caudate in the HD group. We also found significant correlations between T2 and disease progression measures in accumbens, putamen and pallidum. If the measured T2 increases were a direct result of reduced iron content, these results would contrast with the suggestions from some of the previous reports implying increased iron accumulation from R2*=1/T2* measurements or T2*-based QSM3-4.
One limitation of this study is the small sample size and due to the relatively high variability observed in T2 values in HD participants (vs controls and pre-HD), the current results would not survive a multiple comparison correction. Our observations will require validation in a larger cohort.
Whilst T2 relaxation time should be affected by the presence of iron in ferritin and hemosiderin17, it is also affected by water content and mobility. Given the different mechanisms contributing to T2 and T2* measurements a complete agreement cannot be expected9. Ideally both T2 and T2* should be measured simultaneously to calculate T2’ after removing the effect of global field inhomogeneities that may affect T2* 9, possibly alongside QSM10 or MFC5. These multi-modal measurement will help further elucidate the role of iron in the pathogenesis of HD.
Acknowledgements
This work was partly supported by the National Institute for Health Research University College London Hospitals Biomedical Research Centre.References
1. Simon J.A. van den Bogaard, , Eve M. Dumas, , Raymund A.C. Roos, Chapter Ten - The Role of Iron Imaging in Huntington’s Disease, International Review of Neurobiology, Volume 110, 2013, Pages 241–250.
2. Sánchez-Castañeda C, Squitieri F, Di Paola M, Dayan M, Petrollini M, Sabatini U., The role of iron in gray matter degeneration in Huntington's disease: a magnetic resonance imaging study. Hum Brain Mapp. 2015 Jan;36(1):50-66.
3. Sánchez-Castañeda C, Cherubini A, Elifani F, Péran P, Orobello S, Capelli G, Sabatini U, Squitieri F., Seeking Huntington disease biomarkers by multimodal, cross-sectional basal ganglia imaging. Hum Brain Mapp. 2013 Jul;34(7):1625-35.
4. Domínguez JF, Ng AC, Poudel G, Stout JC, Churchyard A, Chua P, Egan GF, Georgiou-Karistianis N., Iron accumulation in the basal ganglia in Huntington's disease: cross-sectional data from the IMAGE-HD study. J Neurol Neurosurg Psychiatry. 2016 May;87(5):545-9
5. Dumas EM, Versluis MJ, van den Bogaard SJ, van Osch MJ, Hart EP, van Roon-Mom WM, van Buchem MA, Webb AG, van der Grond J, Roos RA; TRACK-HD investigators. Elevated brain iron is independent from atrophy in Huntington's Disease. Neuroimage. 2012 Jul 2;61(3):558-64.
6. Bartzokis G, Cummings J, Perlman S, Hance DB, Mintz J., Increased basal ganglia iron levels in Huntington disease., Arch Neurol. 1999 May;56(5):569-74.
7. Vymazal J, Klempír J, Jech R, Zidovská J, Syka M, Ruzicka E, Roth J., MR relaxometry in Huntington's disease: correlation between imaging, genetic and clinical parameters., J Neurol Sci. 2007 Dec 15;263(1-2):20-5.
8. Syka M, Keller J, Klempír J, Rulseh AM, Roth J, Jech R, Vorisek I, Vymazal J, Correlation between relaxometry and diffusion tensor imaging in the globus pallidus of Huntington's disease patients., PLoS One. 2015 Mar 17;10(3):e0118907.
9. Ordidge RJ, Gorell JM, Deniau JC, Knight RA, Helpern JA., Assessment of relative brain iron concentrations using T2-weighted and T2*-weighted MRI at 3 Tesla., Magn Reson Med. 1994 Sep;32(3):335-41.
10. Barbosa JH, Santos AC, Tumas V, Liu M, Zheng W, Haacke EM, Salmon CE., Quantifying brain iron deposition in patients with Parkinson's disease using quantitative susceptibility mapping, R2 and R2., Magn Reson Imaging. 2015 Jun;33(5):559-65.
11. JB Penney Jr, JP Vonsattel, ME MacDonald, JF Gusella, RH Myers, CAG repeat number governs the development rate of pathology in Huntington's disease, Ann Neurol, 41 (1997), pp. 689–692.
12. Melbourne A, Toussaint N, Owen D, Simpson I, Anthopoulos T, De Vita E, Atkinson D, Ourselin S., NiftyFit: a Software Package for Multi-parametric Model-Fitting of 4D Magnetic Resonance Imaging Data. Neuroinformatics. 2016 Jul;14(3):319-37.
13. M. Jorge Cardoso, Marc Modat, Robin Wolz, Andrew Melbourne, David Cash, Daniel Rueckert, and Sebastien Ourselin. Geodesic Information Flows: Spatially-Variant Graphs and Their Application to Segmentation and Fusion. IEEE Transactions on Medical Imaging, 34(9), 1976-1988. (2015)
14. http://cmictig.cs.ucl.ac.uk/niftyweb/
15. Sebastien Ourselin, A Roche, G Subsol, Xavier Pennec, and Nicholas Ayache. Reconstructing a 3d structure from serial histological sections. Image and Vision Computing, 19(1-2):25–31, 2001.
16. M. Jorge Cardoso, Marc Modat, Tom Vercauteren and Sebastien Ourselin., Scale Factor Point Spread Function Matching: Beyond Aliasing in Image Resampling, MICCAI 2015, Part II, 675-683.
17. Drayer B, Burger P, Darwin R, Riederer S, Herfkens R, Johnson GA, MRI of brain iron. .AJR Am J Roentgenol. 1986 Jul;147(1):103-10.
Figures