2498
Functional connectivity disturbances in prodromal Huntington’s disease predict future cognitive decline1Imaging Institute, The Cleveland Clinic, Cleveland, OH, United States, 2Lou Ruvo Center for Brain Health, The Cleveland Clinic, Cleveland, OH, United States, 3Department of Radiology, University of California, San Diego, La Jolla, CA, United States, 4Research Service, VA San Diego Healthcare System, San Diego, CA, United States, 5Carver College of Medicine, The University of Iowa, Iowa City, IA, United States, 6BrainDataDriven, Milwaukee, WI, United States
Synopsis
This study investigates intrinsic functional connectivity of the dorsal caudate in prodromal Huntington’s disease participants. We find that connectivity to the left caudate increases as estimated time to a manifest diagnosis decreases, and that stronger connectivity between the right middle frontal gyrus and left caudate is predictive of future cognitive decline.
Purpose
During the prodromal phase of Huntington’s disease (prHD), there are disturbances in intrinsic functional connectivity (iFC) from resting-state functional fMRI (rs-fMRI) [1-3]. Aberrant iFC in prHD also correlates with cognitive functions that are known to decline as individuals approach a manifest diagnosis [3]. However, longitudinal changes in iFC within two to three years have not been found in the prodromal phase [4-5]. In contrast, progressive brain atrophy in prHD is particularly striking in the caudate nucleus, which is densely interconnected with cortical networks that modulate different aspects of cognition. The current study used a seed-based approach to identify aberrant iFC of the bilateral dorsal caudate in prHD participants compared to controls. We then examined whether iFC at baseline predicted cognitive decline at a follow-up visit.Methods
In an IRB-approved protocol, 34 gene-negative controls (NEG group, mean age 50 ± 10.6; 11 males) and 54 prHD participants (mean age 40.4 ± 11.5; 12 males) were scanned at 3T in a 12-ch receive head coil. Scans included T1-MPRAGE and a rs-fMRI scan (2x2x4mm voxels, 1954 Hz/pix BW, 31 axial slices, TR/TE/FA=2800/29/80).
The prHD participants were stratified into low (n=16), medium (n=22), and high (n=16) baseline progression groups based on their CAG-Age Product (CAP) score, an index of disease burden, which estimates time to a manifest motor diagnosis.
Rs-fMRI analysis
Rs-fMRI scans were corrected for motion and physiologic noise, detrended, and lowpass filtered [7,8]. 3mm in-plane ROIs were placed in the bilateral rostral caudate based on coordinates taken from [9]. These ROIs were used to create individual whole-brain rs-fMRI maps, as described in [10].
For each caudate seed, group differences between NEG, LOW, MED, and HIGH were tested using ANCOVA with age as a covariate. The resulting maps were thresholded using the AFNI AutoCorrelation Function method and used to create a mask of significant ROIs for each seed region.
Predictive analysis
A subset of participants (25 NEG; 36 prHD) were administered measures of cognitive function at a second time point (median follow up time: NEG 3.03 years; prHD 2.93 years). Cognitive decline in prHD participants was defined relative to decline in the NEG group. A prHD subject was classified as ‘declining’ if they showed greater than a 1.5 standard deviation decline on the Stroop Color-Word Interference task or the Symbol Digit Modalities Test or a greater than 1.0 standard deviation decline on the Trail Making Test. PrHD participants were classified as “declining” if they showed a decrease in performance on three or more subtests.
For the 36 prHD subjects with longitudinal cognitive data, the ANCOVA mask for each seed was transformed to original space and applied to the functional connectivity map. For each ROI, mean connectivity to the seed region was calculated and entered in a logistic regression. Predictors included mean connectivity for a given ROI and baseline caudate volume. The categorical variable was “declining” or “not declining.”
Results
Baseline analysis
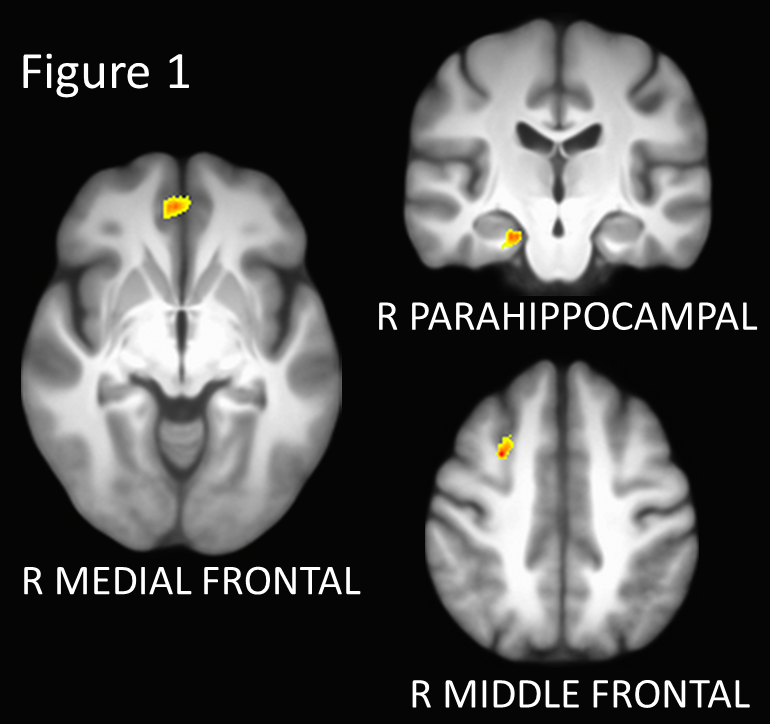
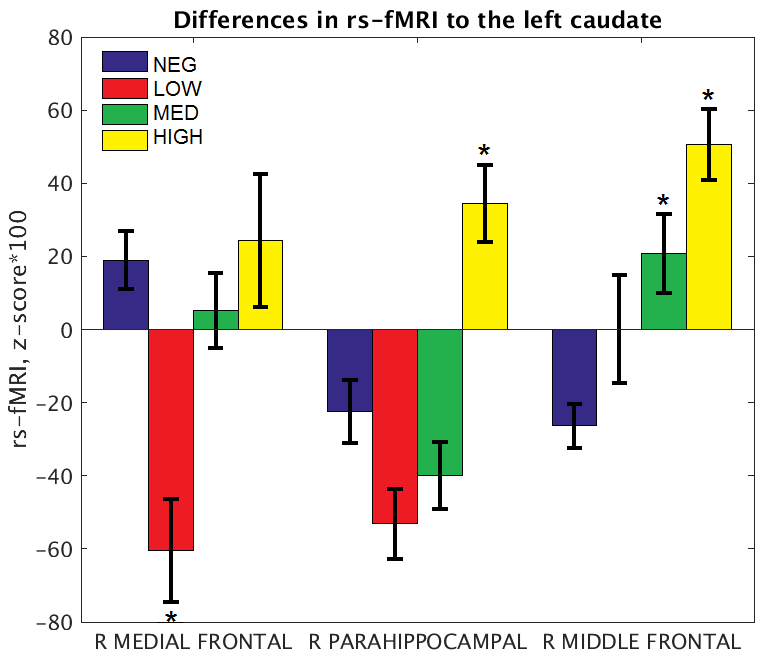
Three regions showed significant group differences in connectivity to the left caudate (p < 0.005, corrected; Figures 1 and 2). Connectivity of the right medial frontal gyrus was lower in the LOW group than in the NEG, MED, and HIGH groups. Connectivity of the right parahippocampal gyrus was increased in the HIGH group relative to all other groups. Finally, connectivity of the right middle frontal gyrus increased in stepwise in association with disease burden, with higher functional connectivity in the MED and HIGH groups relative to the NEG group. No regions showed significant group differences in connectivity to the right caudate.
Predictive analysis
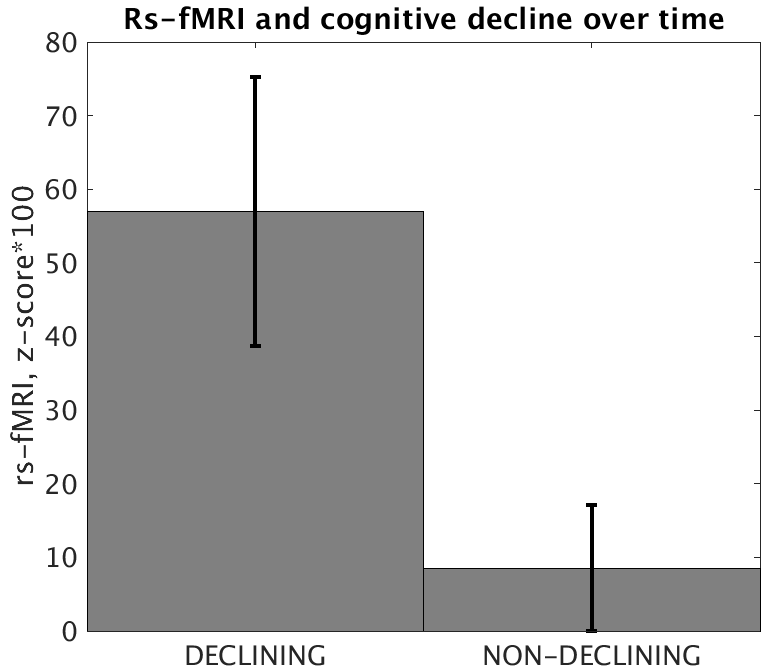
Of the 36 prHD subjects with longitudinal cognitive data, 9 (25%) were classified as declining. There were no differences in age, CAP, follow up time, level of education, or baseline performance on cognitive measures between declining and non-declining participants.Baseline caudate volume was not significantly predictive of cognitive decline for any of the three ROIs in the left caudate mask. The strength of connectivity between the left caudate and right middle frontal gyrus was significantly predictive of cognitive decline (p = 0.009, Cohen’s d = 0.972; Figure 3).
Discussion
Our cross-sectional results show that iFC of the caudate nucleus with the middle frontal cortex and parahippocampal gyrus strengthens as prHD participants near a manifest motor diagnosis, consistent with reports that iFC strength is dependent on disease burden [3,11]. Our results also suggest that disruptions in baseline connectivity may be predictive of cognitive decline within as little as two to three years, suggesting its clinical relevance to changes in cognitive symptomatology.Acknowledgements
This research was supported by grants from the NINDS (RO1 NS054893; U01 NS082083) and CHDI (A2015).References
[1] Unschuld et al. (2012) Impaired Cortico-Striatal Functional Connectivity in Prodromal Huntington’s Disease. Neuroscience Letters. 514: 204-209.
[2] Dumas et al. (2013) Reduced functional brain connectivity prior to and after disease onset in Huntington's disease. NeuroImage Clin. 2: 377-384.
[3] Harrington et al. (2015) Network topology and functional connectivity disturbances precede the onset of Huntington’s disease. Brain. 138(8): 2332-2346.
[4] Odish et al. (2015) Longitudinal resting state fMRI analysis in healthy controls and premanifest Huntington's disease gene carriers: a three-year follow-up study. Hum Brain Mapp. 36(1): 110-9.
[5] Gargouri et al. (2016) Longitudinal changes in functional connectivity of cortico-basal ganglia networks in manifests and premanifest huntington's disease. Hum Brain Mapp. 37(11) : 4112-4128.
[6] Zhang et al. (2011) Indexing disease progression at study entry with individuals at-risk for Huntington disease. Am J Med Genet B Neuropsychiatr Genet. 156B: 751-63.
[7] Beall EB and Lowe MJ. (2014) SimPACE: generating simulated motion corrupted BOLD data with synthetic-navigated acquisition for the development and evaluation of SLOMOCO: a new, highly effective slicewise motion correction. Neuroimage. 101: 21-34.
[8] Glover et al. (2000) Image-Based Method for Retrospective Correction of Physiological Motion Effects in fMRI: RETROICOR. Magnetic Resonance in Medicine. 44: 162-67.
[9] Di Martino et al. (2008) Functional Connectivity of Human Striatum: A Resting State fMRI Study. Cereb. Cortex. 18(12): 2735-2747.
[10] Lowe et al. (2014) Anatomic connectivity assessed using pathway radial diffusivity is related to functional connectivity in monosynaptic pathways. Brain Connectivity. 4: 558-65.
[11] Koenig et al. (2014) Functional Connectivity of Primary Motor Cortex is Dependent on Genetic Burden in Prodromal Huntington Disease. Brain Connectivity. 4(7): 535-546.
Figures