2496
Empirical Mode Decomposition and Amplitude Characteristics of Resting-State Networks in Parkinson’s Disease1Cleveland Clinic Lou Ruvo Center for Brain Health, LAS VEGAS, NV, United States, 2University of Colorado Boulder, Boulder, CO, United States, 3University of Management & Technology, Lahore, Pakistan
Synopsis
In this project, amplitudes of low-frequency fluctuations in resting-state fMRI data of subjects with Parkinson’s disease (PD) are studied and compared with matched normal controls. Empirical Mode Decomposition (EMD) is used to decompose the natural occurring frequency bands of major networks important in PD. The novelty of our approach lies in the data-adaptive decomposition of fMRI data using EMD, and identification of resting-state networks based on amplitude characteristics of intrinsic modes.
INTRODUCTION
Parkinson’s disease (PD) is the second most common neurodegenerative disease and affects more than 1% of the population over the age of 601. Neuroimaging studies of PD patients have shown that whole-brain functional networks such as the default mode network (DMN) and networks involving the motor pathway are affected leading to different functional connectivity spatial patterns when compared to normal controls (NC)2. Studies of the temporal characteristics of these brain networks have also shown abnormal spontaneous low-frequency fluctuations in PD3. The purpose of the current study is to characterize the fluctuations of the major resting-state brain networks in more detail in PD by using Empirical Mode Decomposition (EMD). EMD is a data driven-method that partitions a time series into naturally occurring intrinsic mode functions (IMFs) where each IMF occupies a characteristic frequency band without any assumptions of stationarity or linearity, or imposition of a priori assumptions on frequencies of interest4. Furthermore, spatial maps can also be computed for each IMF. We hypothesize that differences in both temporal and spatial characteristics exist for major brain networks in PD which can be detected by EMD analysis. In particular, we hypothesize that there will be a reduction in the amplitude of fluctuations in PD for IMFs in low frequency bands.METHODS
Functional MRI resting-state data (3T Siemens Trio, TR/TE/Flip Angle/Resolution=2.4s/25ms/80deg/3.3mm3, 40 axial slices, 210 time frames) were obtained for 18 PD (14 males; 64.25$$$\pm$$$9.5 years, UPDRS-III scores: 38.28$$$\pm$$$6.95; duration of the disease: 2.48$$$\pm$$$1.32 years) and 18 matched NC (14 males; 65.83$$$\pm$$$7.98 years) from the Parkinson’s Progression Markers Initiative (PPMI)5. The usual preprocessing steps included realignment, slice-timing correction, spatial smoothing (8mm), and normalization to the MNI 152 template using ANTS software (http://stnava.github.io/ANTs/). All voxels were resampled to a 2mm x 2mm x2mm grid. Group ICA (based on the FastICA algorithm6) was performed by stacking all data in the temporal domain to obtain the major resting-state networks. Using spatial regression of the found networks on the group time series data, the group time series signature were obtained and further characterized using EMD to obtain all IMFs corresponding to each network. For each IMF, the corresponding group spatial map was calculated by regression on the original stacked group data. The obtained group spatial maps resembled the spatial characteristics of each IMF.RESULTS
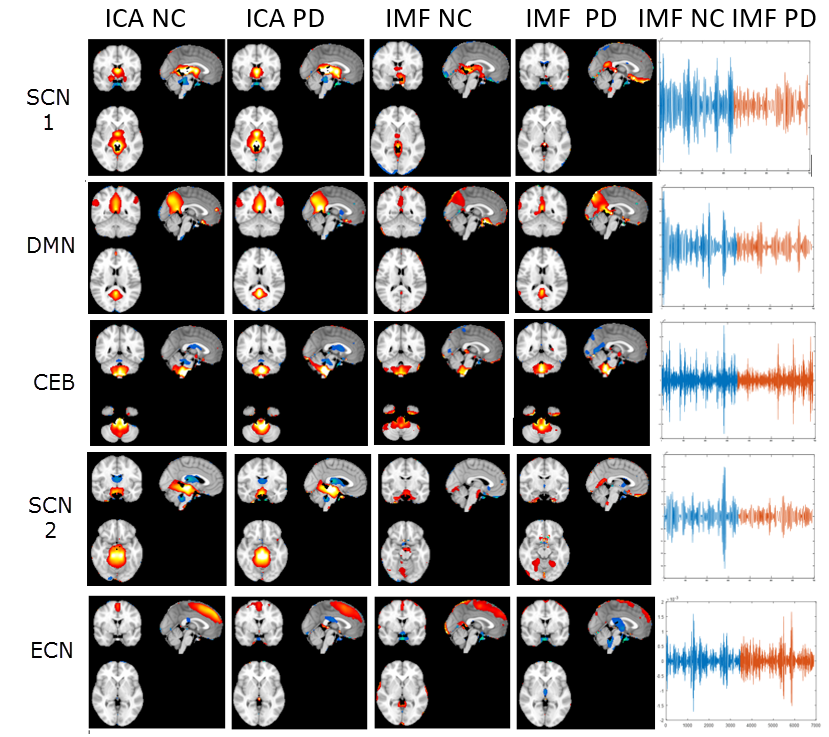
Fig.1 shows the results obtained for 5 different resting-state networks (subcortical networks SCN1, SCN2, default mode network DMN, cerebellar network CEB, executive control network ECN). The first two columns correspond to the group ICA results (|z|>2) for NC and PD, respectively. The last column shows one important IMF component of the EMD decomposition of each network (horizontal axis is time, vertical axis is amplitude of fluctuation, all subjects time courses are stacked together such that NC subjects are first (blue), then PD subjects (red). The stacking for the PD subjects was done so that UPDRS scores decrease from left to right on the time axis. Column 3 and 4 show the corresponding spatial maps of the IMF component for NC and PD. Using a 2-sample t-statistic, we computed the significance of the mean value of the instantaneous amplitude of the IMF for NC vs PD and found significant differences for SCN1, DMN, CEB and SCN2 networks (p-value <1E-6) but not for ECN (p=0.4). When comparing the more severe to the less severe patients according to the UPDRS score, we also observed a trend indicating less amplitude of the fluctuations in the more severe cases for many of the components.DISCUSSION
This study demonstrated a reduction in IMF amplitude in PD compared to NC for many of the studied brain networks that are important in PD (with the exception of the ECN). We also observed a general trend that the more severe PD patients (high UPDRS score) have on average less amplitude fluctuations of IMFs when compared to patients that are affected less severely. Our findings are consistent with electrophysiological data in PD where reduction in network dynamics, network connectivity, altered phase-amplitude coupling, and aberrant network synchrony have been demonstrated to correlate with disease severity7.CONCLUSION
We have studied the amplitude of fluctuations for major resting-state networks important in PD using EMD and found a reduction in IMF amplitude for patients vs controls for many of the studied networks with the exception of the ECN.Acknowledgements
The study was supported in parts by National Institute of General Medical Sciences (grant: P20GM109025), the National Institute of Biomedical Imaging and Bioengineering (grant: 1R01EB014284), and the Elaine P Wynn and Family Foundation. The Michael J. Fox Foundation supports the PPMI study for Parkinson’s Research. Other funding partners include a consortium of industry players, non-profit organizations and private individuals.References
[1] Tanner C.M, Goldmann S.M. Epidemiology of Parkinson’s Disease. Neurol. Clin. 1996, 14: 317-335.
[2] Van Eimeren T, et al. Dysfunction of the Default Mode Network in Parkinson’s Disease. Arch Neurol 2009, 66:877-883.
[3] Hu X-F, et al. Amplitude of Low-frequency Oscillations in Parkinson’s Disease. Chin Med J (Engl) 2015, 128:593-601.
[4] Flandrin P, et al. Empirical mode decomposition as a filter bank, IEEE Sig. Proc. Letters 2004, 11(2), 112-114.
[5] Marek K, et al. The Parkinson Progressive Marker Initiative (PPMI). Prog Neurobiol 2011, 95:629-635.
[6] Hyvärinen A. Fast and Robust Fixed-Point Algorithms for Independent Component Analysis. IEEE Transactions on Neural Networks 1999, 10(3):626-634.
[7] Tseng K-Y (editor). Cortico-Subcortical Dynamics in Parkinson’s Disease. Humana Press 2009.
Figures