2495
Differential Diagnosis of Parkinson’s disease, Progressive Supranuclear Palsy and Corticobasal syndromes using machine learning and MRI1MRC Cognition and Brain Sciences Unit, Cambridge, United Kingdom, 2Clinical Neurosciences, University of Cambridge, Cambridge, United Kingdom
Synopsis
In this study we combined machine learning with MRI for the differential diagnosis of three movement disorders: Parkinson’s disease (PD), progressive supranuclear palsy (PSP) and degenerative corticobasal syndrome (CBS). We compared the performance of such approaches when using T1-weighted and diffusion MRI, as well as different methods for feature extraction. Our results suggest that such methods could be used in the future to aid the differential diagnosis of PSP, CBS and PD, in conjunction with clinical assessment, with diffusion MRI data providing the most promising results.
Introduction
Early symptoms of akinetic rigidity and non-motor symptoms often overlap between Parkinson’s disease (PD), progressive supranuclear palsy (PSP) and degenerative corticobasal syndromes (CBS)1. Accurate early diagnosis is important not only for active patient management and care, but also to support ante mortem studies of pathogenesis. Previous studies have demonstrated success for differential diagnosis in parkinsonism using machine learning in combination with Magnetic Resonance Imaging (MRI)2,3,4, resulting in accuracies of 95% and higher. However, most of these studies have reported only results based on cross-validation, which is known to inflate the differentiating power of statistical classifiers. In addition, most studies have ignored the effect of motion in MRI data. In this study we used structural and diffusion MRI to compare closely matched groups of PD, PSP, and CBS using a leave-three-out cross-validation followed by validation on an independent dataset. We also compared two different approaches for feature selection.Methods
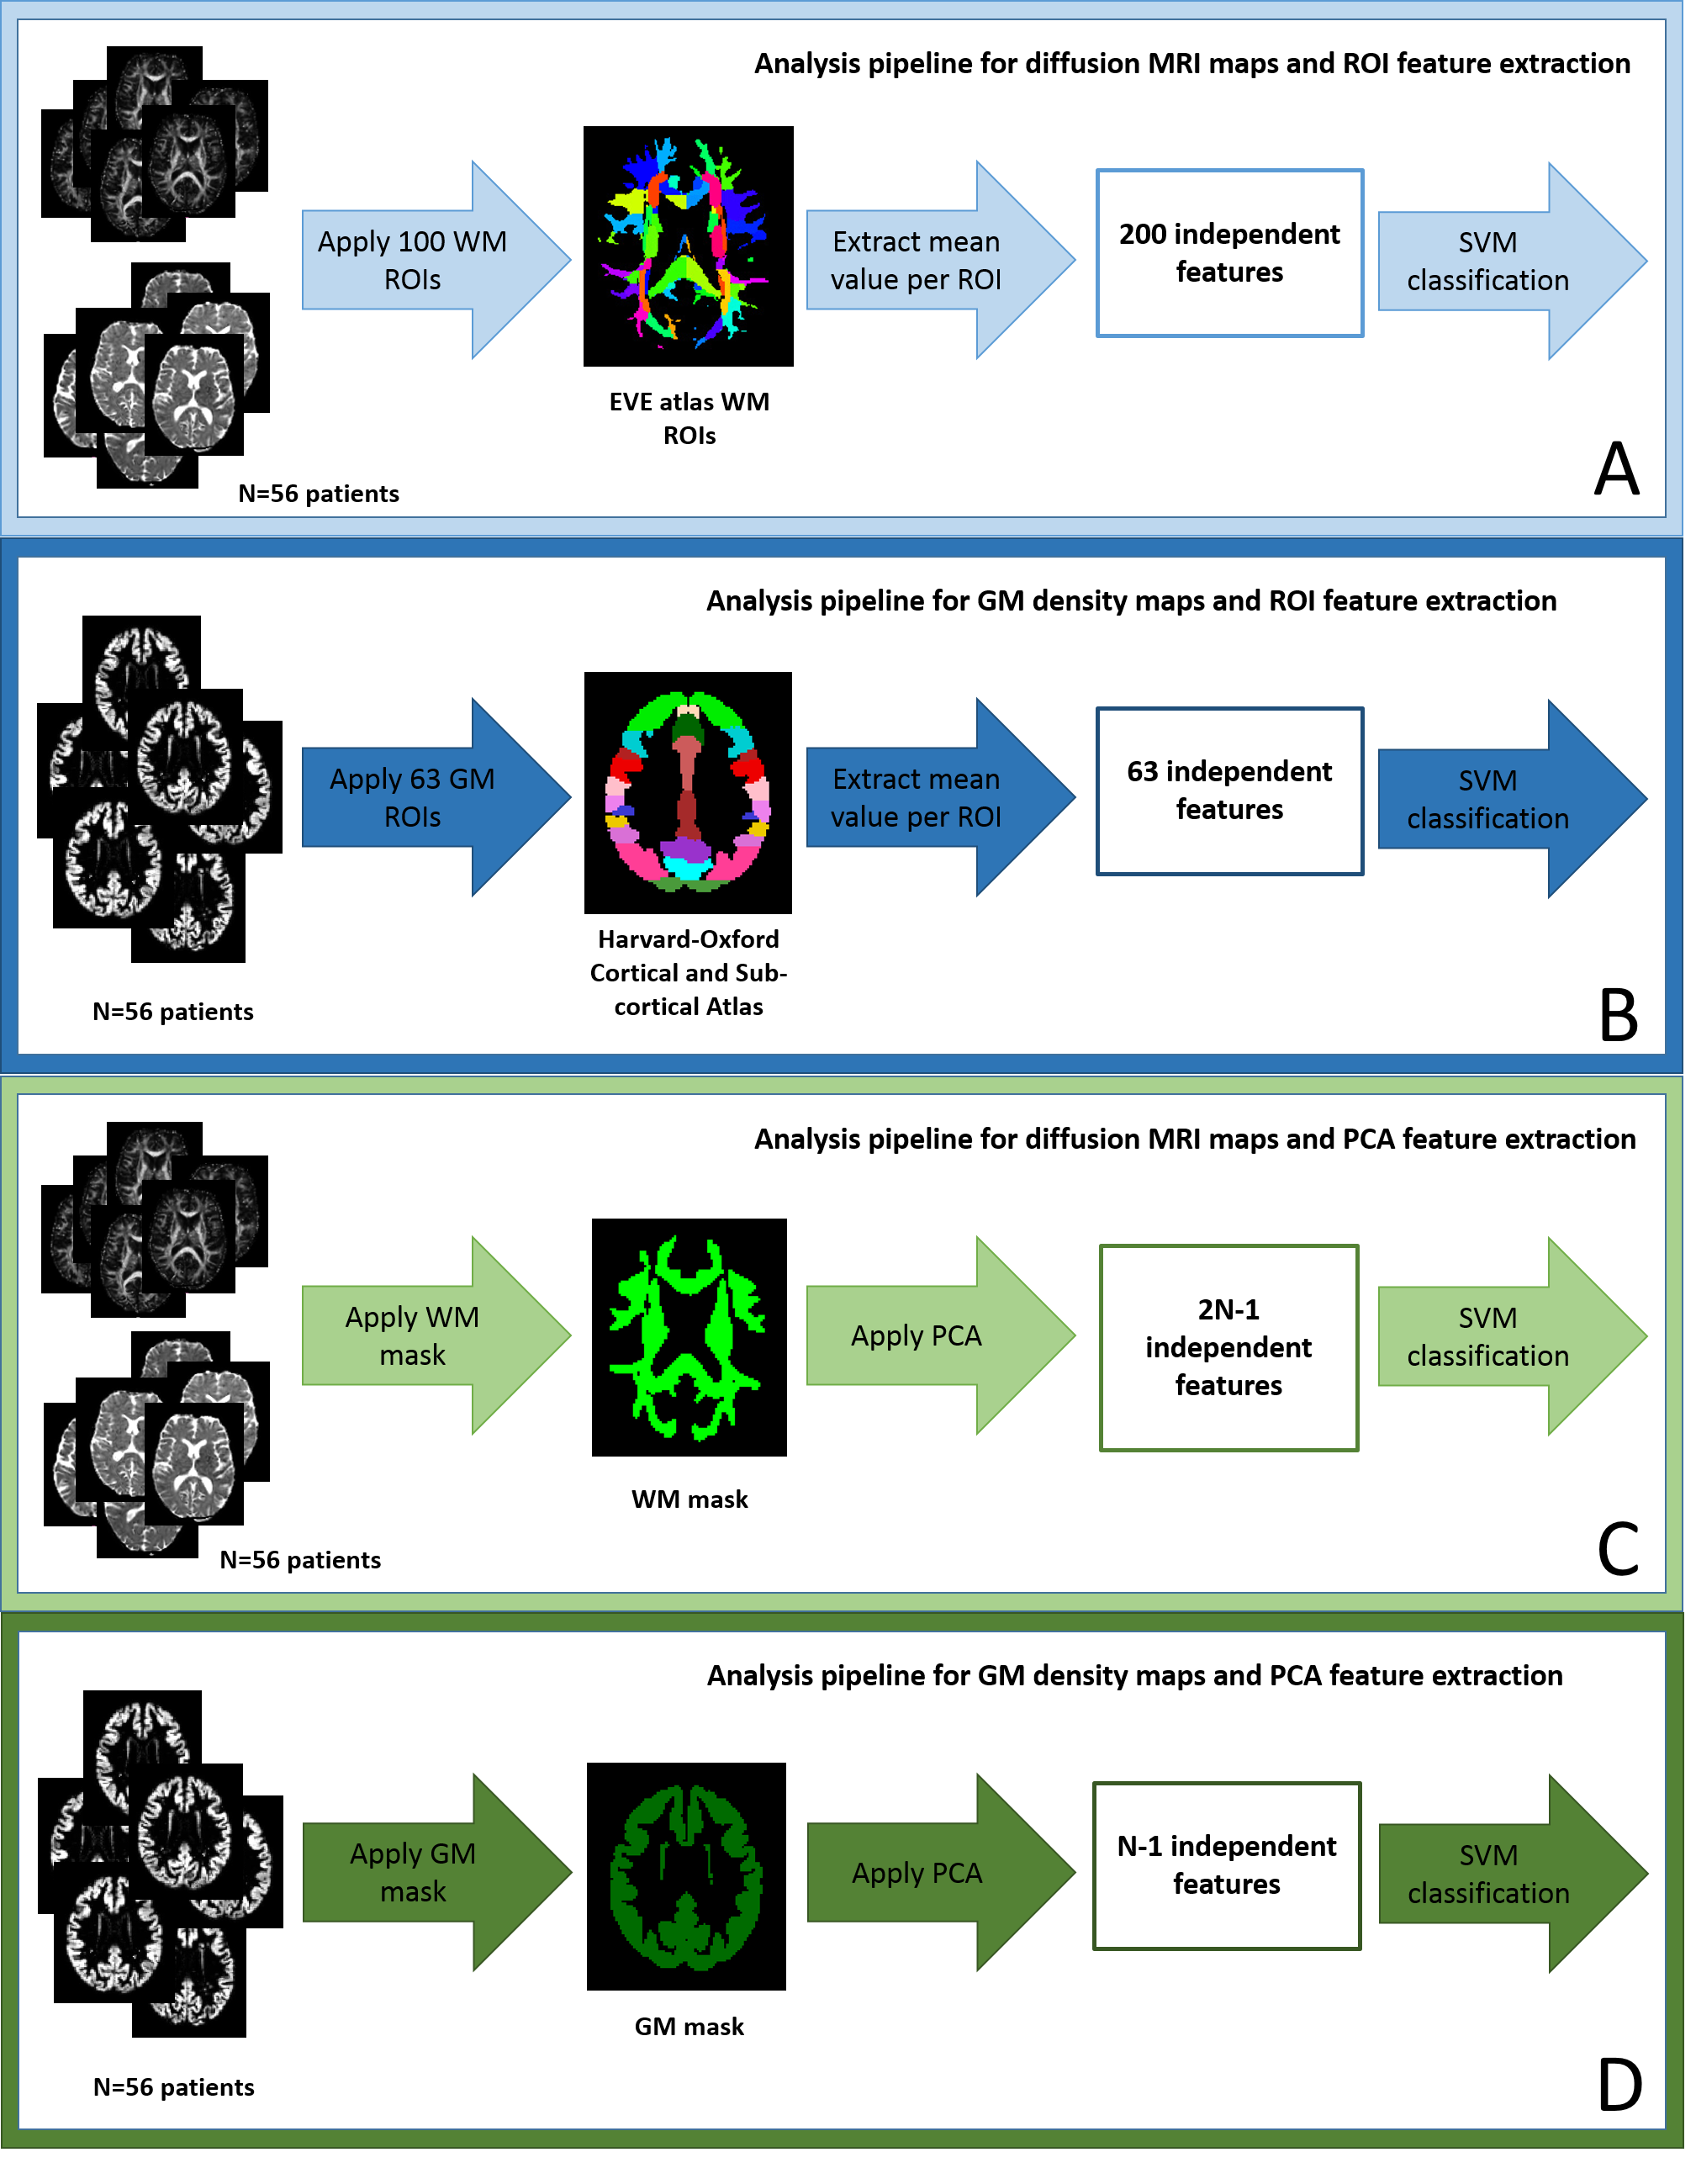
Diffusion and T1-weighted MRI data were acquired using a 3T TRIO Siemens scanner. Data were acquired for 37 PD, 50 PSP and 36 CBS patients. MRI data in general, and diffusion MRI in particular, are known to suffer from significant distortions in the presence of motion. Given the severity of motor symptoms associated with parkinsonism, metrics of motion were estimated for both T1-weighted and diffusion data, and outliers excluded. Patients were also excluded if they moved more than 3mm (1.5 x voxel size) between any two diffusion MRI volumes. This reduced our sample to 32 PD, 26 CBS and 33 PSP. These resulting groups were confirmed to be matched for gender, age, and motion metrics using chi-squared or t-tests, as appropriate. From these data, a subset with 19 patients in each group matched for the clinical score UPDRS-III was identified (training group). The remaining 34 patients (testing group) were used for independent validation. T1-weighted images were segmented to generate grey matter (GM) density maps using DARTEL in spm125. Diffusion MRI data were skull-stripped and motion corrected using FSL v5.0.96, and the diffusion tensor model fitted using an in-house non-linear fitting algorithm. Fractional Anisotropy (FA) and mean diffusivity (MD) were computed for each patient. FA and MD maps were transformed onto a common template space using a tensor-based registration (DTI-TK7). For GM maps, feature selection was performed using the cortical and subcortical ROIs from the Harvard-Oxford Atlas8, and these features were combined with support vector machines (SVMs)10 to construct statistical models for pairwise classification of PD, CBS and PSP. For the FA and MD maps, the white matter ROIs from the EVE atlas9 were used for feature extraction, followed by a similar SVM analysis. A second method using PCA for feature selection was also implemented (Figure 1). Classification accuracies were estimated for each data modality using two separate approaches: leave-three-out cross-validation using the training group, and independent validation using the training group to train the model and the testing group to estimate accuracy.Results and Discussion
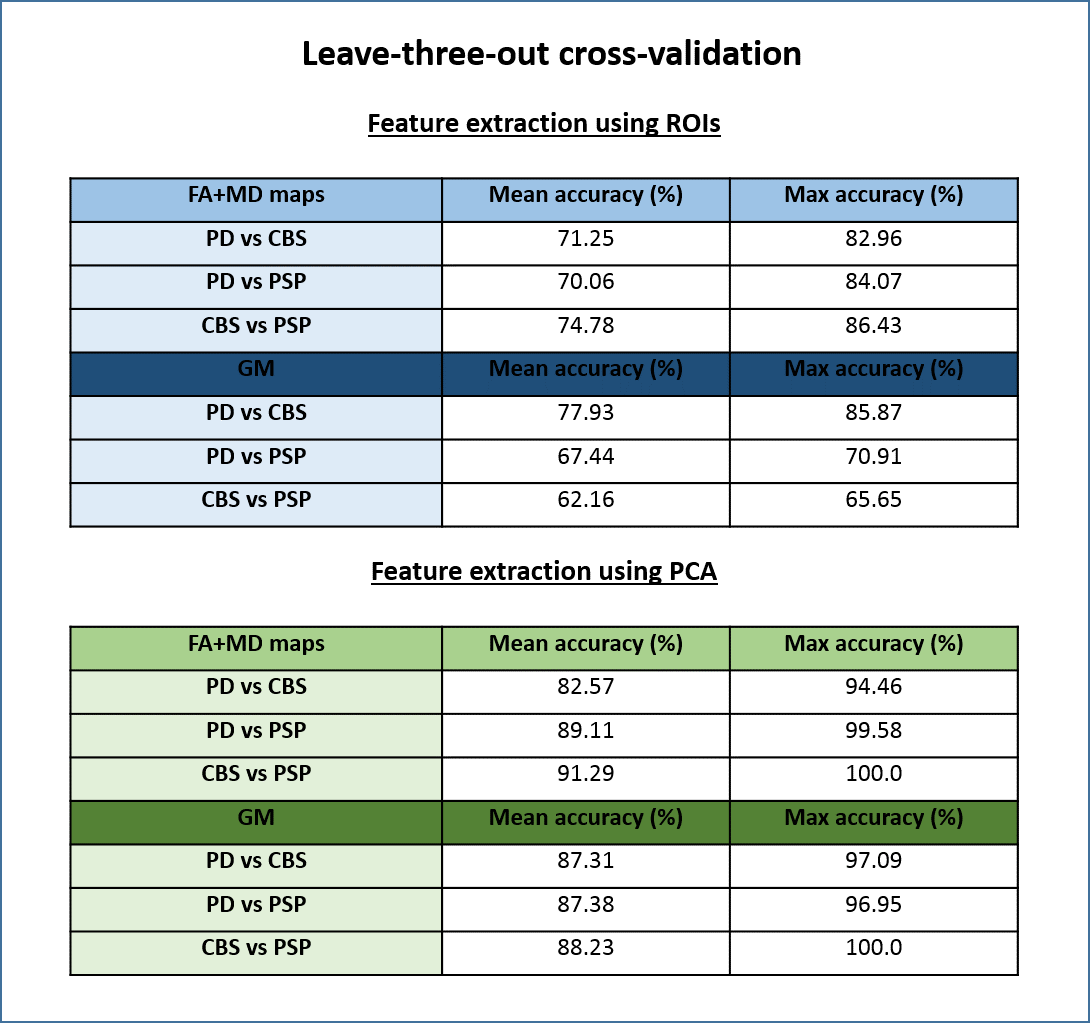
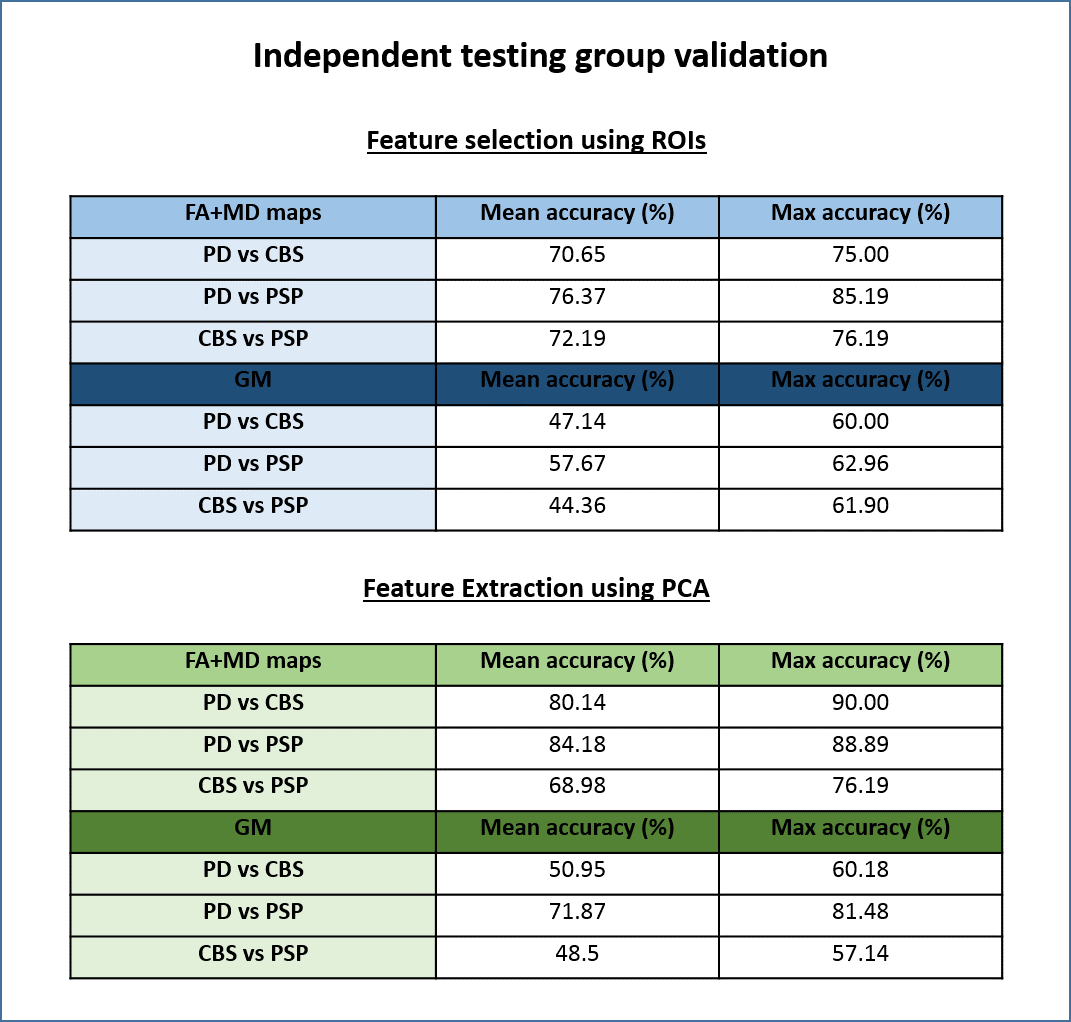
A summary of the classification results obtained is presented in Figures 2 and 3. We first note that the results obtained with cross-validation and ROI-based features (Figure 2) are well above chance level (50%), but significantly lower than the ones reported by previous studies2. We believe this to be the effect of using well matched groups and excluding datasets with extreme motion, since our results were also inflated before controlling for motion. The results obtained with diffusion and MPRAGE data were very similar, with FA and MD slightly outperforming GM maps. Models using PCA for feature selection outperformed ROIs in all cases. The validation analysis on an independent set of patients (Figure 3) resulted in lower classification accuracies, as expected, but the decrease in accuracy was lower when FA and MD were used; for GM maps accuracy is no longer reliably above chance.Conclusion
The results of this study suggest that SVMs and MRI data could be used in the future to aid the differential diagnosis of PSP, CBS and PD in conjunction with clinical assessment, however the contribution of these techniques may not be as substantial as reported by previous studies, as we believe those to be inflated by different levels of motion across patient groups. The models using FA and MD maps were particularly encouraging as their results were more generalizable to independent patients, while the models using GM maps could not robustly be used for classification of unseen patients. Future work will focus on combining features from diffusion and structural MRI in a single model, as well as 3-way classification.Acknowledgements
This research was funded by the Medical Research Council.References
[1] Coyle-Gilchrist IT, Dick KM, Patterson K, Vázquez Rodríquez P, Wehmann E, Wilcox A, Lansdall CJ, Dawson KE, Wiggins J, Mead S, Brayne C, Rowe JB. “Prevalence, characteristics, and survival of frontotemporal lobar degeneration syndromes.” Neurology 2016.
[2] Prodoehl, Janey, Hong Li, Peggy J Planetta, Christopher G Goetz, Kathleen M Shannon, Ruth Tangonan, Cynthia L Comella. “Diffusion Tensor Imaging of Parkinson’s Disease, Atypical Parkinsonism, and Essential Tremor.” Movement Disorders 2013.
[3] Focke, Niels K, Gunther Helms, Sebstian Scheewe, Pia M Pantel, Cornelius G Bachmann, Peter Dechent, Jens Ebentheuer, Alexander Mohr, Walter Paulus, and Claudia Trenkwalder. “Individual Voxel-Based Subtype Prediction Can Differentiate Progressive Supranuclear Palsy from Idiopathic Parkinson Syndrome and Healthy Controls.” Human Brain Mapping 2011.
[4] Marquand, Andre F, Maurizio Filippone, John Ashburner, Mark Girolami, Janaina Mourao-Miranda, Gareth J Barker, Steven C R Williams, P Nigel Leigh, and Camilla R V Blain. 2013. “Automated, High Accuracy Classification of Parkinsonian Disorders: A Pattern Recognition Approach.” PloS One 8 (7). Public Library of Science: e69237. doi:10.1371/journal.pone.0069237.
[5] http://www.fil.ion.ucl.ac.uk/spm/software/spm12/
[6] https://fsl.fmrib.ox.ac.uk/fsl/fslwiki/
[7] Zhang, H., Avants, B.B, Yushkevich, P.A., Woo, J.H., Wang, S., McCluskey, L.H., Elman, L.B., Melhem, E.R., Gee, J.C. “High-dimensional spatial normalization of diffusion tensor images improves the detection of white matter differences in amyotrophic lateral sclerosis”. IEEE Transactions on Medical Imaging, 2007.
[8] http://neuro.imm.dtu.dk/wiki/Harvard-Oxford-Atlas
[9] http://cmrm.med.jhmi.edu/cmrm/atlas/human_data/file/JHUtemplate_newuser.html
[10] C.C. Chang, C.J. Lin. "LIBSVM: a library for support vector machines." ACM Transaction on Intelligent Systems and Technology 2011.
Figures