2494
Preliminary findings of elevated iron deposition in the substantia nigra in patients with idiopathic Parkinson’s disease using a high iron content evaluation of quantitative susceptibility mapping1Research, Magnetic Resonance Innovations, Inc., Detroit, MI, United States, 2Department of Medical Imaging, Saskatoon Health Region, 3Research, The MRI Institute for Biomedical Research, Detroit, MI, United States, 4Division of Neurology in the Department of Medicine, University of Saskatchewan, 5Department of Medical Imaging, University of Saskatchewan, Saskatoon, SK, 6Radiology, Wayne State University School of Medicine
Synopsis
Iron deposition in the brain has been implicated in neurodegenerative diseases like Parkinson’s Disease. We used quantitative susceptibility mapping to evaluate iron content in the substantia nigra and red nucleus in 18 patients with idiopathic Parkinson’s Disease (IPD). Susceptibility was calculated for whole structure and a thresholded high-iron region (RII) and compared with controls. We found that global and RII mean susceptibility higher in the substantia nigra compared with normals, and that the slope of RII susceptibility vs age is higher in IPD compared to normals which may suggest an increased rate of iron deposition at disease onset.
PURPOSE
Iron deposition in the brain has been implicated in the role of neurodegenerative disease and normal aging, and thus is of great interest to researchers and clinicians. Assessing iron content in the brain with MR imaging is frequently performed using R2*, which is a sum of the relaxation due to spin-spin interactions and local susceptibility effects1. Some of the drawbacks of R2* iron measurement, however, are that it is less sensitive than phase and susceptibility and its accuracy is dependent on imaging parameters, orientation, and SNR1. More recently, a technique called quantitative susceptibility mapping (QSM) has been of interest for researchers and clinicians studying brain iron. The technique uses magnitude and unfiltered phase SWI data to create a susceptibility map (SM) of the tissue. These SMs are directly proportional to iron content and help to visualize areas where iron is more prominent, especially in deep gray matter nuclei2,3. Our group has previously used this technique on 174 healthy controls to establish an age-dependent baseline of iron deposition in the midbrain using QSM4. In this work, we assessed iron content in the midbrain of Parkinson’s disease (PD) patients using QSM to evaluate iron in the entire structure of interest as well as the novel concept of evaluating the properties of the high-iron content region. Using regional analysis shows higher correlation between age and iron deposition compared to a global approach, providing a reliable and sensitive reference for what can be considered normal iron content for studies of neurodegenerative diseases.METHODS
Eighteen patients with mild to moderate Idiopathic Parkinson’s Disease (IPD) were imaged with a 3T Skyra system (Siemens, Erlangen, Germany) with a 20-channel head/neck coil with a venous imaging protocol5. Multi-echo SWI imaging was performed with the following parameters, TE: 6 and 20 ms, TR: 30 ms, FA: 15°, and resolution: 0.5x0.5x2.0 mm3. Because several of the cases were subject to cusp artifacts, magnitude and phase images were reconstructed using the original channel data using an in-house Matlab-based software to mitigate these effects6. QSM images were reconstructed by using our in-house Matlab based toolbox SMART 2.0 (MRI Institute for Biomedical Research, Detroit, MI, USA). Four steps were applied to generate the resulting QSM images: brain extraction7, phase unwrapping8, background field removal9, and an iterative QSM approach2,10. Upon QSM generation, the boundaries for the substantia nigra (SN) and red nucleus (RN) were manually traced followed by global and regional analyses of iron content as a function of age using previously established methods4. Mean susceptibility of all structures is reported for global (whole) and high iron (RII) regions.RESULTS
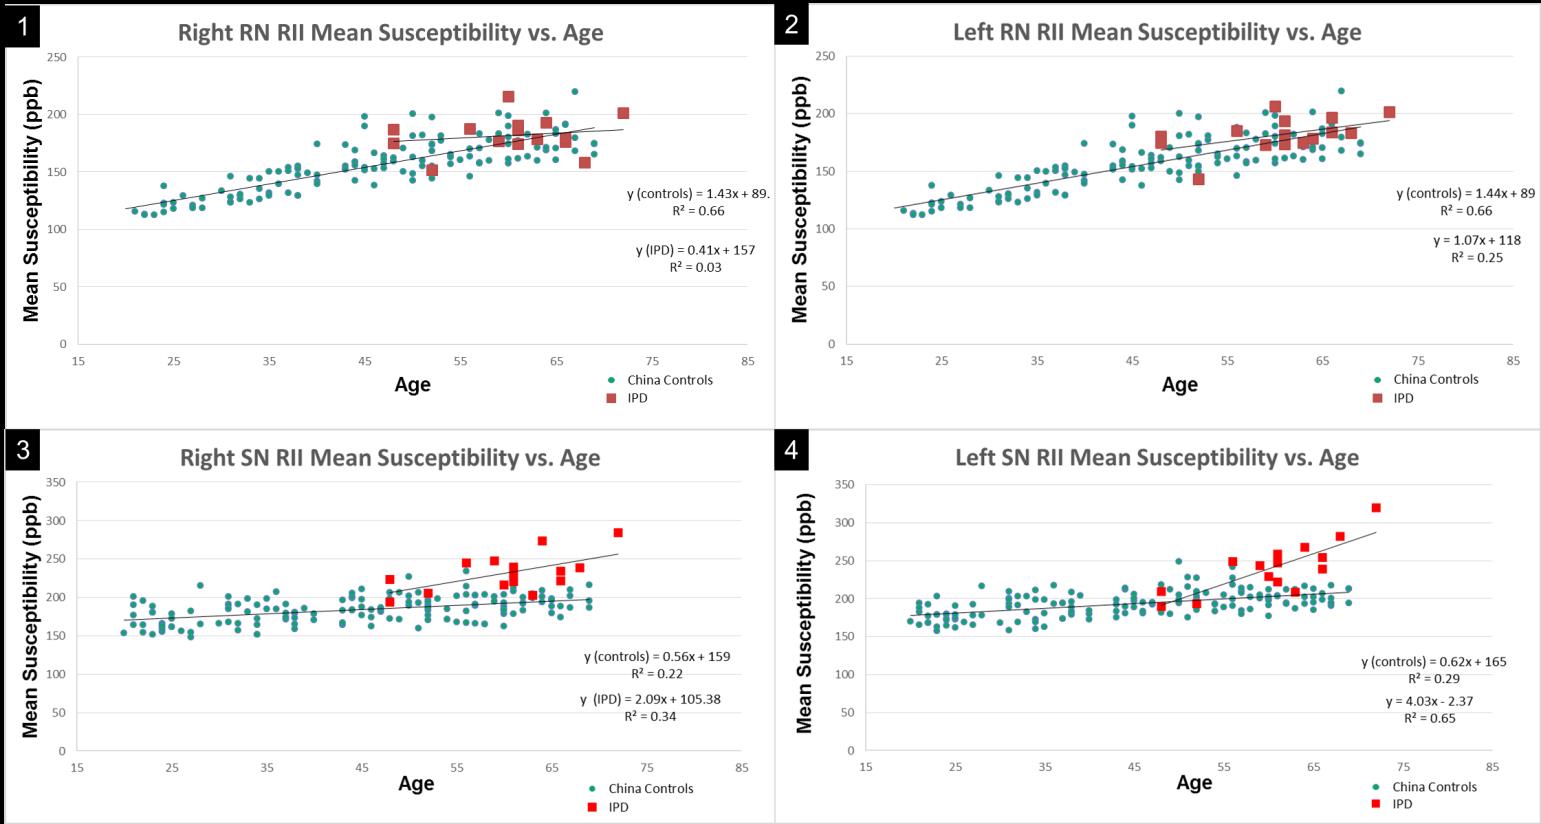
Fifteen IPD patients were included in the study with a mean age of 60.3 years (SD=6.9), and three patients were excluded where cusp artifacts could not be corrected. Mean global susceptibility for the right and left SN were 172 ppb (SD=32) and 170 ppb (SD=43), respectively. For the right and left RN, mean global susceptibility was 104 ppb (SD=30.0) and 94 ppb (SD=28). RII mean susceptibility for the right and left SN was 232 ppb (SD=25) and 241 ppb (SD=35). For the right and left RN, RII mean susceptibility was 184 ppb (SD=14) and 195 (SD=11). In an unpaired two-tailed t-test comparing RII iron content between IPD and normals within the same age range (n=62), the IPD group showed higher iron in the RN (p=0.03) and SN (p<0.001). Plots depicting RII mean susceptibility vs. age, along with their regression lines compared to controls4 are shown for the right and left RN and SN (Figures 1-4).DISCUSSION
No apparent differences in mean iron were observed globally for the RN. The SN, however, not only had higher global iron content, but also much higher regional iron content compared to controls. The slopes of the linear regression lines (Figure 3-4) were also steeper compared with previously published controls which may suggest an increased rate of iron deposition after the disease onset. An advantage of using RII compared to global regional analysis is that the variability of the results decreases and it is generally a more robust approach4. Any errors generally present in estimating volumes of the structure itself are removed because low iron regions are naturally excluded. Still the number of cases is limited and more subjects should be collected. Another difficulty was imaging severe IPD cases because of motion. Faster scanning may make it possible to extract these iron measurements in the future.CONCLUSION
QSM using a two-region approach was a successful and robust method in showing differences in iron content between some IPD patients and healthy controls.Acknowledgements
We would like acknowledge MR Innovations India for assistance with MRI data processing.References
1. Daugherty AM, Raz N. Appraising the Role of Iron in Brain Aging and Cognition: Promises and Limitations of MRI Methods. Neuropsychol Rev 2015;25:272-287
2. Haacke, E.M., et al., Susceptibility mapping as a means to visualize veins and quantify oxygen saturation. J Magn Reson Imaging, 2010. 32(3): p. 663-76.
3. Haacke EM, Liu S, Buch S, et al. Quantitative susceptibility mapping: current status and future directions. Magn Reson Imaging 2015;33:1-25.
4. Liu M, Liu S, Ghassaban K, et al. Assessing global and regional iron content in deep gray matter as a function of age using susceptibility mapping. J Magn Reson Imaging 2015.
5. Utriainen D, Feng W, Elias S, et al. Using magnetic resonance imaging as a means to study chronic cerebral spinal venous insufficiency in multiple sclerosis patients. Tech Vasc Interv Radiol 2012;15:101-112.
6. Liu, S. Ye, Y. et al. Multi-channel Data Combination with Linear Phase Baseline Correction. ISMRM 23rd Annual Meeting & Exhibition, May 30 – June 5, 2015, Toronto, Ontario, Canada.
7. Rorden, C., Brett, M. (2000). Stereotaxic display of brain lesions.Behavioural Neurology. 12, 191-200
8. Abdul-Rahman, H.S., et al., Fast and robust three-dimensional best path phase unwrapping algorithm. Appl Opt, 2007. 46(26): p. 6623-35.
9. Schweser, F., et al., Quantitative imaging of intrinsic magnetic tissue properties using MRI signal phase: an approach to in vivo brain iron metabolism? Neuroimage, 2011. 54(4): p. 2789-807.
10. Tang, J., et al., Improving susceptibility mapping using a threshold-based K-space/image domain iterative reconstruction approach. Magn Reson Med, 2013. 69(5): p. 1396-407.
Figures