2493
Comparison of MR spectroscopic imaging findings between different MAPT and COMT genotypes of cognitively normal or mild cognitively impaired Parkinson’s disease patients at 3T1Institute of Biomedical Engineering, Bogazici University, Istanbul, Turkey, 2Hulusi Behcet Life Sciences Research Laboratory, Istanbul University, Istanbul, Turkey, 3Istanbul University, Institute of Experimental Medicine, Department of Neuroscience, Istanbul, Turkey, 4Institute of Psychology and Cognition Research, University of Bremen, Germany, 5Department of Neurology, Istanbul Faculty of Medicine, Istanbul University, Istanbul, Turkey, 6CorTechs Labs, San Diego, CA, USA, 7Department of Physiology, Istanbul Faculty of Medicine, Istanbul University, Istanbul, Turkey, 8Institute of Experimental Medicine, Istanbul University, Istanbul, Turkey
Synopsis
Microtubule-associated protein tau (MAPT) and catechol-O-methyltransferase (COMT) genotypes have been associated with cognitive impairment in Parkinson’s disease (PD). The aim of this study is to compare MR spectroscopic imaging findings between cognitively normal PD (PD-CN) or mild cognitively impaired PD (PD-MCI) patients with different MAPT and COMT genotypes at 3T. We observed a higher Ins/Cr in cerebral white matter of PD-MCI with MAPT H1/H2 genotype than PD-CN with MAPT H1/H1 genotype and a higher Cho/Cr in thalamus of PD-MCI with COMT Met/Met genotype and PD-CN with COMT Val/Val or Val/Met genotype than PD-CN with COMT Met/Met genotype.
PURPOSE
MR spectroscopic imaging (MRSI) is a non-invasive technique that may help in finding biomarkers for mild cognitive impairment in Parkinson’s disease (PD-MCI)1. Previous studies reported a lower Cho/Cr2 and a lower NAA/Cr3 in posterior cingulate gyrus and a lower NAA/Cr in occipital lobe and higher Cho/Cr in posterior cingulate gyrus1 in PD-MCI. Additionally, lower NAA, NAA/Cr, and Glu/Cr has been reported in posterior cingulate gyrus in PD dementia4. MAPT and COMT genotypes have been associated with cognitive impairment in Parkinson’s disease 5, 6. The goal of this study is to investigate the relation of COMT Val158Met polymorphism and MAPT haplotypes with the MR spectroscopic imaging findings in cognitively normal (PD-CN) and PD-MCI patients at 3T.METHODS
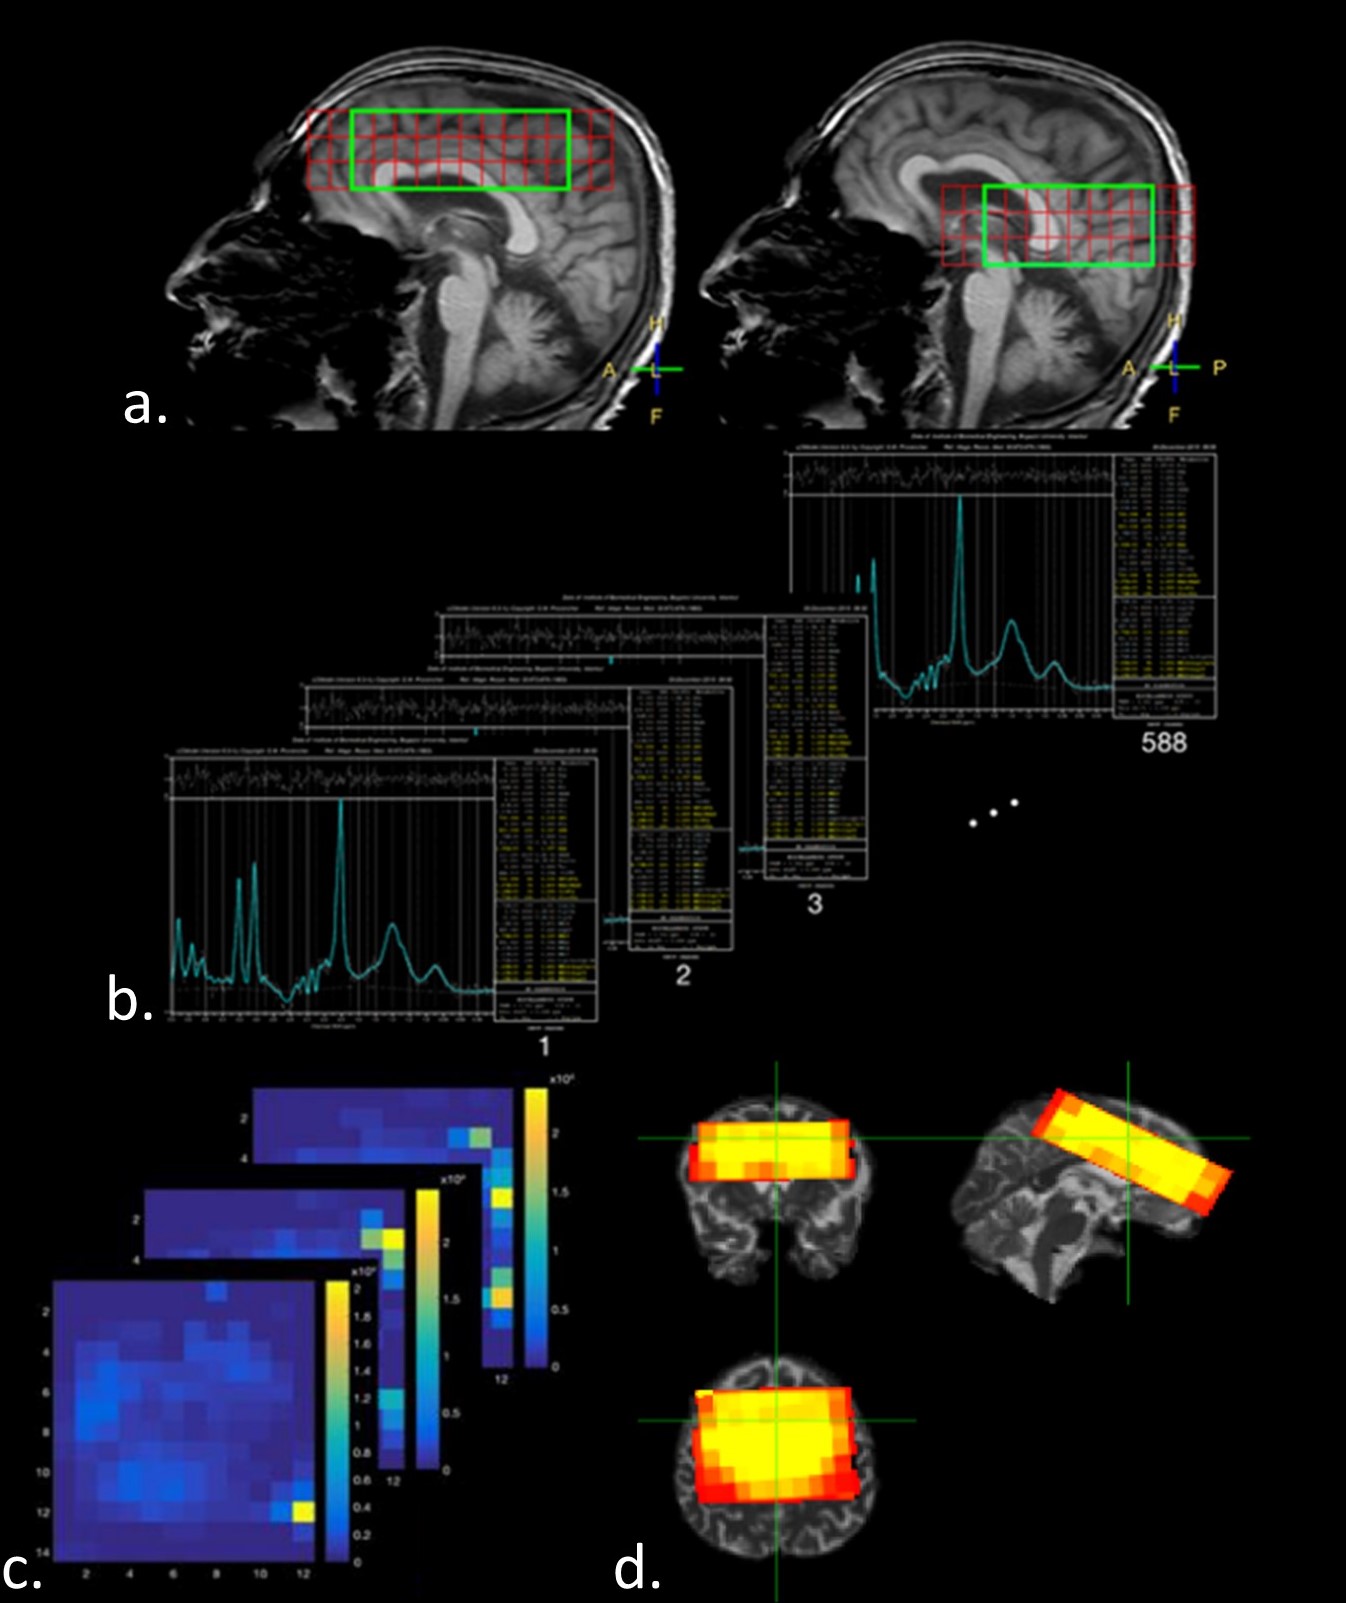
A total of 46 patients (26 with PD-MCI and 20 with PD-CN) were included in this study. All subjects provided informed consent. A 10 cc venous blood sample was obtained from the subjects for genetic analysis. DNA was extracted from peripheral blood samples using blood DNA preparation kit (Jena Bioscience). Single nucleotid polimorphism (SNP) genotyping for rs9468 (MAPT H1 vs. H2 haplotype) and rs4680 (COMT Val/Val, Val/Met vs Met/Met haplotype) was performed by using Stratagene Mx3005p real-time PCR machine (Agilent Technologies, USA). Three dimensional proton MR spectroscopic imaging (1H-MRSI) data was acquired with Point-RESolved Spectroscopy (PRESS) sequence using a Philips 3T MR scanner with 32 channel head coil (TR=1000ms,TE=52ms, 1000Hz, 1024 points,14x14x3 array, voxel size=10x10x10mm, scan time=8min). The MR spectroscopic data of patients were quantified by LCModel7 and normalized metabolite concentration ratio maps were obtained. These spatial MRS ratio maps were overlaid onto reference T2-weighted MR images and then registered to MNI152 brain atlas8. Figure 1 shows an example MRSI data acquisition region and processing steps in a patient. After the LCModel quantification, NAA/Cr ratio maps overlaid onto the reference T2 images were registered to the MNI152 atlas. Afterwards, regions of interests were defined for seven different brain areas, including precuneus, posterior cingulate gyrus, cerebral white matter, cerebral gray matter, frontal lobe, occipital lobe, and thalamus by using FSL atlas tool9. Kruskal-Wallis test with Dunn’s post-hoc test was applied to assess MR spectroscopic imaging differences among PD-MCI and PD-CN with different genotypes. A P-value of less than 0.05 was considered as statistically significant.RESULTS
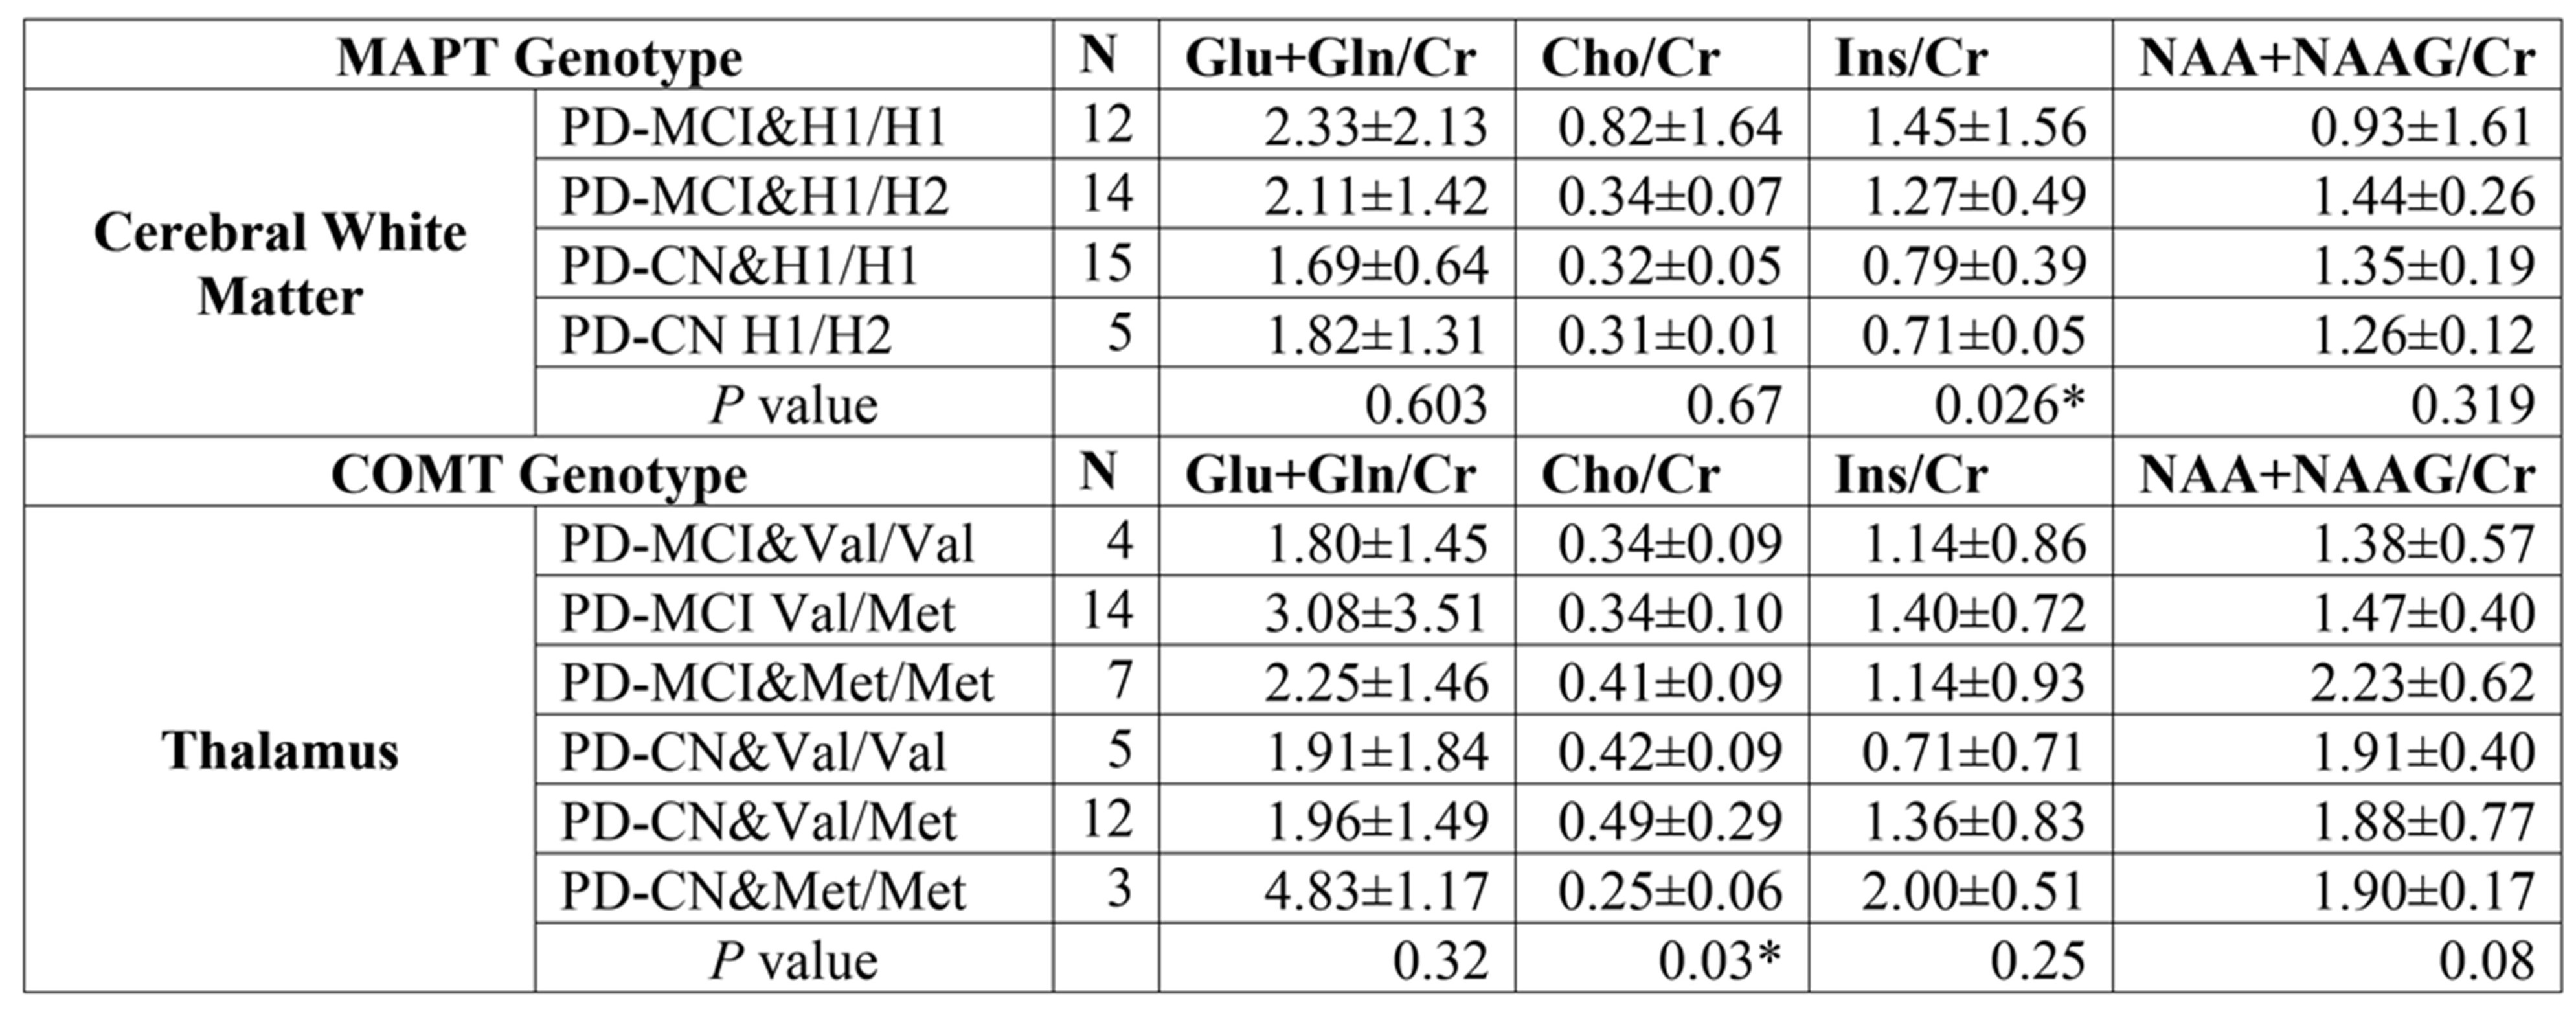
Statistically significant differences were obtained between different MAPT or COMT genotypes of PD-MCI and PD-CN in cerebral white matter and thalamus, but not in precuneus, posterior cingulate gyrus, cerebral gray matter, frontal lobe or occipital lobe. Table 1 shows the mean(±std) metabolite concentration ratios of different MAPT and COMT genotypes of PD-MCI and PD-CN along with the P-values of the Kruskal-Wallis test in cerebral white matter and thalamus. After Dunn’s post-hoc test, there was a statistically significantly higher Ins/Cr in cerebral white matter of PD-MCI with MAPT H1/H2 genotype than PD-CN with MAPT H1/H1 genotype (P=0.008). Additionally, PD-MCI with COMT Met/Met genotype (P=0.02), and PD-CN with COMT Val/Val (P=0.02) or Val/Met (P=0.008) genotype were observed to have a higher Cho/Cr in thalamus than PD-CN with COMT Met/Met genotype.DISCUSSION
Previous studies reported that PD-MCI patients had a higher Cho/Cr and Ins/Cr than PD-CN patients1. COMT Val158Met polymorphism has been associated with cognitive decline in PD, and Val/Val genotype has been reported to have more prefrontal activity than Met/Met genotype5. According to our results, PD-MCI with COMT Met/Met genotype had the highest Cho/Cr in thalamus within PD-MCI group, while the opposite pattern was true for the PD-CN group. This result indicates that the COMT genotype may have a complex interaction with other processes that lead to cognitive decline in PD. H1 haplotype of MAPT gene has been reported to be overrepresented in PD10. Highest Ins/Cr in cerebral white matter was observed in PD-MCI with MAPT H1/H1, which might be related with increased cognitive dysfunction in PD.CONCLUSION
This was the first preliminary study in the literature that investigated MR spectroscopic imaging differences between PD-MCI and PD-CN patients that had different MAPT and COMT genotypes. Our future work will include longitudinal assessment of cognitive decline in PD-MCI and MAPT and COMT genotypes will be included as co-variates.Acknowledgements
This study was supported by TUBITAK project #115S219, the Ministry of Development project #2010K120330 and Bogazici University BAP 10844SUP grants.References
1. Nie K, et al. Marked N-acetylaspartate and choline metabolite changes in Parkinson's disease patients with mild cognitive impairment. Parkinsonism Relat Disord. 2013;19(3):329-34.
2. Pagonabarraga J, et al. Spectroscopic changes associated with mild cognitive impairment and dementia in Parkinson's disease. Dement Geriatr Cogn Disord. 2012;34(5-6):312-8.
3. Camicioli R M, et al. Posterior cingulate metabolic changes occur in Parkinson's disease patients without dementia. Neurosci Lett. 2004;354(3):177-80.
4. Griffith H R, et al. Proton magnetic resonance spectroscopy in dementias and mild cognitive impairment. Int Rev Neurobiol. 2009;84:105-31.
5. Williams-Gray C H, et al. Catechol O-methyltransferase Val158Met genotype influences frontoparietal activity during planning in patients with Parkinson's disease. J Neurosci. 2007;27(18):4832-8.
6. Fallon S J, et al. Prefrontal dopamine levels determine the balance between cognitive stability and flexibility. Cereb Cortex. 2013;23(2):361-9.
7. Provencher S W, Automatic quantitation of localized in vivo 1H spectra with LCModel. NMR Biomed. 2001;4(4):260-4.
8. Cengiz S, et al. Proton MR spectroscopic imaging of Parkinson’s disease with mild cognitive impairment or normal cognition registered to MNI152 brain atlas, in In Proceedings of the 33rd Annual Meeting of European society for magnetic resonance in medicine and biology (ESMRMB)2016: Vienna, Austria.
9. Mazziotta J, et al. A four-dimensional probabilistic atlas of the human brain. J Am Med Inform Assoc. 2001;8(5):401-30.
10. Winder-Rhodes S E, et al. Association between MAPT
haplotype and memory function in patients with Parkinson's disease and healthy
aging individuals. Neurobiol Aging. 2015;36(3):1519-28.
Figures