2491
Altered Functional Connectivity Density in Subtypes of Parkinson’s Disease: a Resting-State fMRI Study1Department of Radiology, Southwest Hospital, Third Military Medical University, Chongqing, 400038, P.R. China, Chongqing, People's Republic of China, 2Key Laboratory for Neuro Information of Ministry of Education, School of Life Science and Technology, University of Electronic Science and Technology of China (UESTC), Chengdu, 610054, P.R. China, People's Republic of China, 3Collaboration NEA, Siemens Healthcare Ltd., Shanghai, P.R. China, People's Republic of China
Synopsis
In the current study, combined functional connectivity density (FCD) and seed-based FC analyses were performed to fully characterize the abnormal brain networks in the two subtypes. Our findings obtained using a combination of FCD and seed-based FC analyses provide consistent evidence for that the network disorganization of the brains in the two PD subtypes were different.We also found that the FCD provided good discrimination between the AR and TD patients. These findings have important implications for understanding the neural substrates that underlie these disparate manifestations of PD.
Background
Parkinson’s disease (PD) can be classified into tremor-dominant (TD) and akinetic-rigid (AR) subtypes, each of which exhibits a unique clinical course and prognosis1,2. However, the neural basis for these disparate manifestations is not well understood. This study comprehensively investigated the altered functional integration of these two subtypes.Methods
25 TD patients, 25 AR patients and 26 normal control subjects were studied. Motor performance of patients was quantitatively and accurately assessed in detail by using the motor section (part III) of the Unified Parkinson’s Disease Rating Scale (UPDRS) and Hoehn and Yahr scale. Afterwards, the mean scores of TD and AR were computed, respectively 3,4. Resting-state functional images were acquired using a 3T MAGNETOM Trio (Siemens). Imaging data were collected transversely by using an echo-planar imaging (EPI) sequence with the following settings: TR = 2000 ms, TE = 30 ms, flip angle = 90°, FOV = 192×192mm2, in-plane matrix = 64×64, thickness=3 mm, voxel size = 3.0 × 3.0 × 3.0mm3. For each subject, a total of 240 volumes were acquired with scan time of 480s. Data preprocessing was carried out using Neuroscience Information Toolbox (NIT, http://www.neuro.uestc.edu.cn/NIT.html). Functional MRI (fMRI) data were analyzed using functional connectivity density (FCD) and seed-based functional connectivity methods. For each subject, both the global FCD map and the local FCD map were computed5,6. The brain sites identified by FCD group comparisons between the two subtypes were used as seeds in subsequent functional connectivity analyses. To determine the effect of group, a voxel-based one-way analysis of covariance (ANCOVA) was used with age, gender, and education level as covariates in both the FCD and FC analyses using REST software. The mean FCD and FC values were extracted for post hoc analyses using the least significant difference (LSD) t-test. The AFNI AlphaSim program (http://afni.nih.gov/afni/docpdf/AlphaSim.pdf) was used to correct for multiple comparisons7. Correlations between neuroimaging measures and clinical variables were also calculated to investigate the relationships between each of the clinical variables and the altered functional brain properties, and receiver operating characteristic (ROC) analysis was used to evaluate the ability of the FCD measures to discriminate the PD subtypes.Results
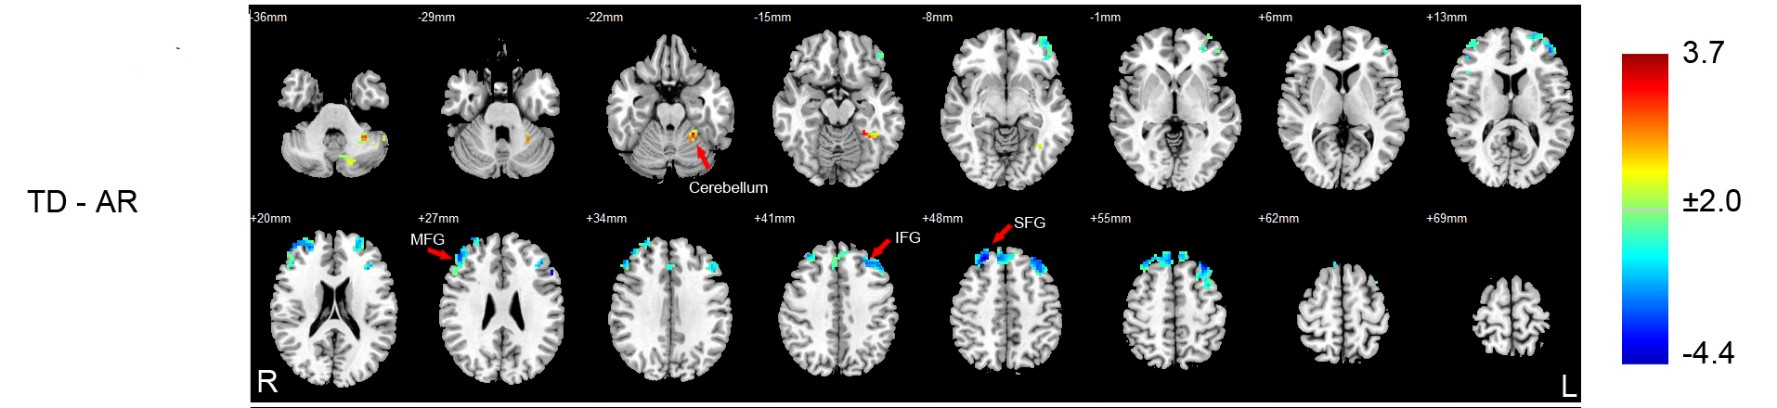
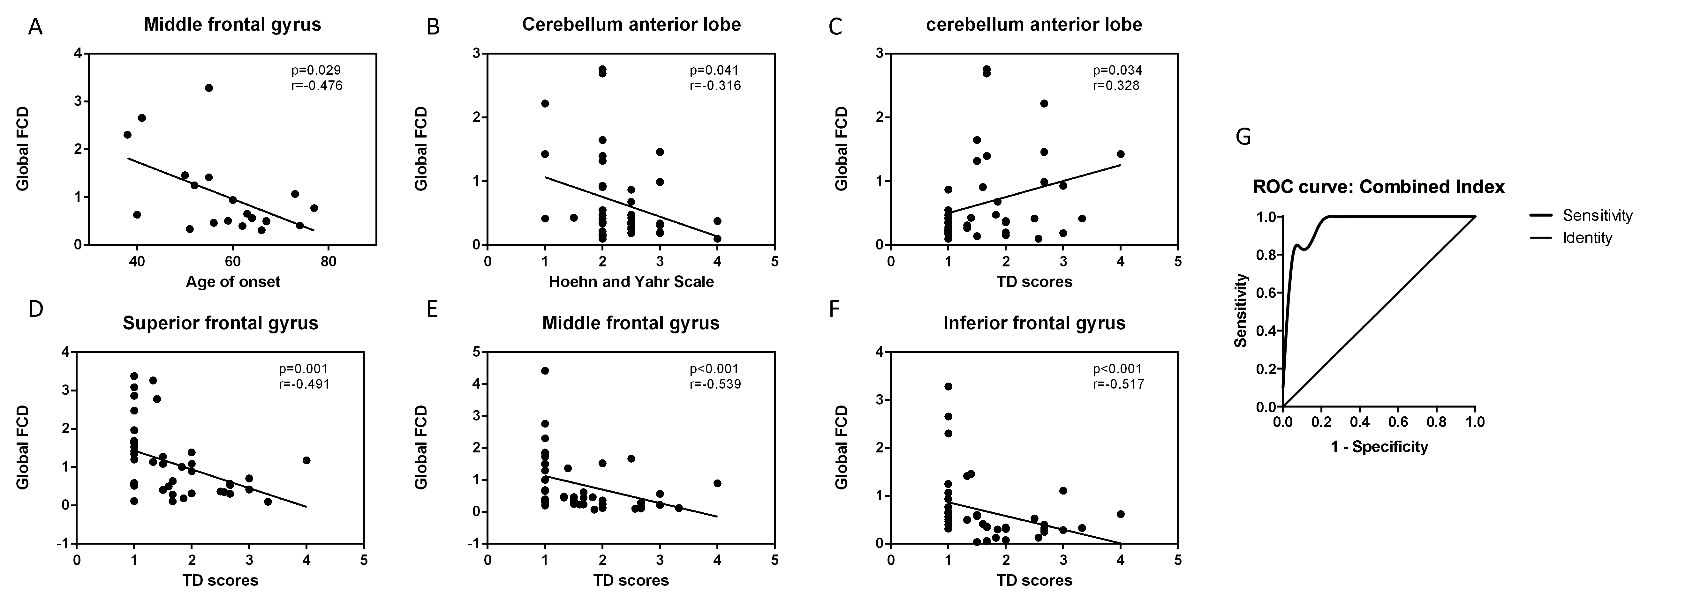
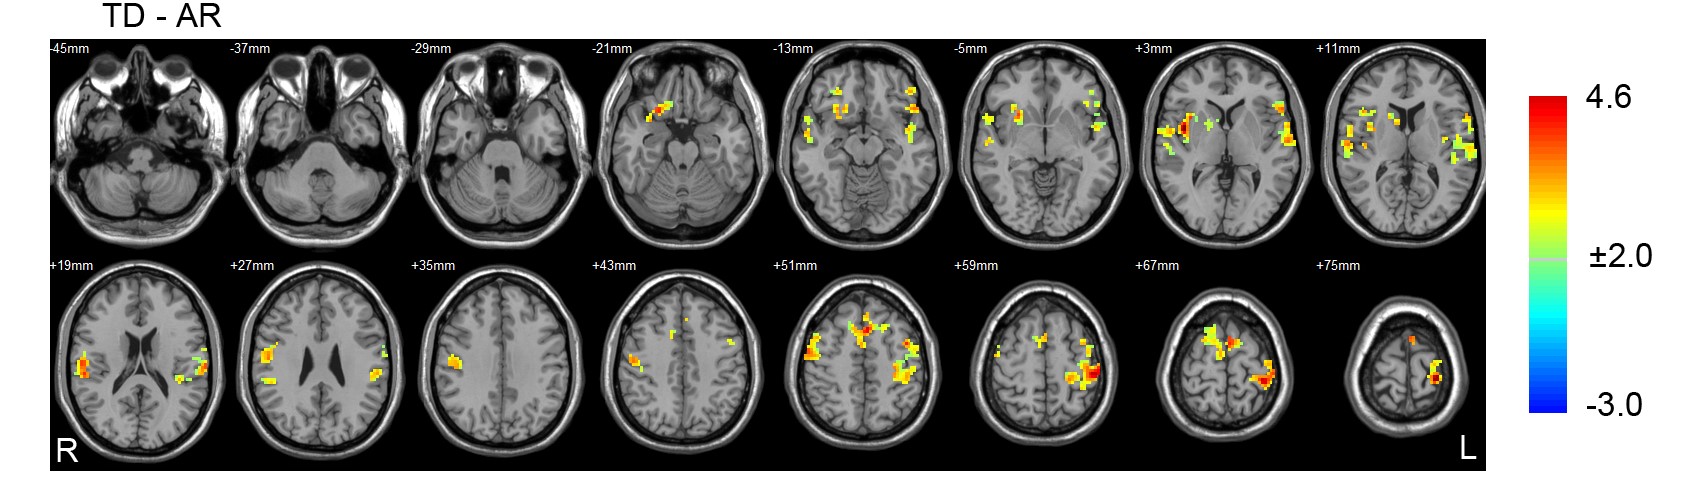
Compared with the AR patients, significantly increased global functional connectivity density in the cerebellum and decreased global functional connectivity density in the left inferior frontal gyrus, right middle frontal gyrus and right superior frontal gyrus were found in the TD patients (P <0.05, AlphaSim corrected) (Figure 1). Moreover, the identified functional connectivity density correlated significantly with clinical variables in the patients (spearman rank correlation analyses, P < 0.05), and the results of the ROC analysis indicated that the inclusion of the four FCD indices had the highest power to discriminate the AR patients from the TD patients, with an AUC of 0.96 (95% CI=0.91–1.00) (Figure 2). At a cutoff of 0.23, the sensitivity and specificity were 95.2% and 80.9%, respectively. Furthermore, patients of the different subtypes demonstrated different cerebello-cortical functional connectivity patterns (P <0.05, AlphaSim corrected) (Figure 3).Conclusions
These findings indicate that the functional integration in the cerebellum and frontal lobe are altered in both subtypes of PD. They also provide a new perspective for the classification of PD subtypes based on a comprehensive view of network disorganization in the two subtypes of PD.Acknowledgements
No acknowledgement found.References
1.Lees AJ, Hardy J, Revesz T. Parkinson's disease. The Lancet;373(9680):2055-2066.
2.Zaidel A, Arkadir D, Israel Z, Bergman H. Akineto-rigid vs. tremor syndromes in Parkinsonism. Current opinion in neurology 2009;22(4):387-393.
3.Lewis MM, Du G, Sen S, et al. Differential involvement of striato- and cerebello-thalamo-cortical pathways in tremor- and akinetic/rigid-predominant Parkinson's disease. Neuroscience 2011;177:230-239.
4.Eggers C, Kahraman D, Fink GR, Schmidt M, Timmermann L. Akinetic-rigid and tremor-dominant Parkinson's disease patients show different patterns of FP-CIT single photon emission computed tomography. Movement disorders 2011;26(3):416-423.
5.Tomasi D, Volkow ND. Functional connectivity density mapping. Proceedings of the National Academy of Sciences of the United States of America 2010;107(21):9885-9890.
6.Tomasi D, Volkow ND. Functional connectivity hubs in the human brain. NeuroImage 2011;57(3):908-917.
7.Ledberg A, Akerman S, Roland PE. Estimation of the probabilities of 3D clusters in functional brain images. Neuroimage 1998;8(2):113-128.
Figures