2489
Which one is a better marker for the diagnosis of Parkinson’s disease: T1 MRI or DTI1Department of Radiology and Biomedical Research Imaging Center (BRIC), University of North Carolina at Chapel Hill, Chapel Hill, NC, United States
Synopsis
Parkinson's disease (PD) is a common neurodegenerative disorder, which progresses slowly and affects the quality of life dramatically. In this paper, we use the T1 MRI and DTI data from the PPMI study to analyze the effect of each modality through investigating the brain regions, and determine which modality can be a better marker at diagnosing the disease. For this purpose, we propose a joint feature selection and max-margin classification framework, in which we select features that best benefit the classification scheme. Our results show that the brain structural connectivity studies using DTI leads to better results.
Purpose
Parkinson's disease (PD) is the most common subcortical
degenerative disease and the second most common neurodegenerative disease after
Alzheimer’s disease. PD is often characterized by motor and non-motor symptoms.
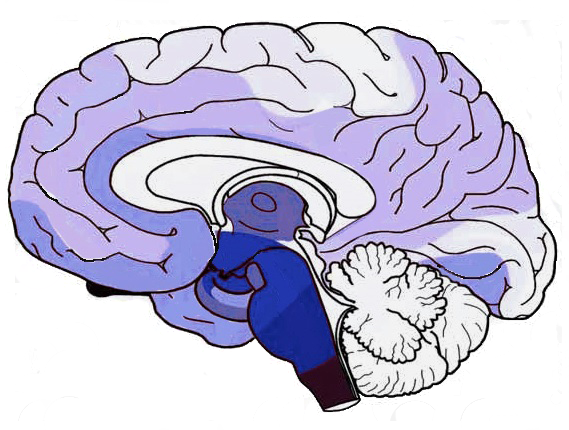
An illustration of PD progression is shown in Fig.1, derived from the results
achieved by [1]. SPECT imaging is usually considered for the diagnosis of PD
[2], since it registers the dopamine levels in the striatum. However, acquiring
SPECT images is costly. Therefore, finding ways to diagnose the disease at
earlier times, during regular screenings, would be of great interest. This
motivates us to investigate T1-weighted MRI and diffusion tensor imaging
(DTI), and see which one can be a reliable imaging marker for PD
diagnosis.Methods
The data used in this paper are acquired from the PPMI database [3]. In this research, we use 114 subjects with both T1 MRI and DTI modalities, including 62 PD and 62 Normal Control (NC) subjects. These PD subjects are de novo PD patients, newly diagnosed and unmedicated.
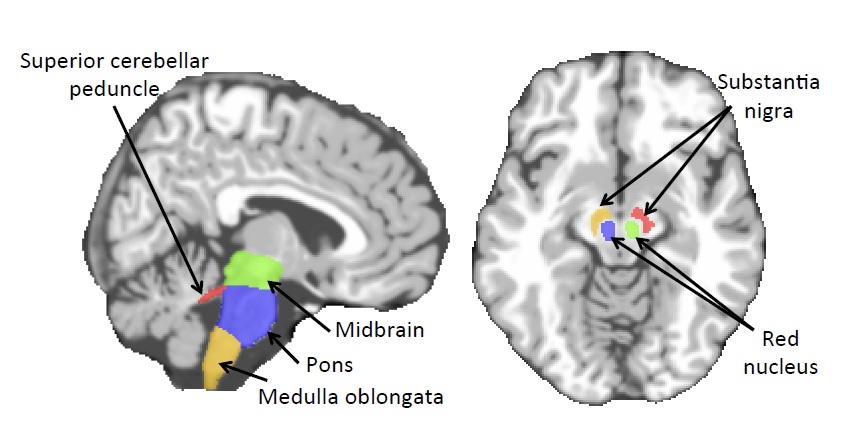
For each subject, MR images were preprocessed and segmented into White Matter (WM), Gray Matter (GM), and CerebroSpinal Fluid (CSF) tissues. Next, the Anatomical Automatic Labeling (AAL) [4] atlas with was registered using HAMMER [5] to each subject's native space. We further added 8 clinically important regions for PD (motivated by Fig. 1) to the atlas, shown in Fig. 2. We computed WM, GM and CSF tissue volumes in all ROIs as T1 MRI features.
For DTI data, fiber tracking and structural network construction of the Fractional Anisotropy (FA) was done similar to [7]. The AAL atlas [4] (same as above) was nonlinearly registered to each subject’s segmented T1 image. Then, the T1 image was rigidly aligned to the FA image. The ROIs were transferred to each individual’s DWI space, forming the nodes in the connectivity network for each subject. Two ROIs were considered anatomically connected, if there were no less than four fibers traversing them [7, 8]. The number of fibers was considered as the weight of the edge connecting those ROIs. These weights are vectorized and used as DTI features.
We train models for each modality separately to analyze/compare the effects of each independently. We define the labels, $$$\mathbf{y}$$$, and the features matrix as $$$\mathbf{X} \in \mathbb{R}^{d \times N}$$$ ($$$d$$$ and $$$N$$$ are the number of features and samples, respectively). Note that since the features are extracted from the whole brain, not all of them contribute to the disease and its progression. Hence, we need to select the important features in the process of building the model. Therefore, we adopt a formulation similar to kernel-based SVM, with a customized kernel for feature selection. We propose to apply the kernel function on each single feature and define the aggregate-kernel through a simple weighted sum of all these kernels: $$k(\mathbf{x}_j,\mathbf{x})= \sum_{i=1}^d \alpha_i k(x_{j}^i, x^{i}),$$ with $$$\boldsymbol\alpha$$$ defined as the weight vector for the features. This is similar to the multiple kernel learning framework [9], but with a single kernel on each single feature. In this way, we can select the features through $$$\ell_1$$$ regularization on the kernels' weight vector: $$\min_{\mathbf{w},b,\boldsymbol{\alpha}} \frac{1}{2}\|\mathbf{w}\|_2^2+C\sum_{j=1}^N{\max(0,1-y_jf(\mathbf{x}_j))} + \lambda\|\boldsymbol{\alpha}\|_1, \quad s.t. \quad \boldsymbol{\alpha} \ge 0,$$ where $$$\mathbf{w} \in \mathbb{R}^d$$$ is the classifier weight vector.
Optimizing the above formulation would select features, while classifying the data. The optimization process would alternate between two subproblems until convergence: (1) Use any SVM solver to learn the SVM parameters, (2) learn the kernel and the weight $$$\boldsymbol{\alpha}$$$.
Results
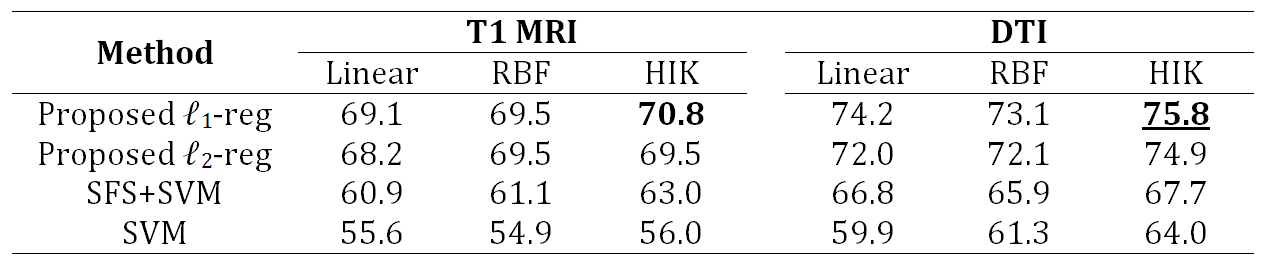
For evaluations, we compare our results with SVM, sparse feature selection with SVM (SFS+SVM), and the same objective with conventional $$$\ell_2$$$ regularization on the vector $$$\boldsymbol{\alpha}$$$. The hyper-parameters are grid-searched through inner-cross-validation for all methods. Table 1 compares the diagnosis accuracies of the proposed and baseline methods.Discussion
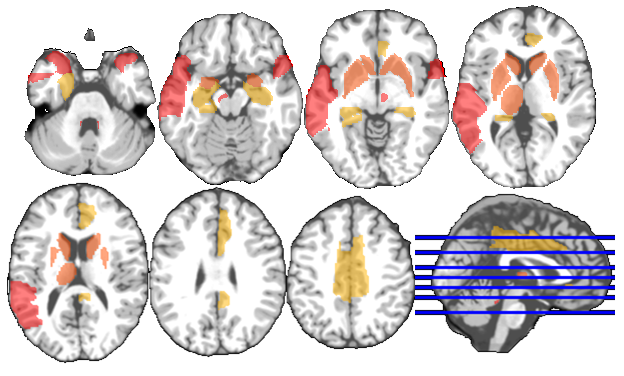
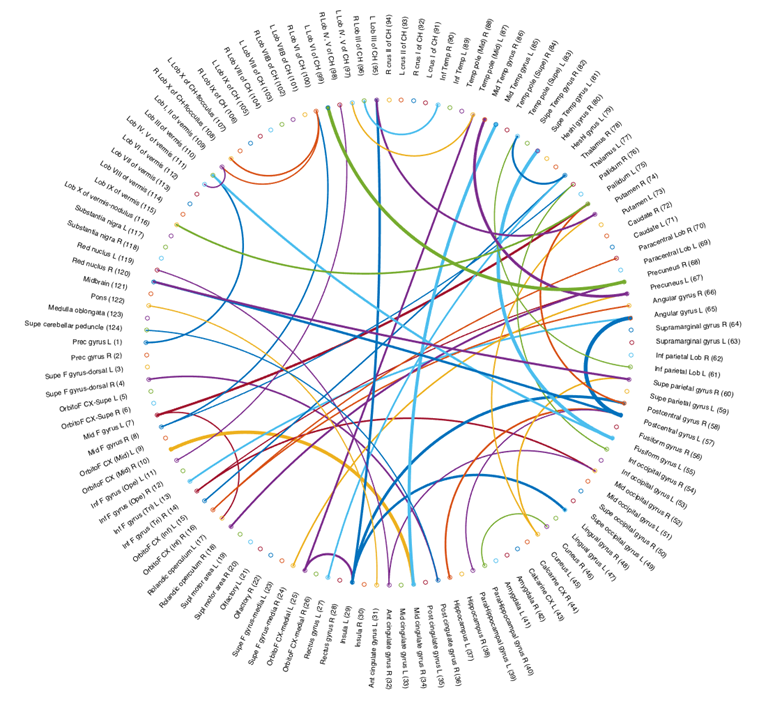
DTI data and the structural brain network can characterize the disease better than using the T1 MRI volumetric features. To get more insight about the results, we visualize the ROIs and the FA connections, more frequently selected by our proposed method, in Figures 3 and 4 respectively (more details in Figure captions).Conclusion
In this research, we introduced a kernel-based feature selection and classification scheme, and applied it for PD diagnosis using T1 MRI and DTI modalities. DTI shows to be slightly better than T1 MRI for PD diagnosis, however, future studies have yet to be conducted with different types of features to analyze them in more details. Furthermore, the results indicate that the proposed framework for joint feature selection and classification induces the best performance compared to the baselines.Acknowledgements
No acknowledgement found.References
[1] H. Braak, K. Tredici, U. Rub, R. de Vos, E. J. Steur, E. Braak, Staging of brain pathology related to sporadic Parkinson’s disease, Neurobiology of Aging 24 (2) (2003) 197 – 211.
[2] Kim, Yun J., et al. "Combination of dopamine transporter and D2 receptor SPECT in the diagnostic evaluation of PD, MSA, and PSP." Movement disorders 17.2 (2002) 303-312.
[3] K. Marek, et al., The parkinson progression marker initiative (PPMI), Progress in Neurobiology 95 (4) (2011) 629 – 635.
[4] N. Tzourio-Mazoyer, B. Landeau, D. Papathanassiou, F. Crivello, O. Etard, N. Delcroix, B. Mazoyer, M. Joliot, Automated anatomical labeling of activations in SPM using a macroscopic anatomical parcellation of the MNI MRI single subject brain, NeuroImage 15 (1) (2002) 273 – 289.
[5] D. Shen, C. Davatzikos, HAMMER: Hierarchical attribute matching mechanism for elastic registration, IEEE Transactions on Medical Imaging 21 (2002) 1421–1439.
[6] A. Leemans, B. Jeurissen, J. Sijbers, and D. Jones, “Explore DTI: a graphical toolbox for processing, analyzing, and visualizing diffusion MR data,” in Proceedings of the Annual Meeting of International Society for Magnetic Resonance in Medicine (ISMRM ’09), p. 3537, (2009).
[7] Wang, Tao, et al. "Multilevel deficiency of white matter connectivity networks in Alzheimer’s disease: a diffusion MRI study with DTI and HARDI models." Neural plasticity 2016 (2016).
[8] A. Zalesky, A. Fornito, M. L. Seal et al., “Disrupted axonal fiber connectivity in schizophrenia,” Biological Psychiatry, vol. 69,no. 1, pp. 80–89, (2011).
[9] M. Varma, B. R. Babu, “More generality in efficient multiple kernel learning”, In International Conference on Machine Learning, 1065–1072 (2009).
Figures