2488
Functional network remapping of the subthalamic nucleus in Parkinson's disease1HMCS, NINDS, NIH, Bethesda, MD, United States, 2School of Biomedical Engineering, Fourth Military Medical University, Xi’an, Shaanxi, People's Republic of China, 3Neurology Department, Yale School of Medicine, New Haven, CT, United States
Synopsis
We modified a parcellation method to map the motor, limbic and associative territories within the subthalamic nucleus (STN). We further evaluated whether a remapping of the STN connectivity exists in Parkinson’s disease (PD) patients. Resting-state fMRI data were analyzed using independent component analysis and general linear model. In both groups, the motor area was identified in the posterior zone, while the limbic zone was more anteriorly located. The motor connections were altered in the PD patients. Our approach could be used for functional parcellations and for remapping of functional connectivity due to disease in brain areas with heterogeneous connectivity patterns.
PURPOSE
To map the motor, limbic and associative territories within the subthalamic nucleus (STN) using fMRI data, and to evaluate whether a remapping of the STN connectivity exists in Parkinson’s disease (PD) patients.BACKGROUND
STN is an input nucleus of the basal ganglia and its stimulation improves motor symptoms in PD.1 Stimulation of different parts of the STN differentially modulates the motor, limbic and associative networks supporting the tripartite model of STN.2-4 However, there are still controversies on whether the tripartite subdivision is a valid model.5,6 Functional imaging studies have not attempted to test this model. Here, we modified a method previously used for thalamic parcellation7 to study the functional subdivisions of the STN, and to explore whether there is a remapping in the motor network, as previously seen in other basal ganglia circuits in PD8.METHODS
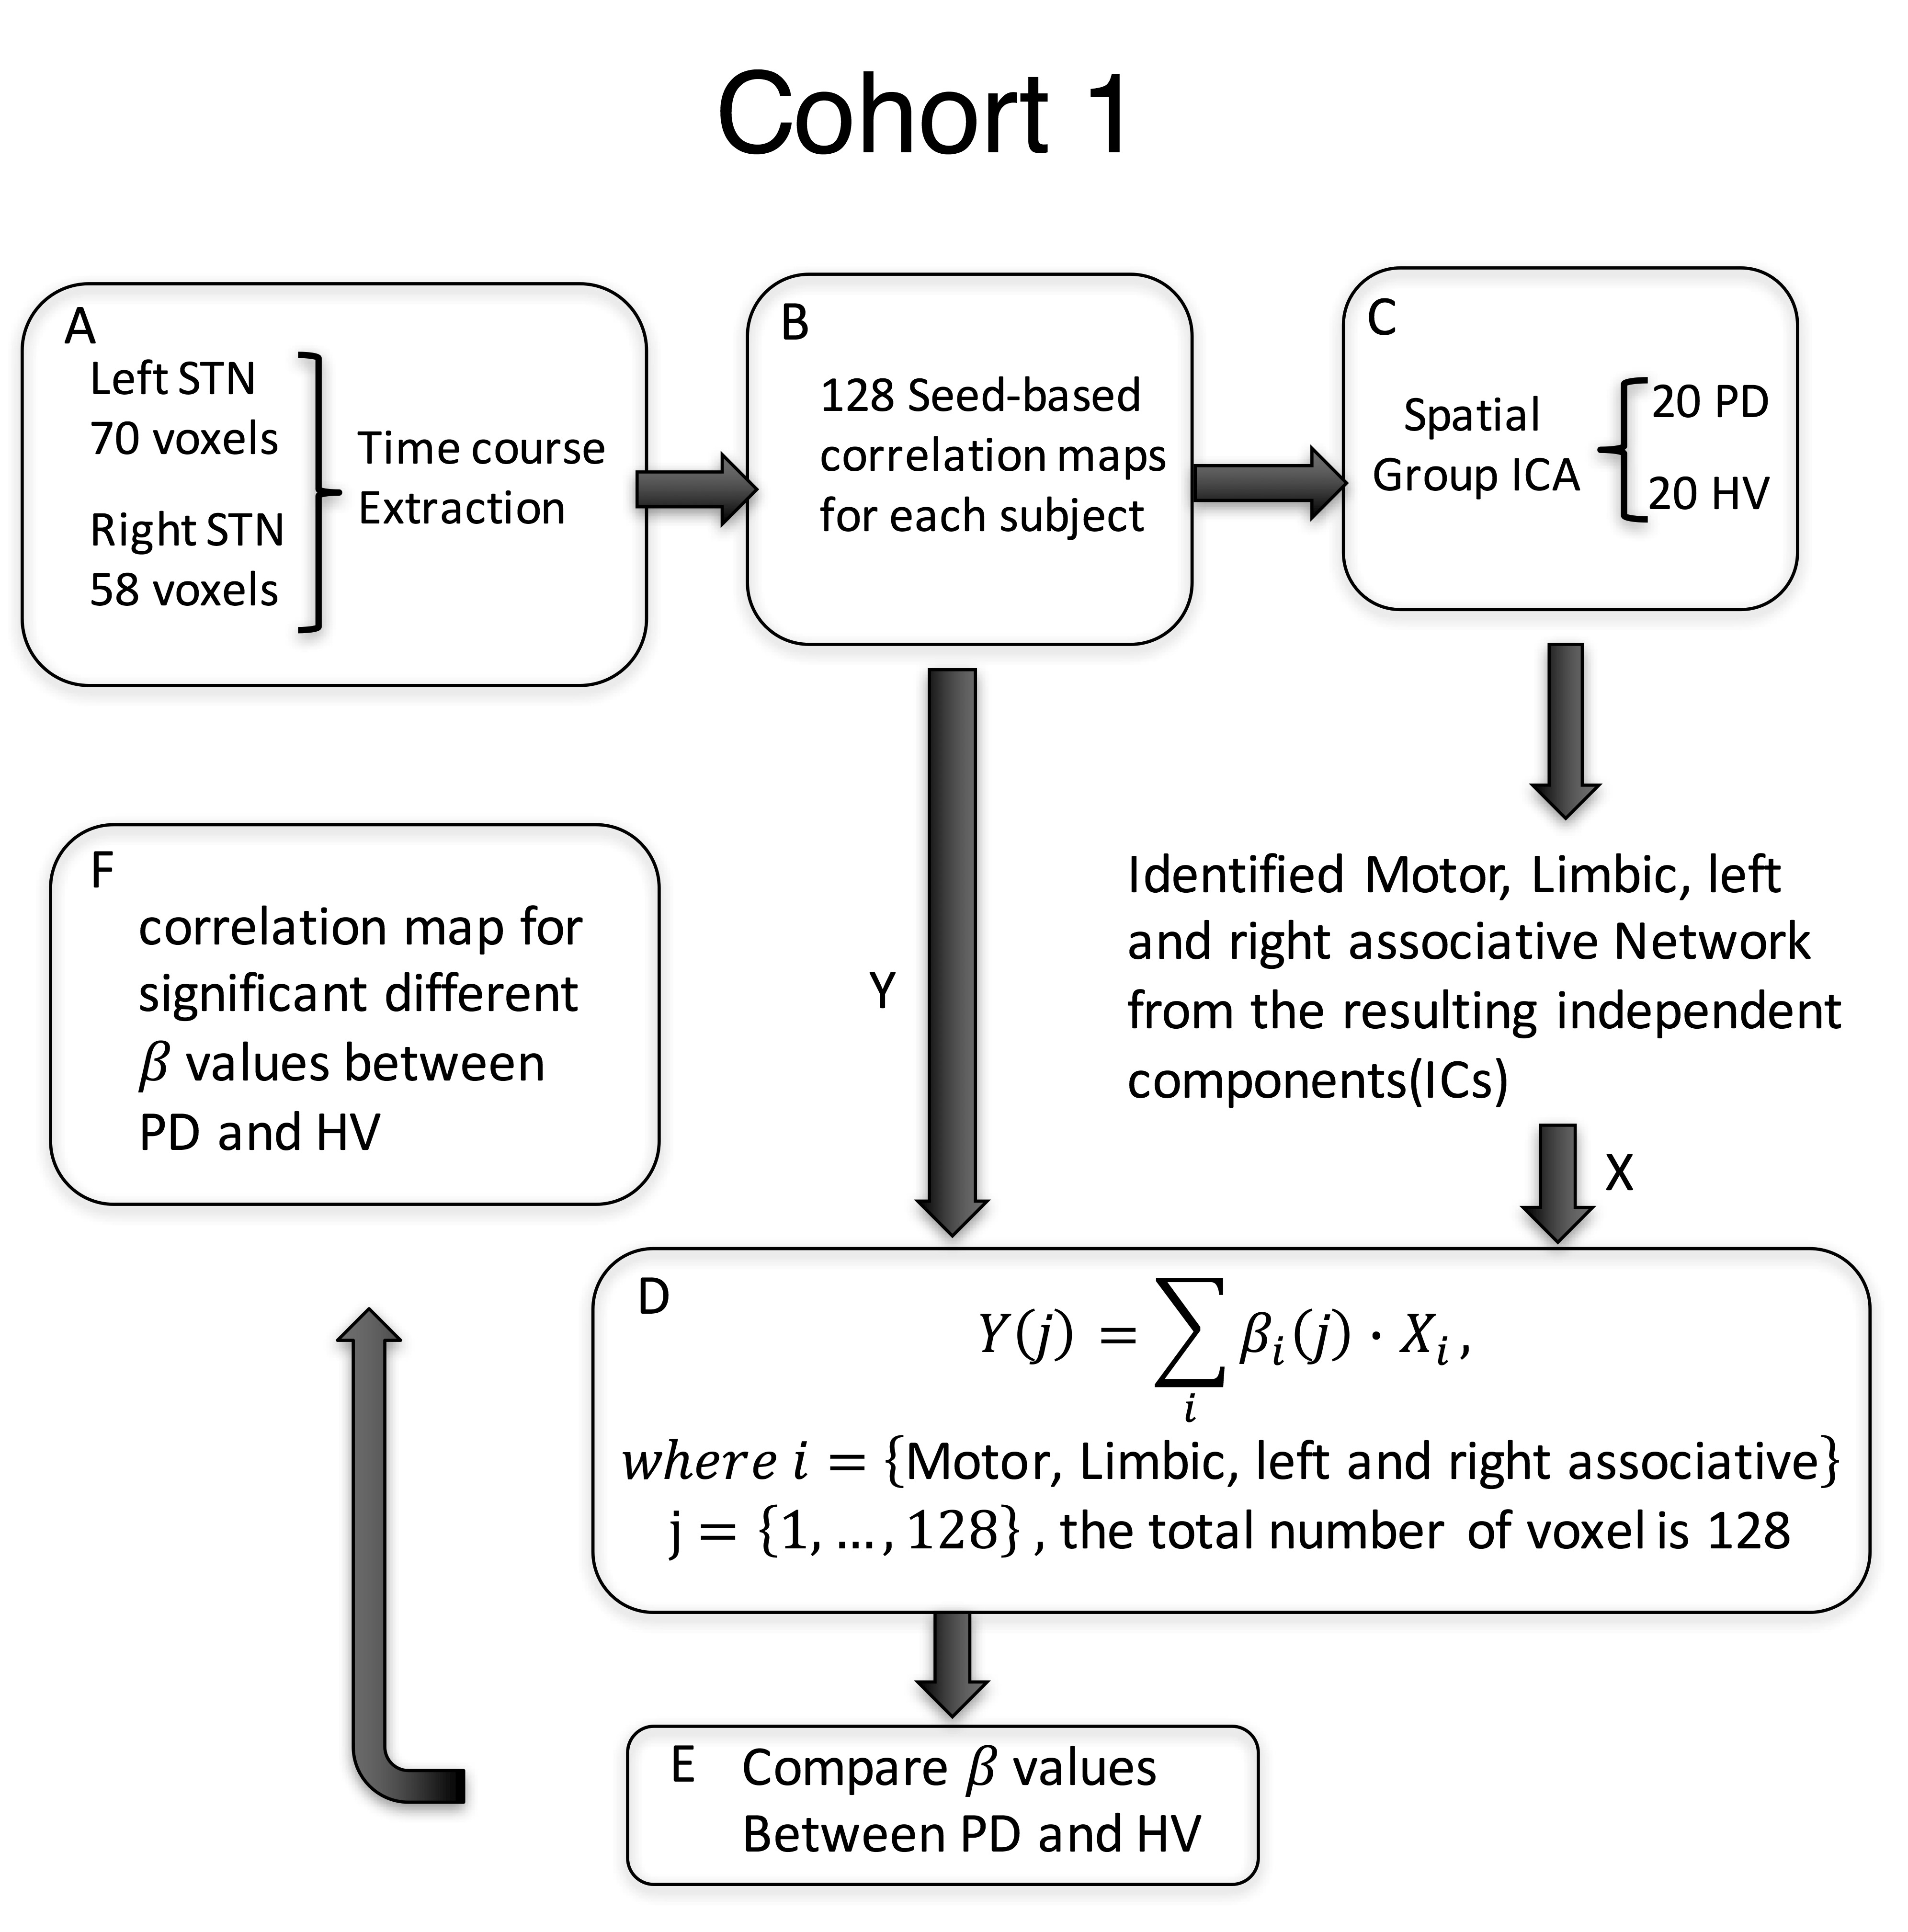
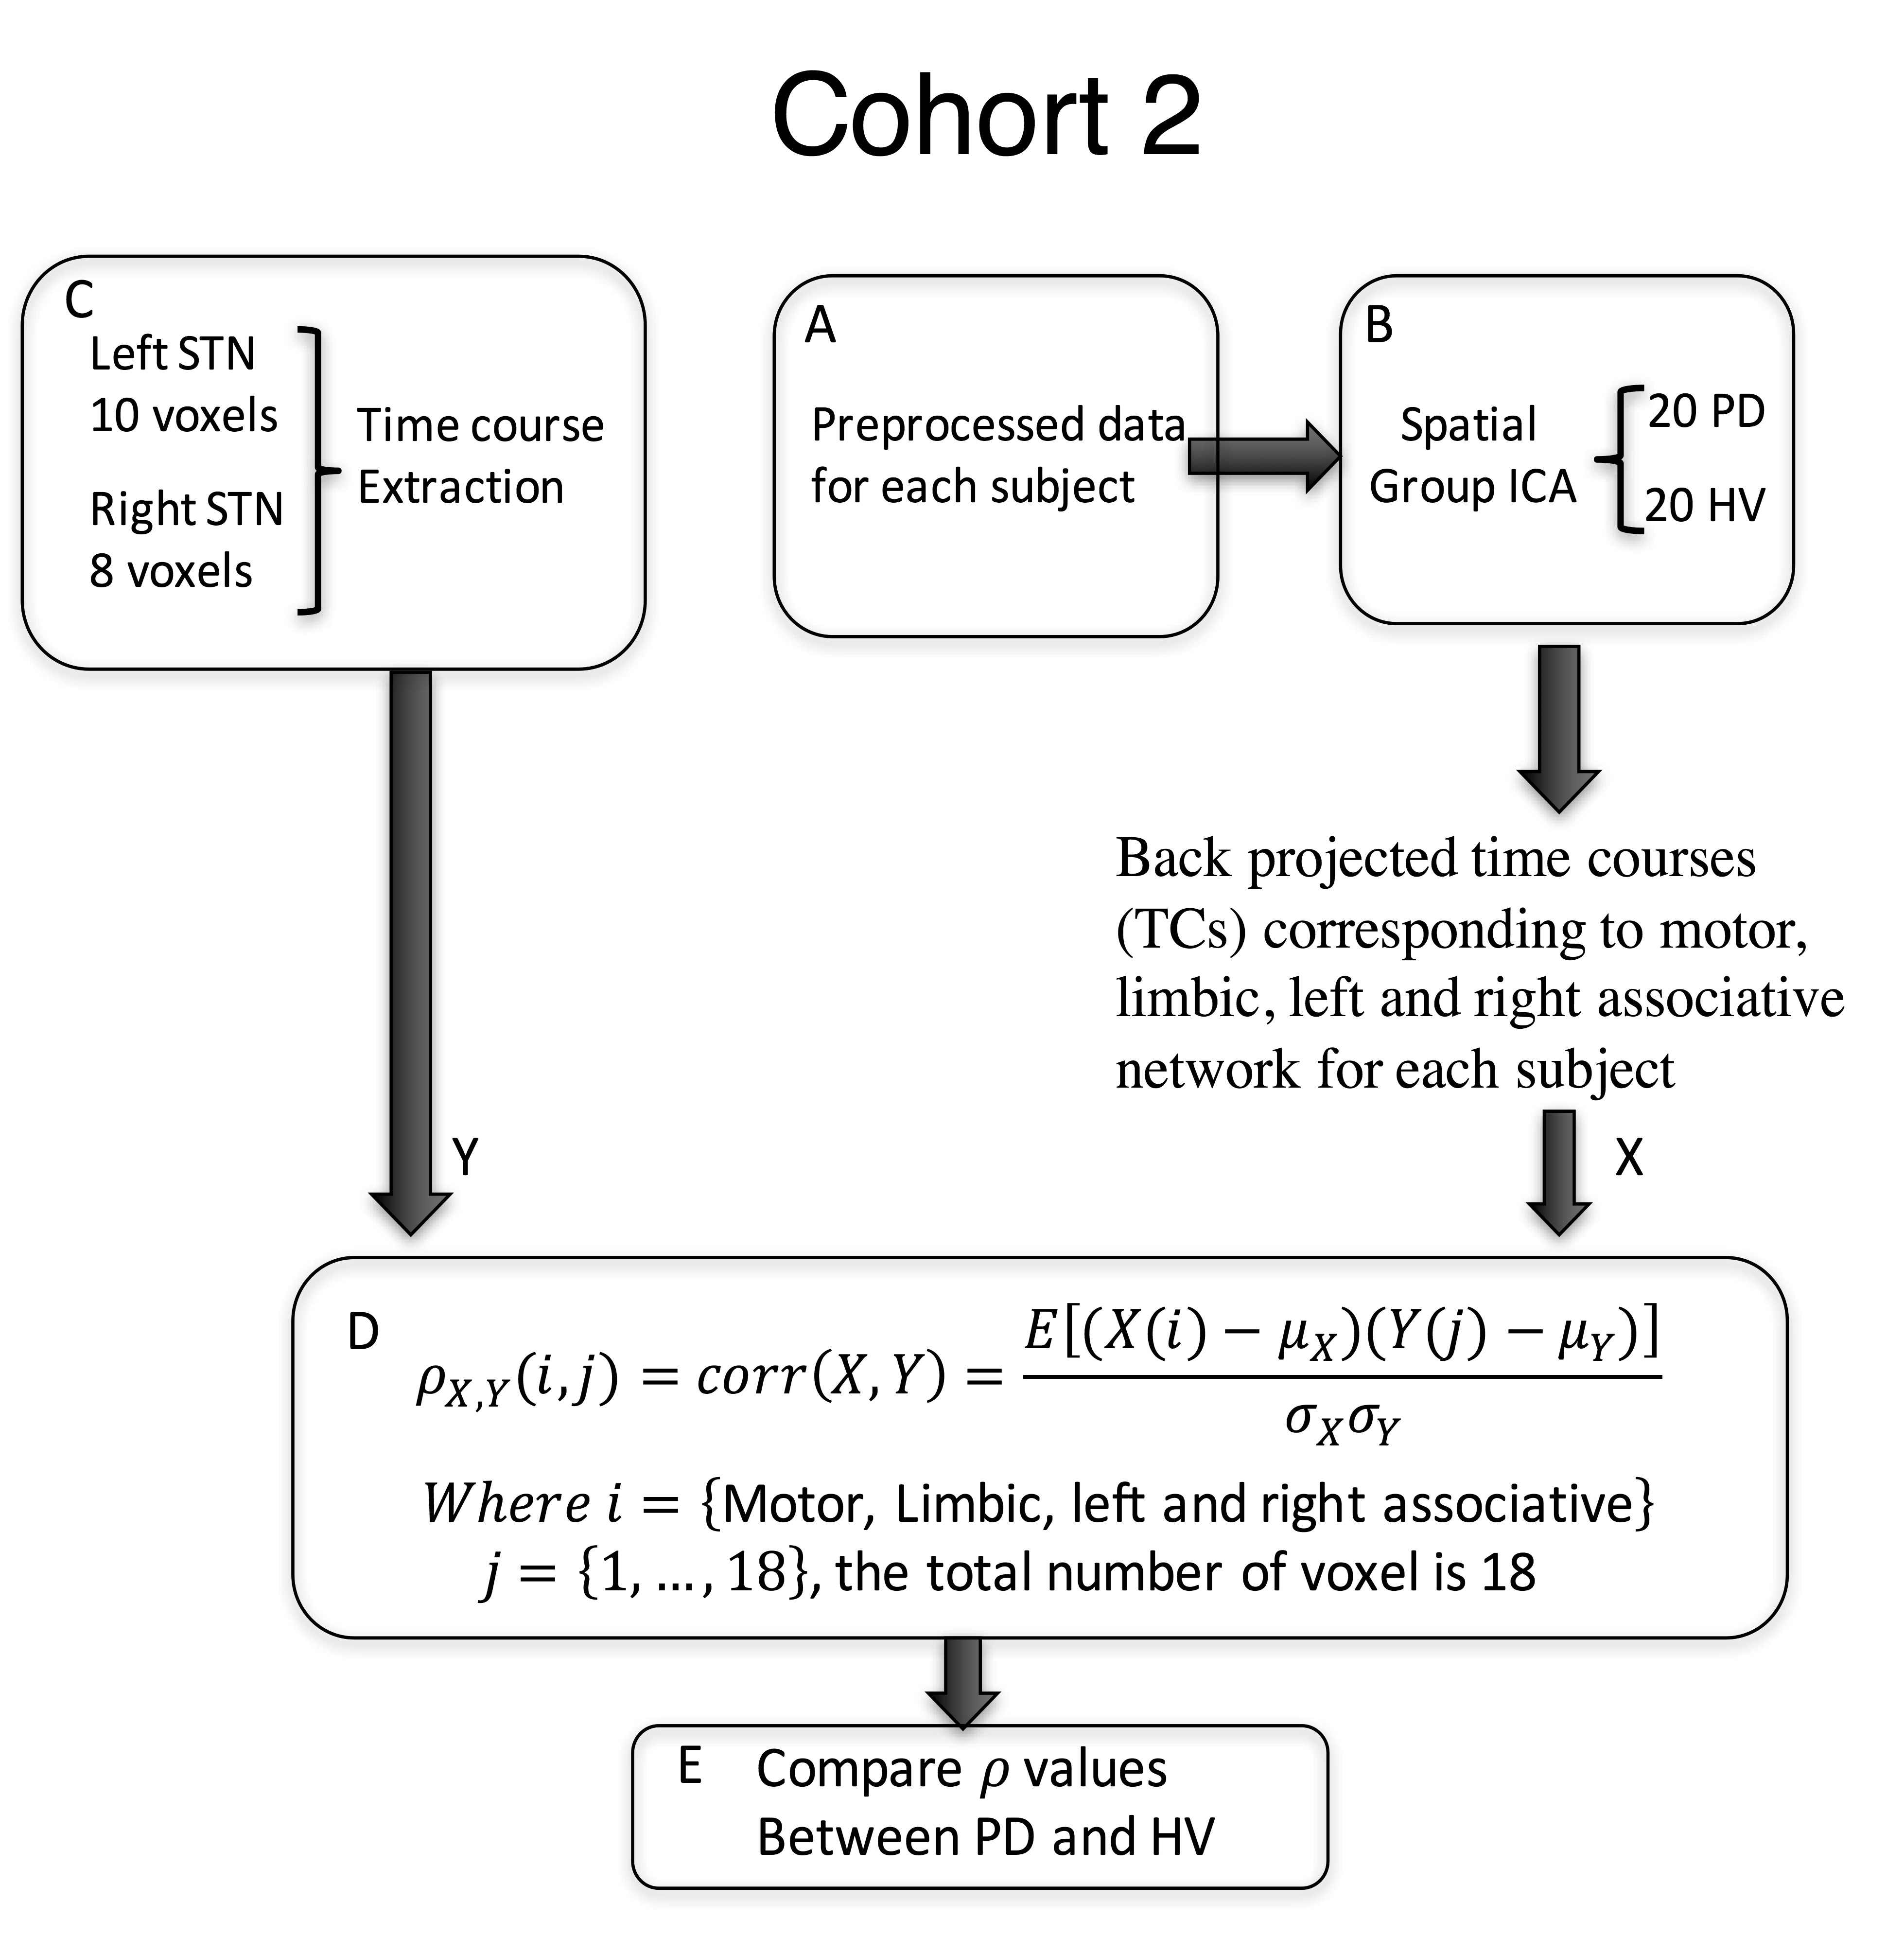
Sixty-eight subjects were included in this study. The primary analysis was performed in Cohort 1, composed of 20 PD patients on medication (age:62.5 ± 6.9, 11 females, Hoenn&Yahr: 2.0 ± 0.5), and 20 healthy volunteers (HV) (age:61.9 ± 6.6, 11 females). Cohort 2 (14PD/14HV) was used for verification. T1-weighted and 5-min resting state fMRI scans with eyes closed were collected from all subjects at 3T scanners (GE, Milwaukee, USA) (TR: 2 s, TE: 30 ms, flip angle: 70, FoV: 240, cohort 1: slice thickness: 3 mm, 2.50 × 2.50 mm in-plane resolution up-sampled to 1.75x1.75mm; in an MR750 scanner; cohort 2: 3.5x3.5x3.5mm resolution in a Signa HDx scanner). Pre-processing was performed in AFNI9 and included despiking, slice time correction, registration, motion correction, transformation to MNI space, ANATICOR, smoothing to 6mm FWHM and bandpass filtering (0.01-0.1Hz). For cohort 1, the time course for each voxel in the STN, defined from the template, was extracted. First, the inhomogeneity of the STN timecourses was verified by computing their correlation coefficients. Then, each STN voxel timecourse was correlated with every voxel in the brain. Correlation maps were Z-transformed and concatenated across voxels for each subject before performing group spatial independent component analysis (ICA) using GIFT10. The motor, limbic and right and left associative networks were manually selected from the 20 resulting components and projected back to each individual subject’s map. Each STN voxel was then assigned a beta coefficient for each of the networks based on a general linear model (GLM) (Figure 1). Using an ANOVA model, we tested for group-by-network interactions of the beta values in 128 voxels defined in bilateral STN. Significance was set to p≤0.05, and a cluster of 4 voxels. Finally, for the most significantly different voxel in the motor STN and primary motor cortex (M1), we used Granger Causality (GC) implemented in R within AFNI, to test the directionality of the connection. We used a separate dataset (Cohort 2) to test the consistency of the STN parcellation. As the resolution of this dataset was lower (3.5mm isotropic), we used a simplified approach where the time course of each voxel within the STN was correlated with ICA timecourse of the specific network (Figure 2).RESULTS
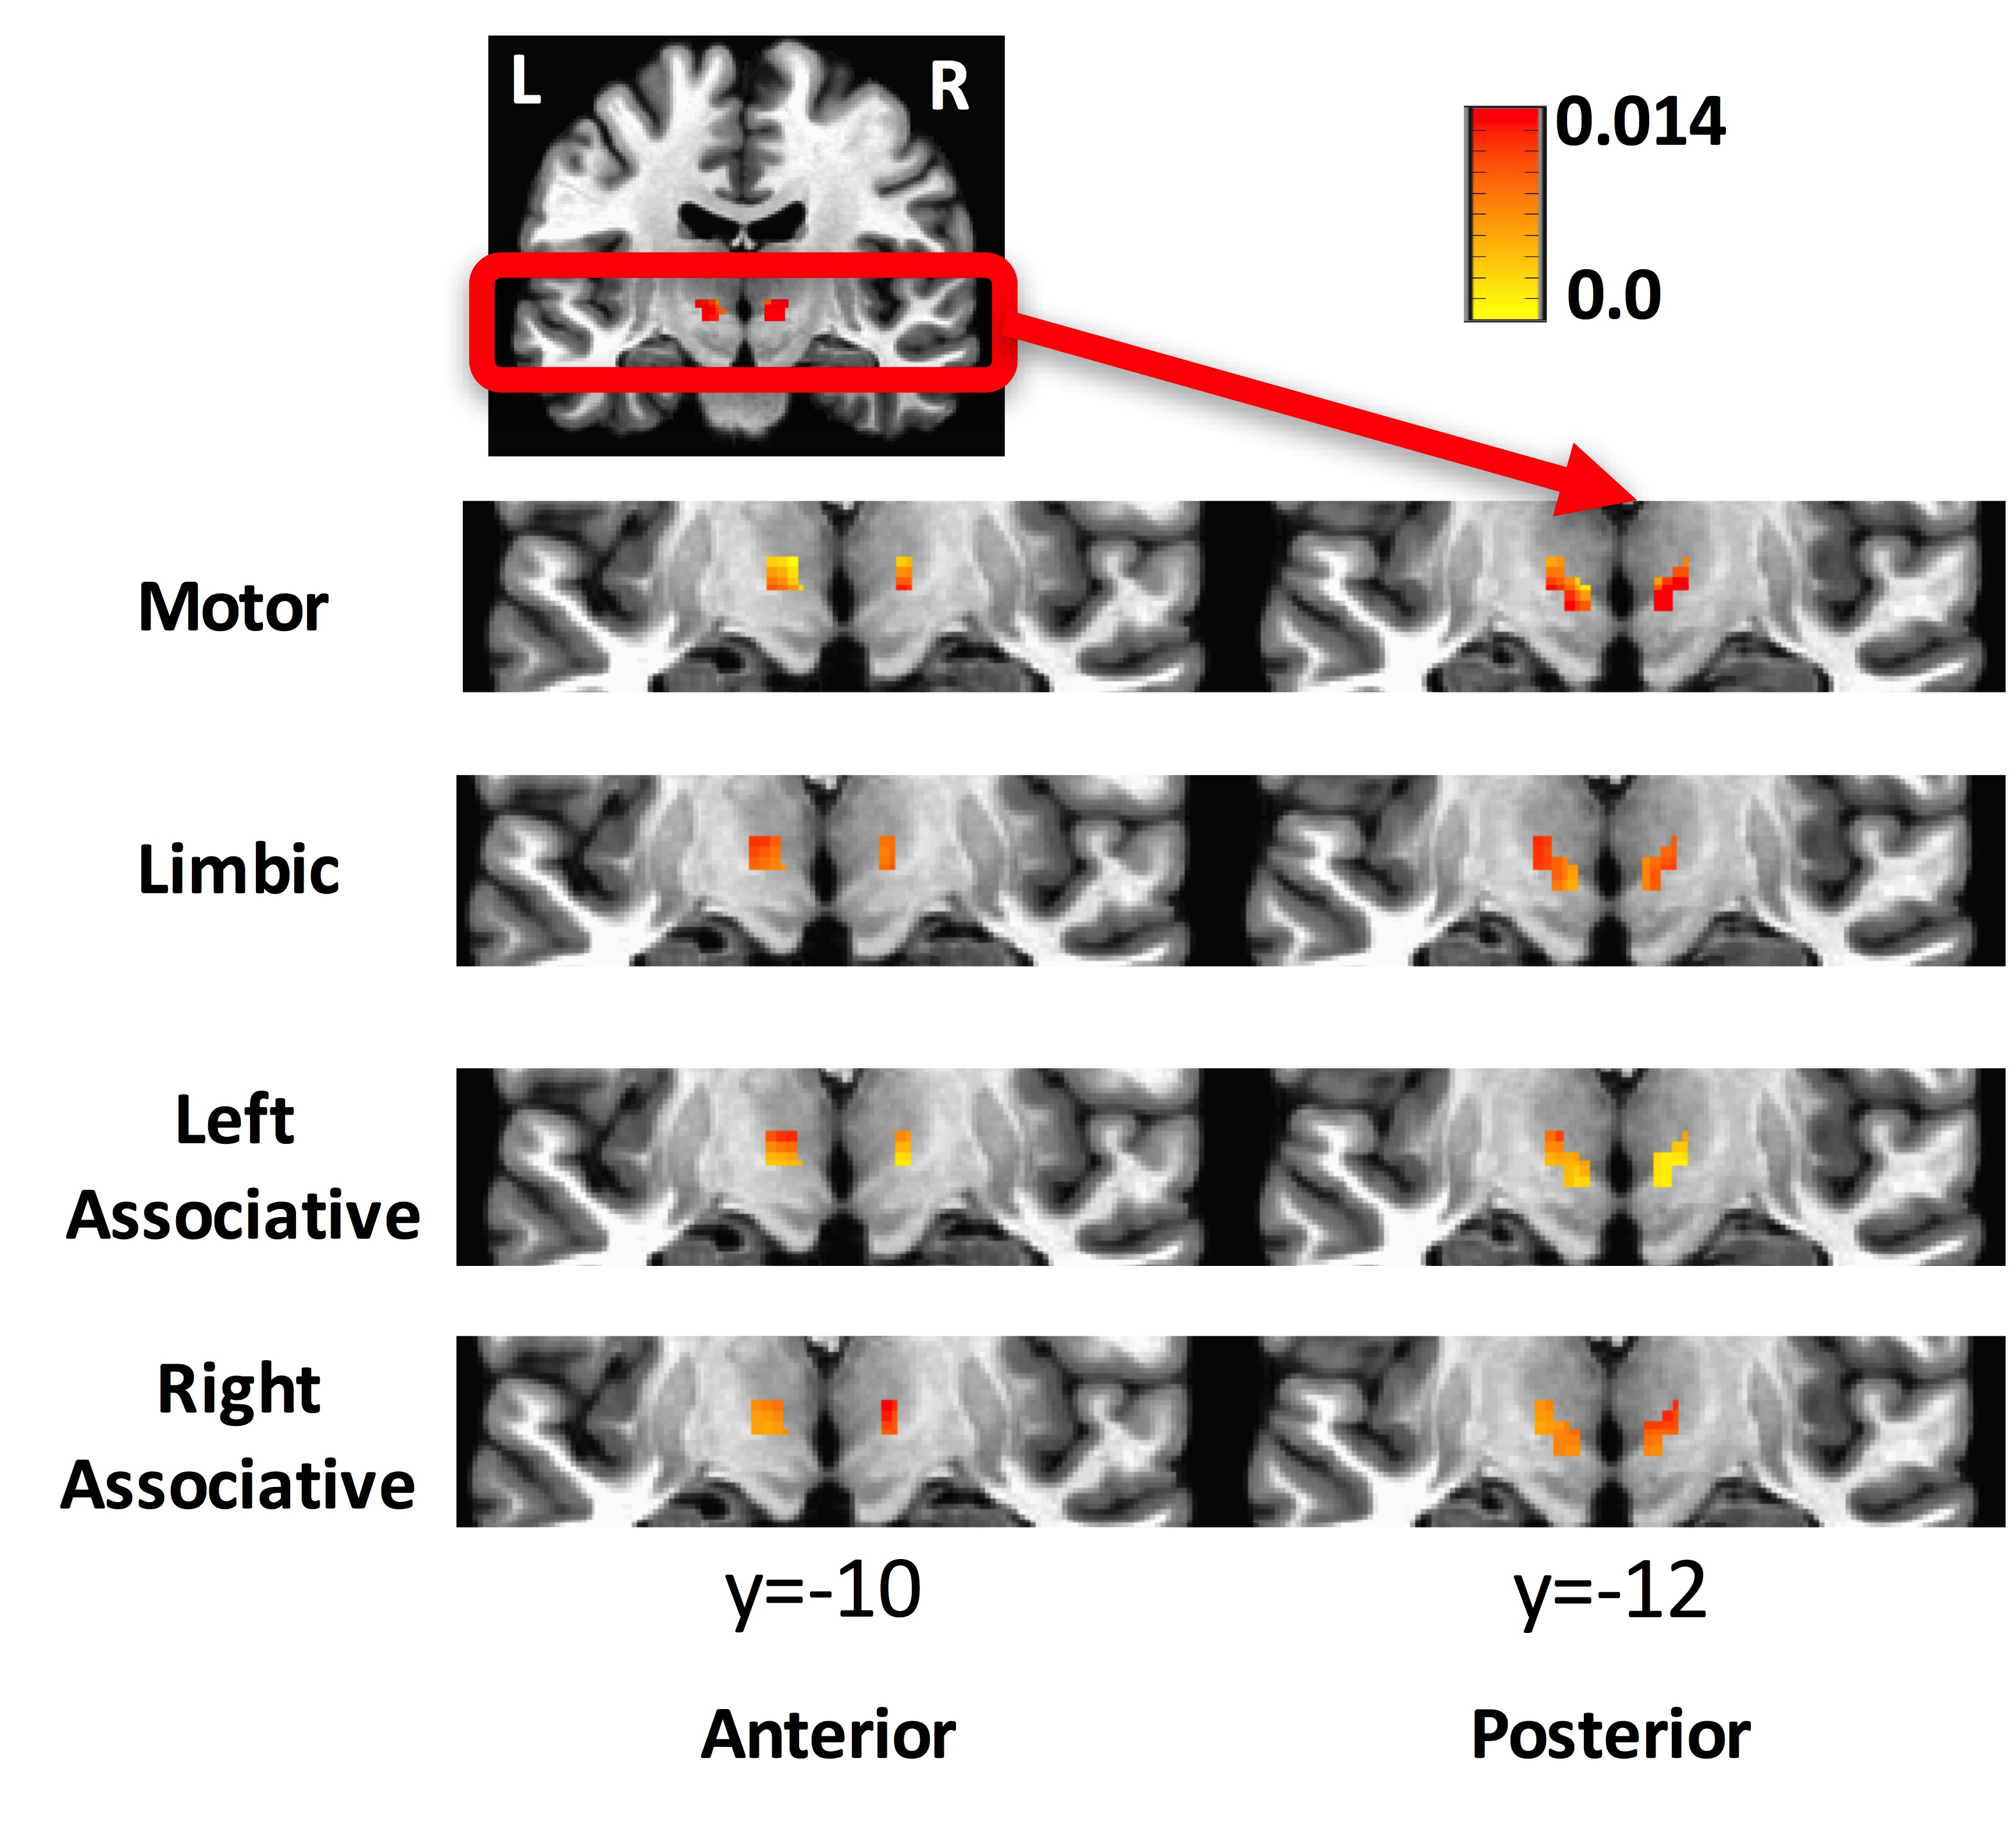
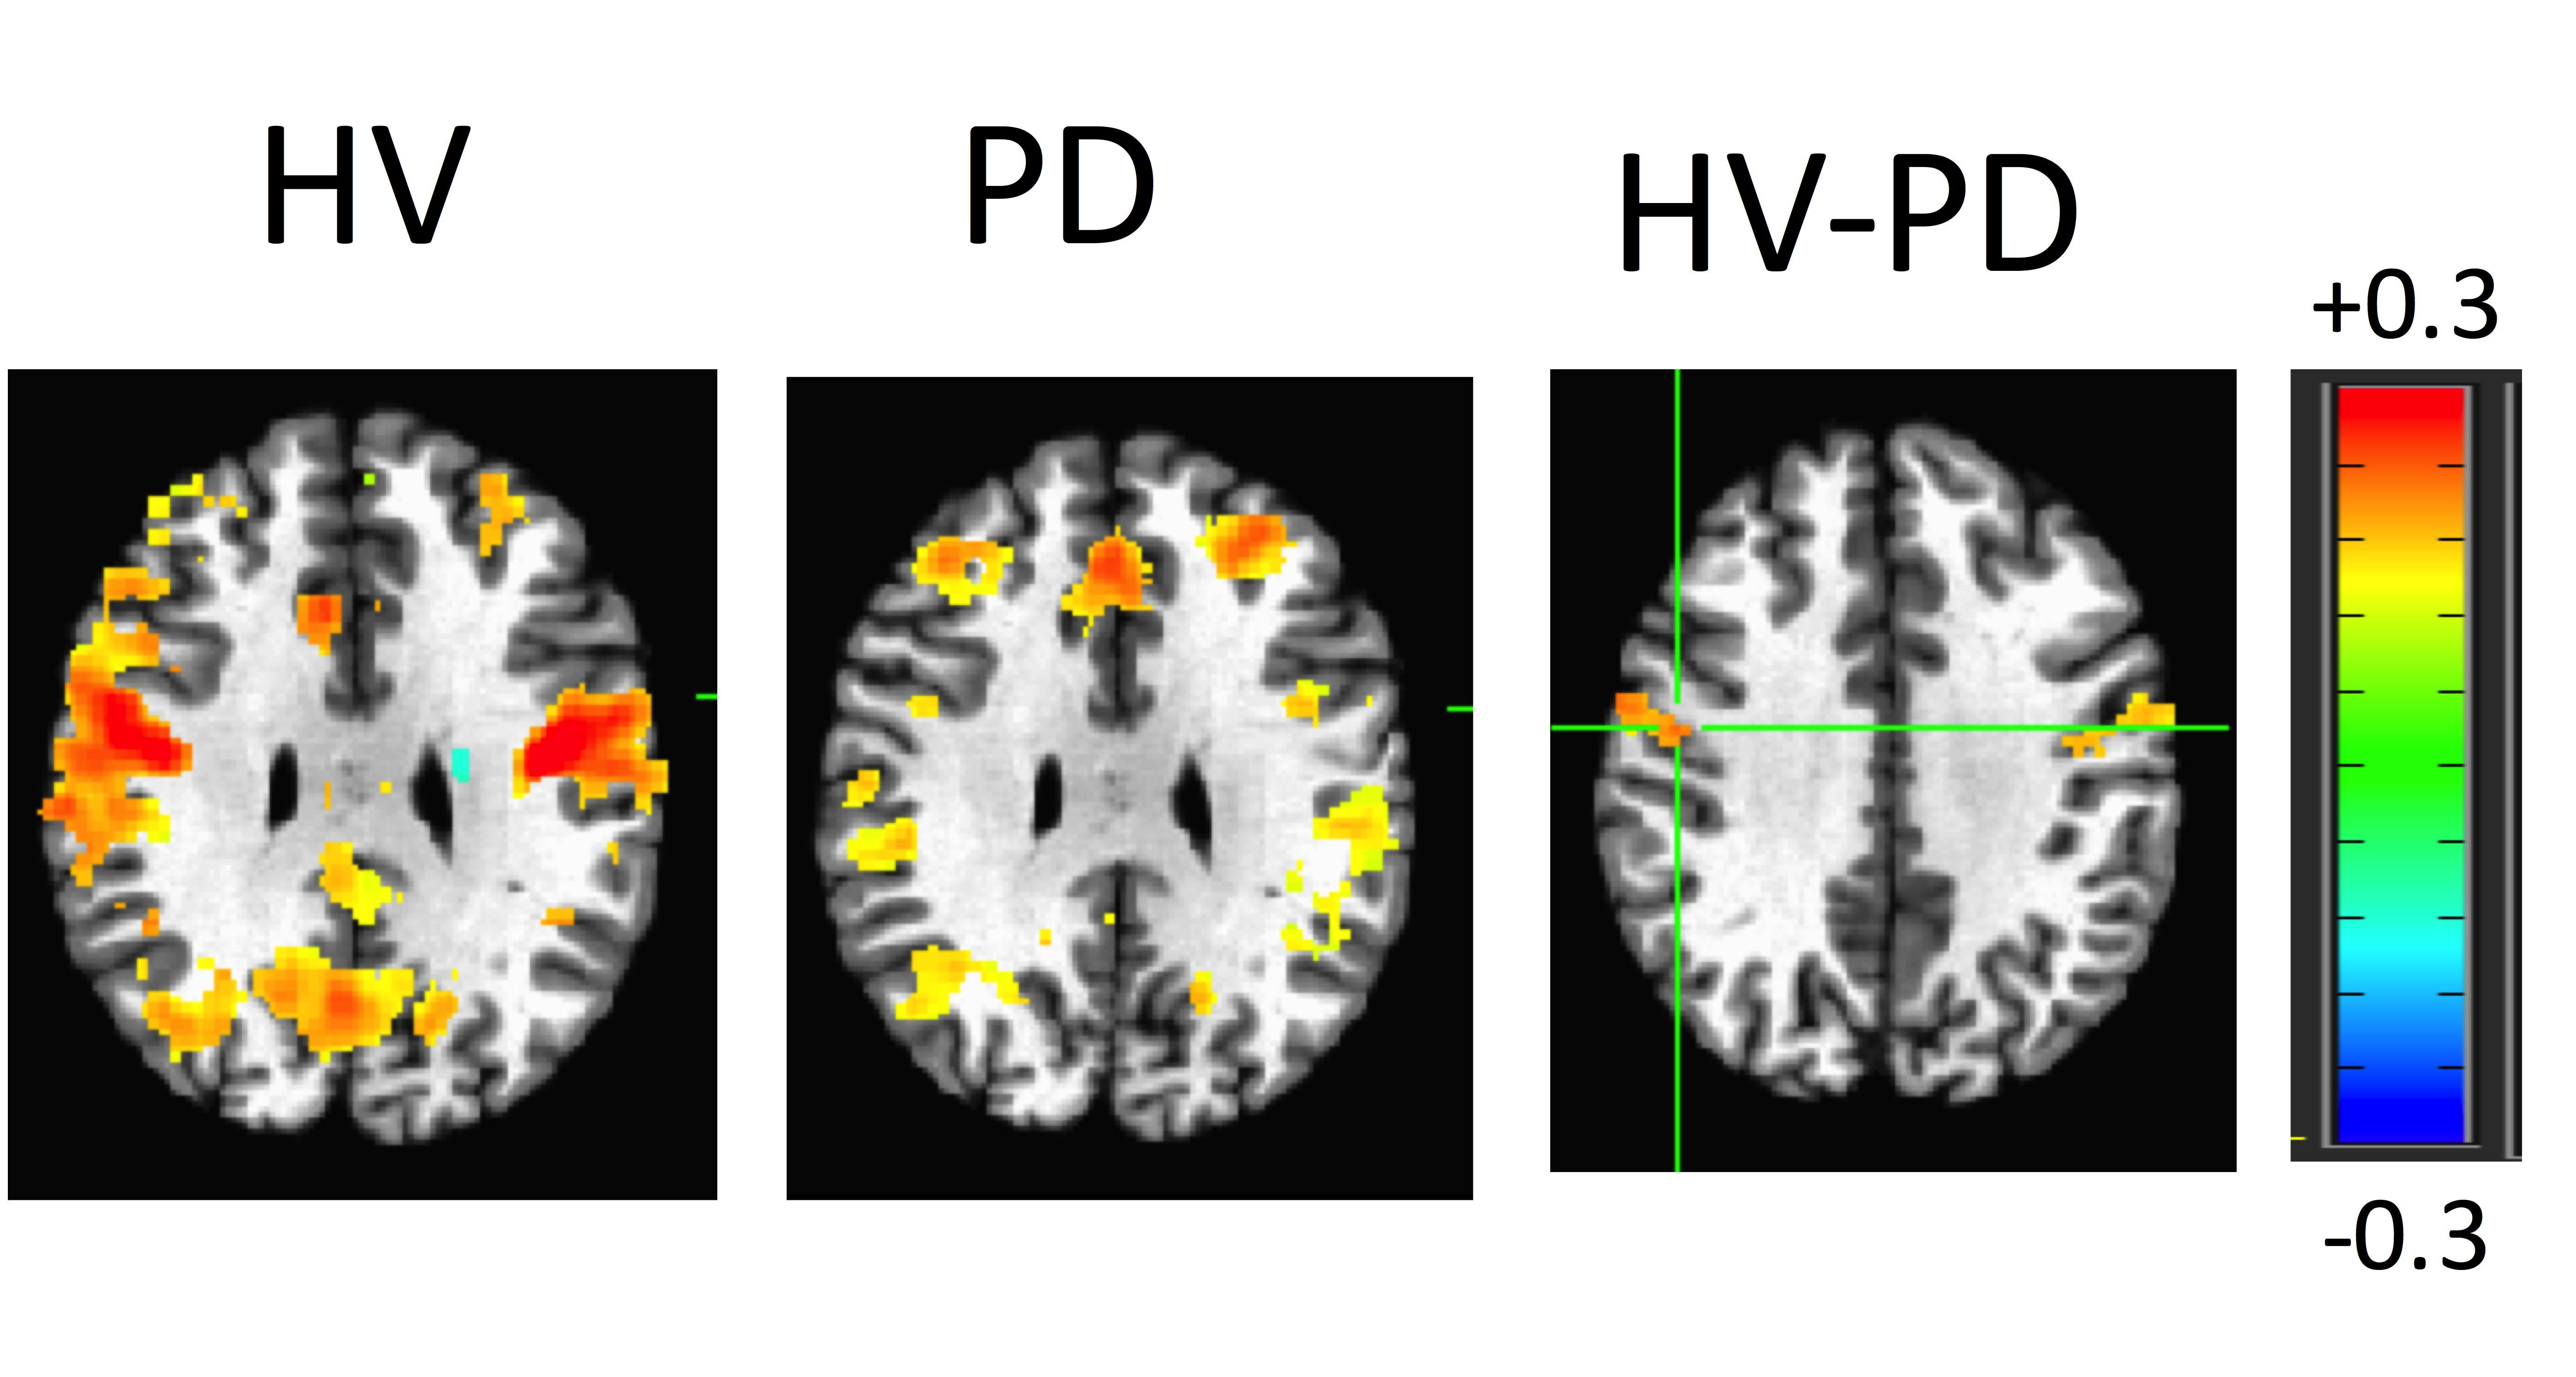
The averaged correlation coefficient of the timecourses of the voxels of the STN was 0.6 indicating a degree of variability across voxels. The ICA and GLM methods identified the different subdivisions of the STN. According to the beta values, the motor part was located in the posterolateral zone, the limbic part in the anteromedial zone, and the associative part between the motor and limbic parts of the STN (Figure 3). This partitioning was verified in cohort 2. The ANOVA test indicated a remapping of connectivity in PD. A cluster of 7 voxels in the right STN (MNI coordinates: 10, -14, -6) showed weaker connectivity to the motor network in PDs compared to HVs. The connectivity map for this cluster showed a significant difference between groups (Figure 4). GC analysis revealed significant connectivity (p<0.05) from M1 to motor STN in HVs, but not in PDs.DISCUSSION
In agreement with neurophysiological recordings and a recent 7T DTI study,11 we were able to identify the three zones of the STN using high resolution fMRI data. In spite of the smoothness of the data and the small size of the structure of interest, these functional zones were observed in both groups distinctly. Moreover, there were significant functional connectivity changes between the groups, especially in the motor STN network. This approach could be used to study the remapping of functional connectivity due to disease in brain areas with heterogenous connectivity patterns.Acknowledgements
This work was supported by the NINDS Intramural Research Program. Liang Li received a grant from China Scholarship Council. The authors thank the staff and physicians of the NINDS Parkinson's Clinic for their support.
References
1. Wagle Shukla, A. & Okun, M. S. Surgical treatment of Parkinson's disease: patients, targets, devices, and approaches. Neurotherapeutics 11, 47-59, doi:10.1007/s13311-013-0235-0 (2014).
2. Lambert, C. et al. Confirmation of functional zones within the human subthalamic nucleus: patterns of connectivity and sub-parcellation using diffusion weighted imaging. Neuroimage 60, 83-94, doi:10.1016/j.neuroimage.2011.11.082 (2012).
3. Lambert, C. et al. Do we need to revise the tripartite subdivision hypothesis of the human subthalamic nucleus (STN)? Response to Alkemade and Forstmann. Neuroimage 110, 1-2, doi:10.1016/j.neuroimage.2015.01.038 (2015).
4. Le Jeune, F. et al. Subthalamic nucleus stimulation affects limbic and associative circuits: a PET study. Eur J Nucl Med Mol Imaging 37, 1512-1520, doi:10.1007/s00259-010-1436-y (2010).
5. Alkemade, A. & Forstmann, B. U. Do we need to revise the tripartite subdivision hypothesis of the human subthalamic nucleus (STN)? Neuroimage 95, 326-329, doi:10.1016/j.neuroimage.2014.03.010 (2014).
6. Forstmann, B. U. et al. Multi-modal ultra-high resolution structural 7-Tesla MRI data repository. Sci Data 1, 140050, doi:10.1038/sdata.2014.50 (2014).
7. Yuan, R. et al. Functional topography of the thalamocortical system in human. Brain Struct Funct 221, 1971-1984, doi:10.1007/s00429-015-1018-7 (2016).
8. Helmich, R.C. et al. Spatial remapping of cortico-striatal connectivity in Parkinson's disease. Cereb Cortex 20, 1175-1186 (2010).
9. Cox, R. W. AFNI: software for analysis and visualization of functional magnetic resonance neuroimages. Comput Biomed Res 29, 162-173 (1996).
10. Calhoun, V. D.A Method for Making Group Inferences fromFunctional MRI Data Using IndependentComponent Analysis, Human Brain Mapping,14:140–151(2001)
11. Plantinga, B. R. et al. Individualized parcellation of the subthalamic nucleus in patients with Parkinson's disease with 7T MRI. Neuroimage, doi:10.1016/j.neuroimage.2016.09.023 (2016).
Figures