2485
Neuromelanin and Volumetric Evaluation in Parkinson’s Disease Patients Carrying LRRK2 or GBA Mutations1Instituto de Biofísica e Engenharia Biomédica, Faculdade de Ciências, Universidade de Lisboa, Lisbon, Portugal, 2Physics Department, Faculdade de Ciências e Tecnologia, Universidade Nova de Lisboa, Lisbon, Portugal, 3Neurological Imaging Department, Hospital de Santa Maria - Centro Hospitalar Lisboa Norte, Lisbon, Portugal, 4Clinical Pharmacology Unit, Instituto de Medicina Molecular, Faculdade de Medicina, Universidade de Lisboa, Lisbon, Portugal, 5Neurology Department, Hospital de Santa Maria - Centro Hospitalar Lisboa Norte, Lisbon, Portugal, 6Institute for Systems and Robotics / Department of Bioengineering, Instituto Superior Técnico, Universidade de Lisboa, Lisbon, Portugal
Synopsis
Previous studies in idiopathic Parkinson’s disease (iPD) have shown a reduction in the substantia nigra (SN) area hyperintense in Neuromelanin-sensitive MR images (NM-MRI). However, a few genetic mutations have been associated to PD. In this study we compared images obtained in iPD and in patients with LRRK2 or GBA mutations. Images were also acquired in control subjects. The area and contrast-ratio of SN in NM-MRI and the relative midbrain volumes were evaluated. There were no significant differences in volumes, but the SN area in NM-MRI accurately differentiated LRRK2 PD patients from controls. No differences were found between PD groups.
Purpose
In the last years, a few genetic mutations have been identified as being associated to increased susceptibility to Parkinson’s disease (PD). Among these, the LRRK2 and GBA genes stand out due to their frequency of associated cases.1 Our goal was to compare the Substantia Nigra (SN) area and contrast ratio in Neuromelanin-sensitive Magnetic Resonance Images (NM-MRI) in patients with LRRK2 or GBA mutations with patients with idiopathic PD (iPD) and controls. The volume of the midbrain was also evaluated.Methods
NM-MRI were analyzed including: 10 control subjects, 13 subjects with LRRK2-related PD (3 with G2019S mutation and 10 with R1441H mutation), 3 with GBA-related PD and 13 with iPD. All data were acquired using a 3.0-Tesla Philips (Best, the Netherlands) Achieva scanner. The NM sequence previously described by Sasaki et al2 was used, consisting of a T1-weighted Fast Spin Echo with parameters: TR/TE 606/10 ms; echo train 3; 0.40 × 0.40 mm2 in-plane resolution and slice thickness of 2.5mm. Magnetization Prepared Rapid Acquisition Gradient Echo (MPRAGE) images were also acquired with 0.74x0.74x1.0 mm3 resolution, TR/TE 9.6/4.6 ms.
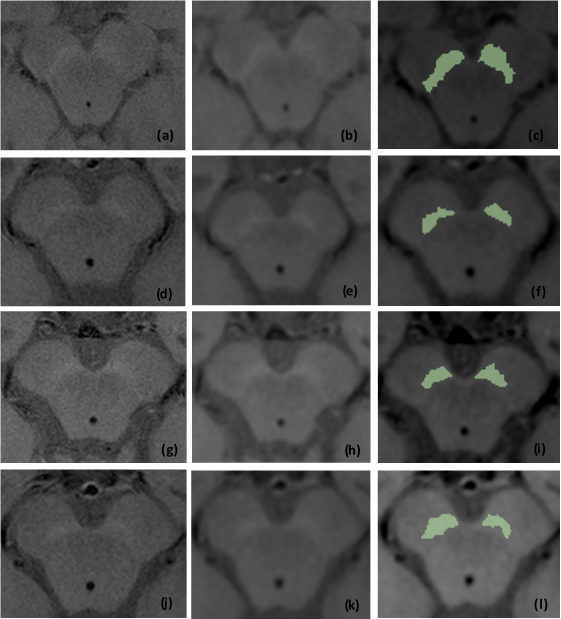
SN area was quantified through semiautomatic region-growing segmentation of the NM-MRI using OsiriX3. Since these images typically suffer from a low signal-to-noise ratio, a Gaussian filter with a 1.0 mm kernel width was applied prior to segmentation. A seed point was selected within the anterior portion of the hyperintense SN region. A closing operation was performed if the resulting region presented holes.
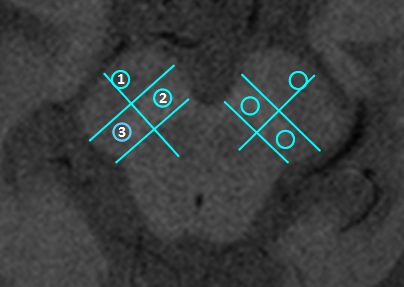
To evaluate the Contrast Ratio (CR), circular regions-of-interest (ROI) covering approximately 26 pixels were drawn using OsiriX in the medial and lateral SN and in the crus cerebri, selected as control - Figure 1. The mean signal intensity was determined within each ROI. The CR for each region of the SN was calculated according to the following equation4:
$$$CR = \frac{SNr }{CC}$$$,
where SNr and CC correspond, respectively, to the average signal intensity in the analysed SN and crus cerebri regions.
FreeSurfer5 (version 6.0) was used to segment the brainstem from MPRAGE images, and divide it into midbrain, pons and medulla. To account for subject variability, the ratio between midbrain and brainstem volumes was evaluated.
Statistical tests were performed using the R software (R Foundation for Statistical Computing, Vienna, Austria). All data analyses was blinded to the genetic status and clinical data of all participants in the study. Wilcoxon tests were applied to compare SN areas and CR between the right and left hemispheres. A Kruskal-Wallis test with Bonferroni multiple comparisons correction was used for comparing between groups. Receiver operating characteristic (ROC) curves analysis was applied for evaluating the discriminatory power of each parameter.
To investigate a potential relation between the midbrain volume and SN NM-MRI area, the Spearman correlation coefficient was calculated.
Results
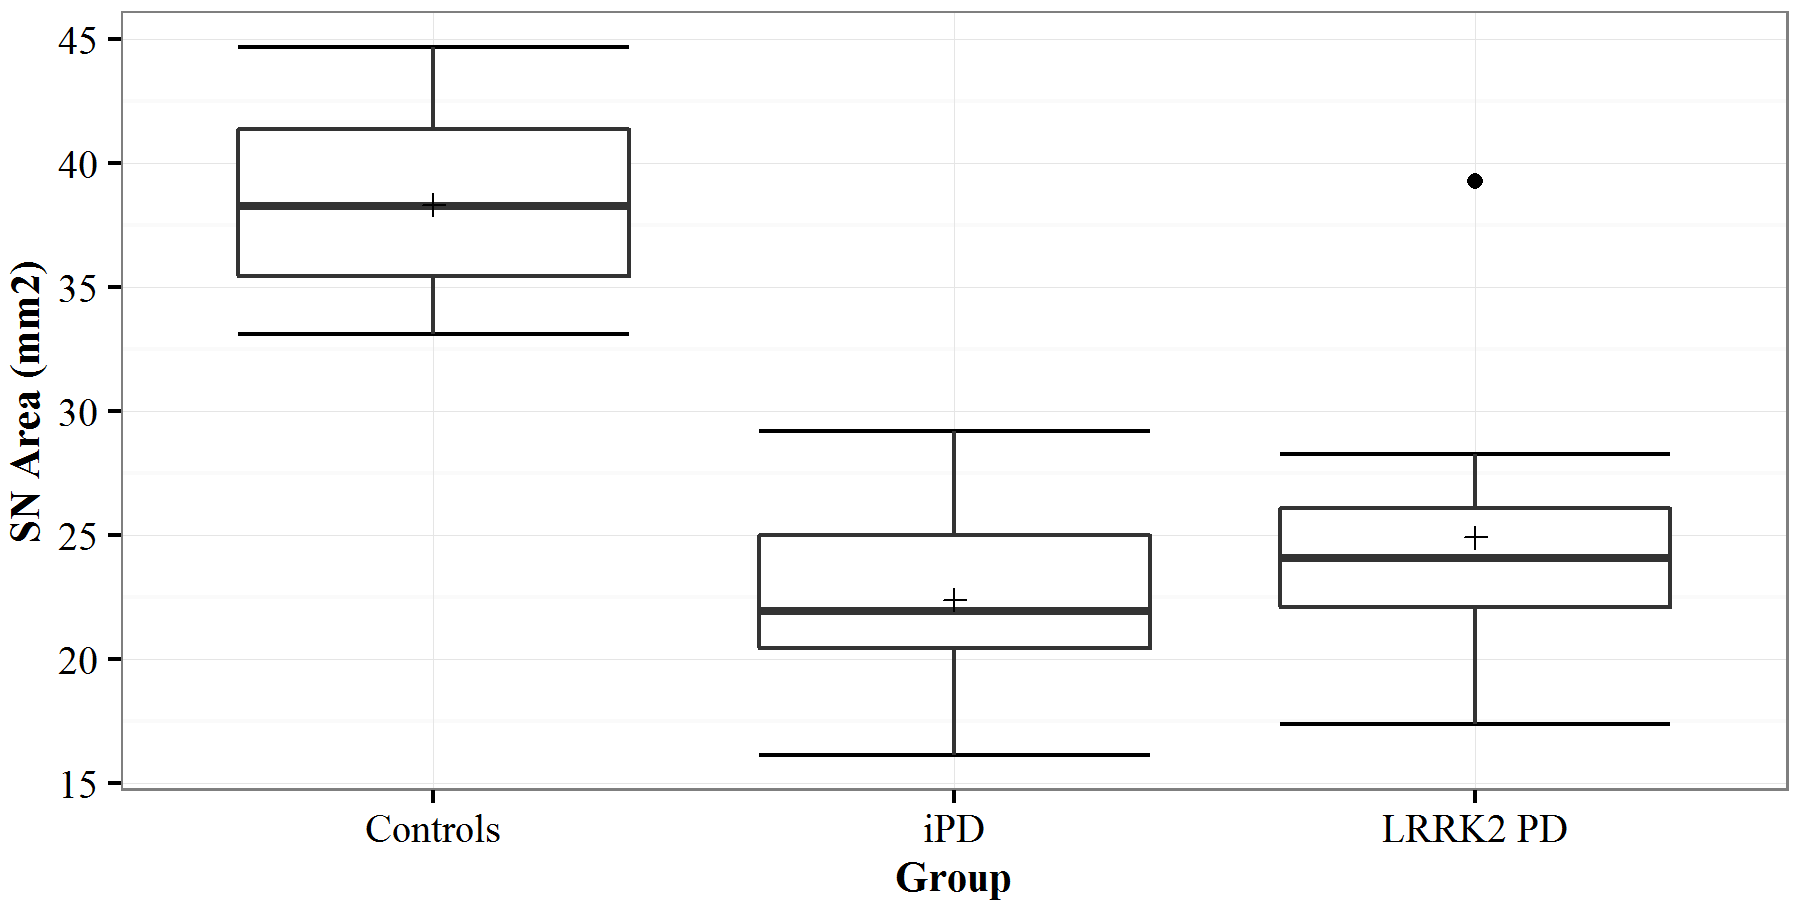
The SN area was significantly decreased in both LRRK2-related PD and iPD patients compared to controls while no significant difference was found between these two patient groups (Figures 2 and 3). PD patients carrying GBA mutations also presented a lower SN area (average: 25.3 mm2). The NM-MRI SN area provided 92.3% sensitivity and 100% specificity in discriminating LRRK2-related PD from controls.
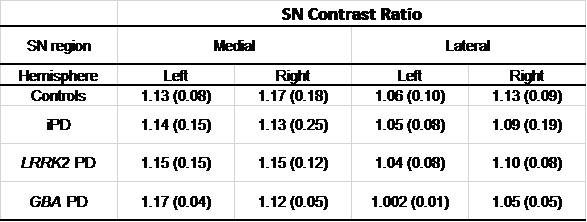
No statistical differences were found between groups in the CR analysis on the medial and lateral regions of either SN side (Table 1). GBA-PD patients also presented similar values to the other groups. The mean (between hemispheres) of the lateral SN CR provided the highest sensitivity and specificity (69.2% and 90.0%, respectively) in differentiating LRRK2-PD from controls.
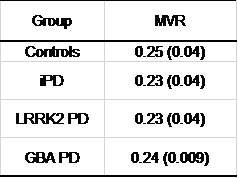
No difference was detected between groups when comparing the midbrain volumes (Table 2). However, the midbrain volumetric ROC analysis resulted in a 75.0% sensitivity and 70% specificity in differentiating LRRK2-PD from controls.
No significant relation was found between the NM-MRI SN area and the midbrain volume (Spearman coefficient: 0.268, p-value: 0.126).
Discussion
The semiautomatic segmentation of the SN enabled to accurately differentiate PD patients with LRRK2 mutations from controls. Although no significant differences were found, the CR in the lateral SN region, known to be the most affected SN region in the presence of PD, tended to decrease. No differences were detected between groups when comparing the midbrain volumes, supporting the hypothesis that a change in the SN area in NM-MRI is not due to a volumetric change.Conclusions
NM-MRI of SN can accurately differentiate LRRK2 PD patients from controls. From all evaluated parameters, the area of the SN provided the best differentiating power. Our results contribute to evaluate NM-MR imaging as a possible diagnostic biomarker of LRRK2-related and GBA-related PD, supporting the need for future studies in NM-MR imaging in asymptomatic carriers.Acknowledgements
Portuguese Foundation for Science and Technology (FCT - IF/00364/2013).References
1. Corti O, Lesage S, Brice A. What Genetics Tells us About the Causes and Mechanisms of Parkinson’s Disease. Physiol Rev. 2011;91(4):1161-1218.
2. Sasaki M, Shibata E, Kudo K, et al. Neuromelanin-Sensitive MRI. Basics,Technique, and Clinical Applications. Clin Neuroradiol. 2008;18(3):147-153
3. OsiriX, http://www.osirix-viewer.com/.
4. Nakane T, Nihashi T, Kawai H, et al. Visualization of neuromelanin in theSubstantia nigra and locus ceruleus at 1.5T using a 3D-gradient echo sequence with magnetization transfer contrast. Magn Reson Med Sci. 2008;7(4):205-210.
5. FreeSurfer. http://www.freesurfer.net/.
Figures