2484
Hierarchical organization of functional networks in patients with Parkinson’s Disease1Cleveland Clinic Lou Ruvo Center for Brain Health, Las Vegas, NV, United States, 2University of Colorado Boulder, Boulder, CO, United States
Synopsis
Earlier studies using fMRI have shown the existence of a modular structure for different brain networks. However, no information exist about hierarchical modular structure of functional connectivity networks in patients with Parkinson’s disease(PD). Using percolation analysis, we found a shift in the hierarchical modular structure of functional connectivity networks in patients with PD. A shift in the modules in caudal-rostral direction in the PD group of motorically affected patients, alongside rearrangement of connector hubs and provincial hubs in PD patients was observed. Potential application of network properties observed here, as predictors of subsequent disease progression is currently being investigated.
Introduction
Representing the brain as a network of connected components has allowed us to study the topological organization of human brain both functionally and structurally. Earlier studies using fMRI have shown the existence of a modular structure for different brain networks. Only few studies have looked at the hierarchical structure in patients with Parkinson’s disease [1]. Thus, in the current study we use resting state fMRI data to study hierarchical modular structure of functional connectivity networks in patients with Parkinson’s disease alongside a cohort of heathy controls.Methods
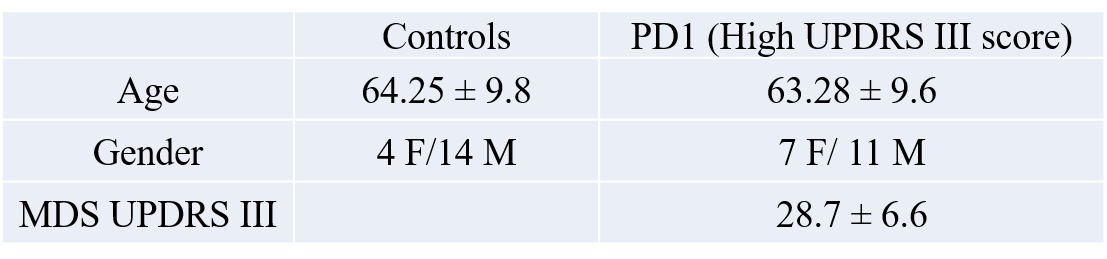
The data used in the preparation of this article were obtained from the Parkinson’s Progression Markers Initiative (PPMI) database (www.ppmi-info.org/data). For up-to-date information on the study, visit www.ppmi-info.org. Functional-MRI data for 18 healthy controls and 18 PD-subjects with high disease severity (in terms of motor dysfunction as measured by MDS UPDRS III) were obtained from the PPMI database (see Table 1 for demographics). Imaging parameters are described in detail at http://www.ppmi-info.org/. After standard preprocessing, mean time series were obtained from 90 ROIs based on the AAL atlas (excluding cerebellum and vermis). Pearson’s correlation was used as the metric of association between the fMRI time series for each possible pair of regions in each group separately. We then applied percolation analysis as describe in Bardella et. al.[3] to look at the association between functional connectivity strength and modularity. We also applied minimal spanning forest (MSF) and minimal spanning tree (MST) to rank modules with strong intra-modular correlations and identify connector and provincial areas respectively. Figures were visualized using BrainNet Viewer toolbox (http://www.nitrc.org/projects/bnv/) [4] and TreeVis toolbox [5].Results
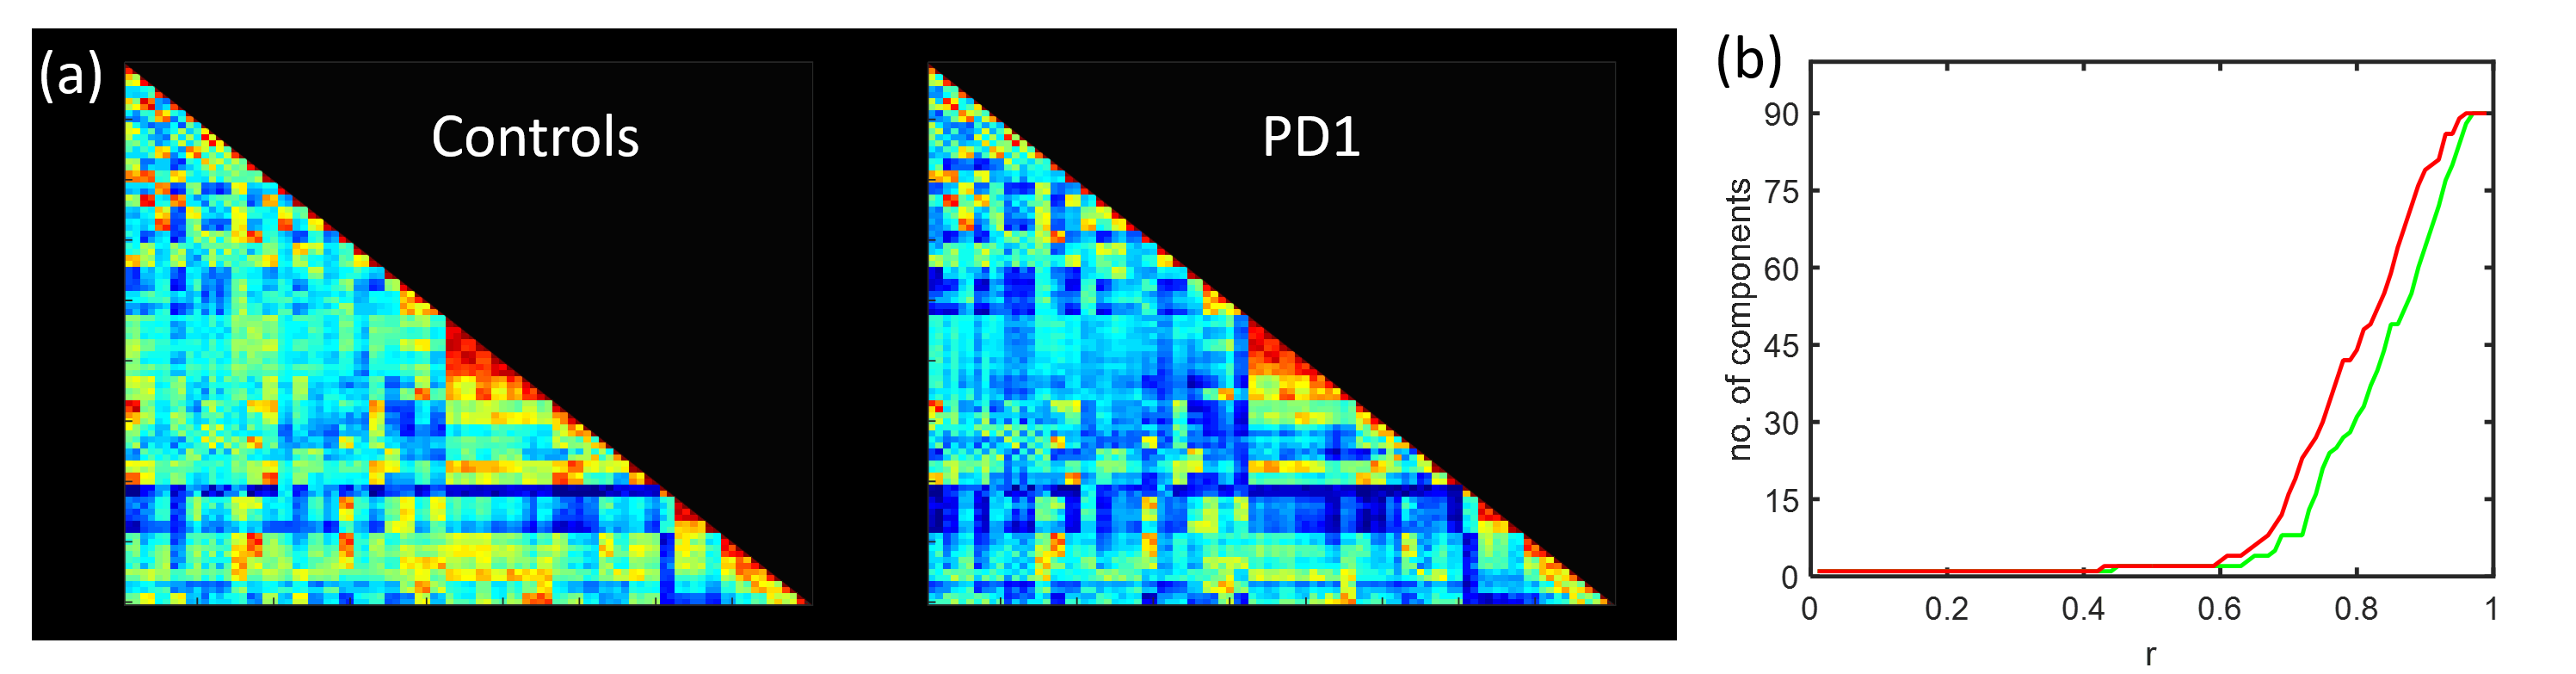
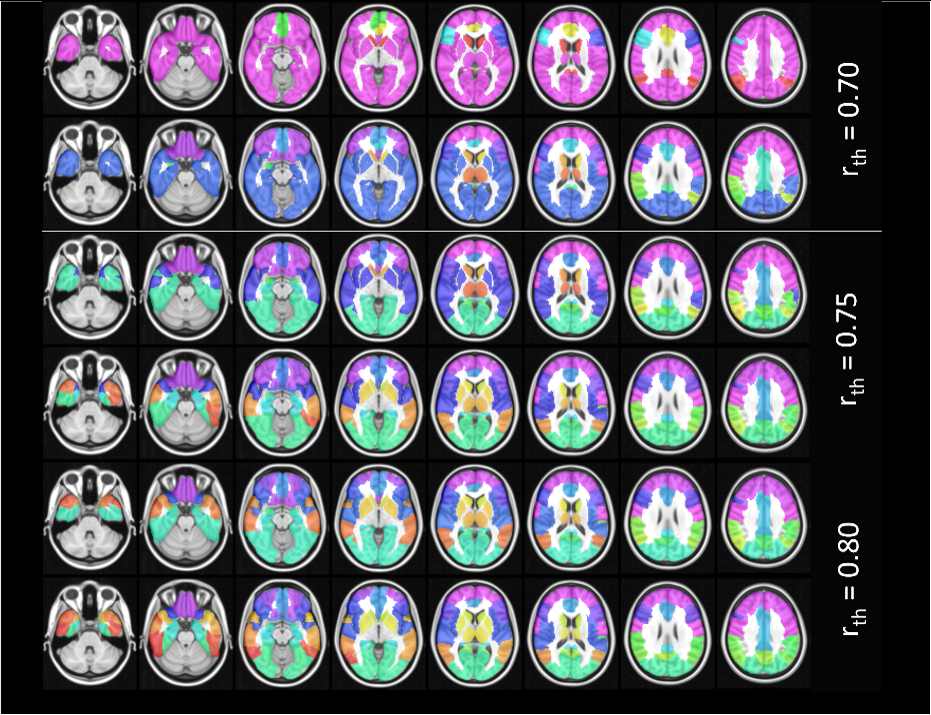
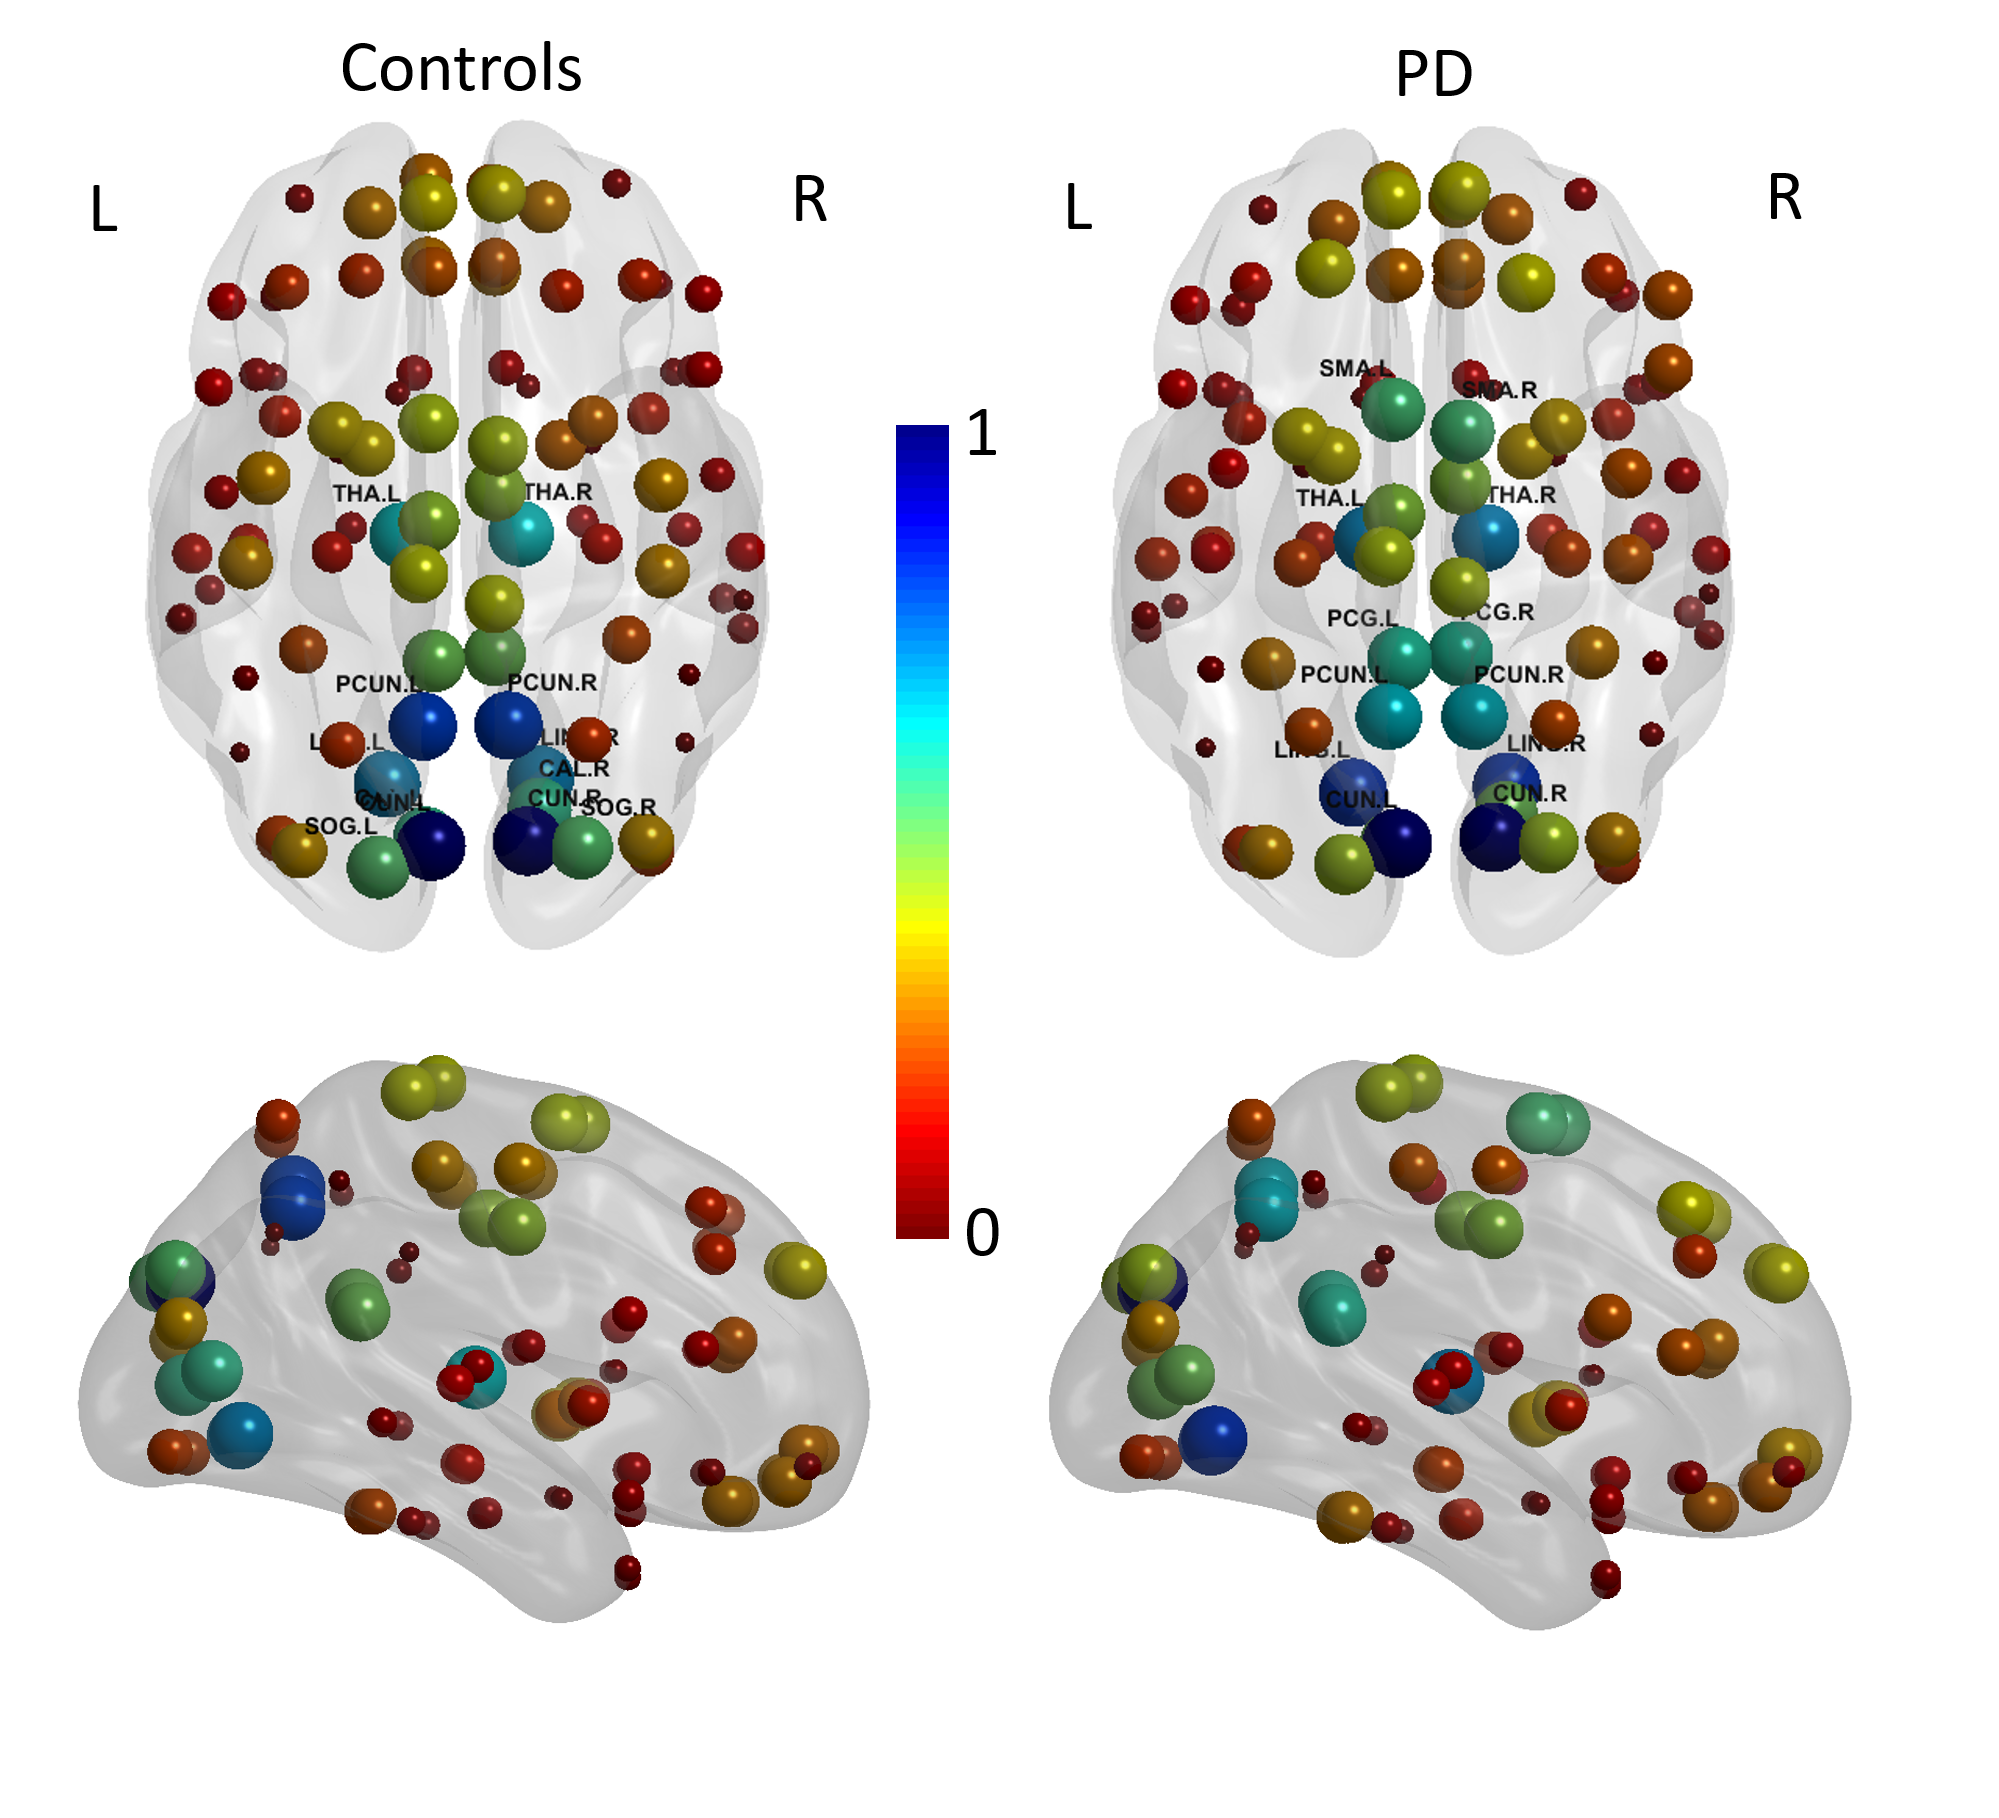
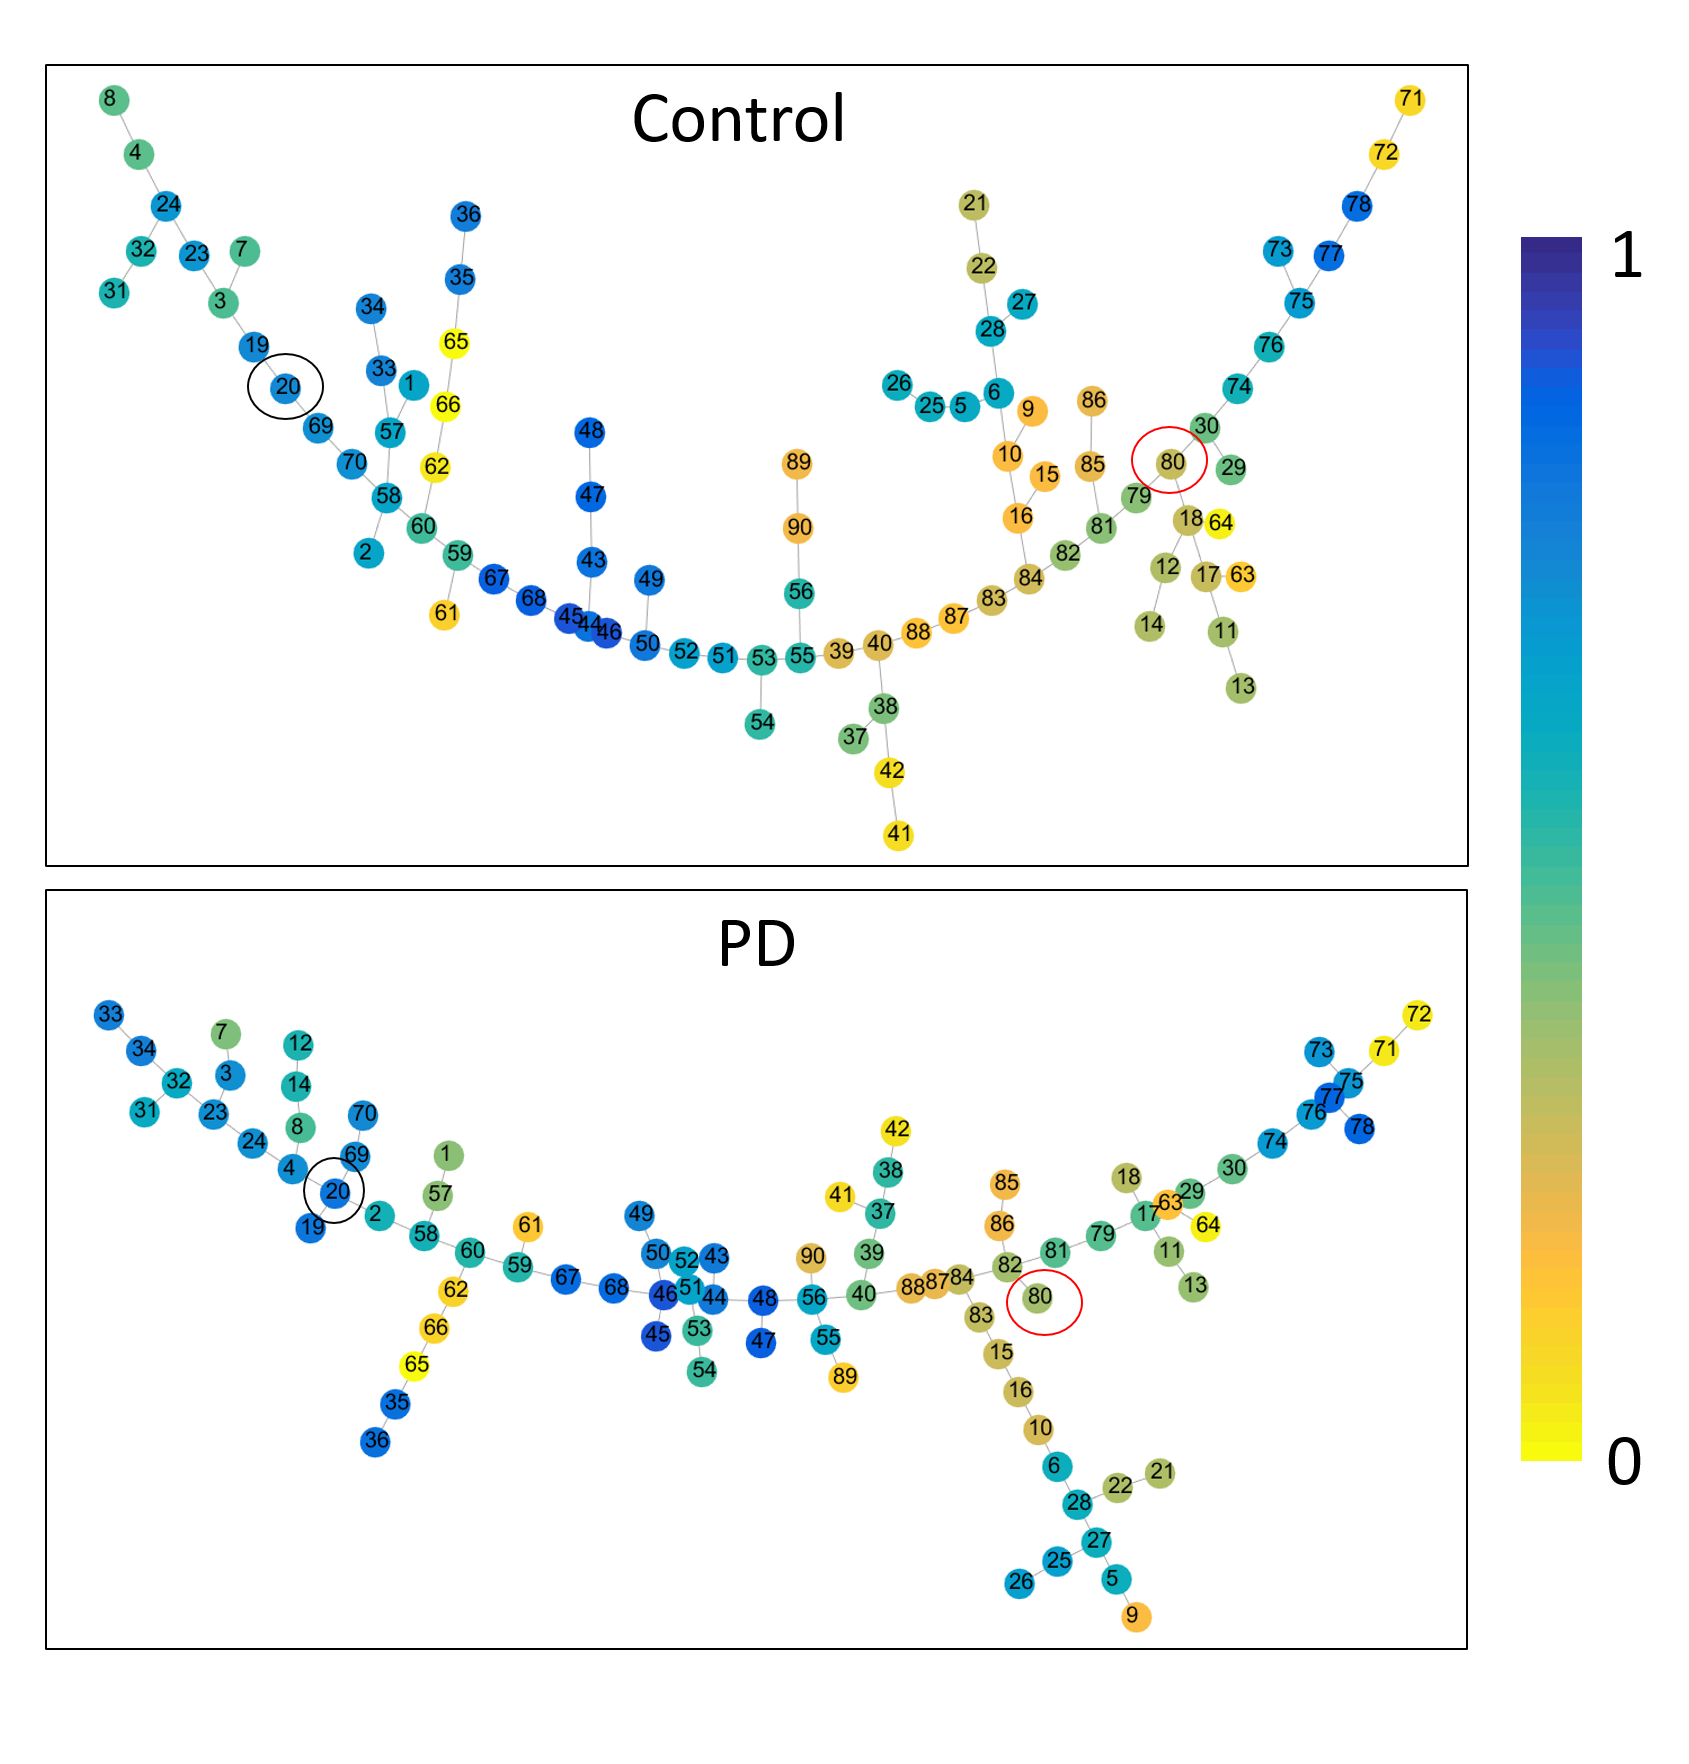
The mean connectivity matrix for the two groups are shown in Fig. 1a. There is an overall decrease in functional connectivity in PD compared to controls. The results of the percolation analyses are shown in Fig. 1b. The plateaus indicate that connections removed were not critical in determining hierarchical modules of the network. We see that in both groups there are multiple thresholds were the components split up into smaller modules when weaker connections are eliminated. Fig 2. shows connected sub modules at different threshold (rth=0.7, 0.75, 0.8). Fig. 3 shows the MSF for the two groups. The modules with the strongest intra-modular correlations in controls include cuneus, precuneus, lingual, thalamus, superior occipital gyrus and calcarine regions. However in PD the modules with the strongest intra-modular correlations include the cuneus, lingual gyrus, thalamus, precuneus, precentral gyrus and supplementary motor area. The MST for the two groups are shown in Fig. 4. This shows the provincial and connector hub difference in the two groups, and we can see that there is visual rearrangement of the MST between the two groups. Example, we can see from figure 4 that the right supplementary motor area (black circle) is a provincial area in the controls and is a connector node in PD, the right Heschl’s gyrus is a connector hub in controls (red circle) but a provincial hub in the PD group.Discussion
The current study revealed shift in the hierarchical modular structure of functional connectivity networks in patients with PD alongside a cohort of healthy controls. The percolation analysis showed the existence of more number of modules in the PD when compared to controls at any given threshold. From the MSF results we can see a shift in the modules with strongest intra - modular correlations from modules including occipital and posterior regions in controls to modules that include more of the motor regions in the PD group of motorically affected patients. Similarly the MST was organized differently with rearrangement of connector hubs and provincial hubs. The significance in the shift of modules in MSF and reconfiguration of MST needs to be further investigated. Future longitudinal studies could provide relevant information about the potential use of specific changes in network parameters as predictors of subsequent disease progression.Acknowledgements
This study was partially supported by the NIH COBRE grant 1P20GM109025-01A1 and the Elaine P Wynn and Family Foundation. The Michael J. Fox Foundation supports the PPMI study for Parkinson’s Research. Other funding partners include a consortium of industry players, non-profit organizations and private individuals.References
[1] Baggio, H.-C., Sala-Llonch, R., Segura, B., et. al. Hum. Brain Mapp., 35: 4620–4634. doi:10.1002/hbm.22499
[2] Ma, Q., Huang, B., Wang, J. et al., Brain Imaging and Behavior doi:10.1007/s11682-016-9524-7.
[3] Bardella G, Bifone A, Gabrielli A, et. al., Scientific Reports 6, Article number: 32060 doi:10.1038/srep32060
[4] Xia M, Wang J, He Y, PLoS ONE 8(7): e68910. doi:10.1371/journal.pone.0068910
[5] Qiua P, Plevritisb SK, Computer Methods and Programs in Biomedicine Volume 109, Issue 1, Pages 74–76.
Figures