2481
Evaluation of Neuromelanin-MRI parameters and Volumetric changes with Parkinson’s Disease Progression1Instituto de Biofísica e Engenharia Biomédica, Faculdade de Ciências, Universidade de Lisboa, Lisbon, Portugal, 2Physics Department, Faculdade de Ciências e Tecnologia, Universidade Nova de Lisboa, Lisbon, Portugal, 3Neurological Imaging Department, Hospital de Santa Maria - Centro Hospitalar Lisboa Norte, Lisbon, Portugal, 4Clinical Pharmacology Unit, Instituto de Medicina Molecular, Faculdade de Medicina, Universidade de Lisboa, Lisbon, Portugal, 5Neurology Department, Hospital de Santa Maria - Centro Hospitalar Lisboa Norte, Lisbon, Portugal, 6Institute for Systems and Robotics / Department of Bioengineering, Instituto Superior Técnico, Universidade de Lisboa, Lisbon, Portugal
Synopsis
This study aimed to characterize changes in Neuromelanin-sensitive MR images with Parkinson’s Disease (PD) progression. The area of high signal intensity in the substantia nigra (SN) and its contrast ratio (CR) were assessed in early and late stage PD (LSPD) patients, and in healthy individuals. The relative hippocampus and midbrain volumes were also estimated from anatomical MPRAGE scans. The SN area was found to be markedly reduced in LSPD compared to early stages of the disease and so could be a useful tool to evaluate disease progression. The decrease in relative hippocampus volume could indicate cognitive impairment, characteristic of LSPD.
Purpose
Most MR studies on Parkinson’s Disease (PD) have focused on early disease stages, investigating potential diagnostic biomarkers which would aid in its differential diagnosis1 with other parkinsonian syndromes. There is also a need to investigate imaging features associated with disease progression that can improve imaging characterization of late stage PD (LSPD). Recently, neuromelanin-sensitive MRI (NM-MRI) has been able to demonstrate high signal intensity in the substantia nigra (SN) area, related to the paramagnetic properties of NM2. This imaging sequence has been used to evaluate neuronal loss in PD, with a significant reduction in NM described in early stages of PD compared with healthy individuals2,3.
The goal of this study was to investigate NM-MRI changes with disease progression, comparing image characteristics in early and LSPD patients. Additionally, since PD progression can be associated to cognitive changes4,5, volumetric analysis of the hippocampus was done using Magnetization-Prepared Rapid Acquisition Gradient-Echo (MPRAGE) images.
Methods
This comparative study included 45 subjects: 12 de novo PD patients (not on antiparkinson medications and with less than 6 months since onset of clinical symptoms), 10 PD patients with 2-5 years disease duration, 13 late stage PD patients (Schwab and England score < 50 or a Hoehn & Yahr stage >3 while medicated) and 10 healthy subjects. Data was acquired using a 3.0-Tesla Philips Achieva scanner. An NM-MRI sequence2 was used, consisting of a Fast Spin Echo T1-weighted sequence with parameters: (repetition time/echo time) TR/TE 606/10 ms; echo train 3; 0.40 × 0.40 mm2 in-plane resolution and 2.5mm slice thickness. MPRAGE images were also acquired with 0.74x0.74x1.0 mm3 resolution, TR/TE 9.6/4.6 ms. The software OsiriX (Lite version 8.0, Genebra, Switzerland) was used to analyze the NM-MR images. A Gaussian filter (0.8 mm width) was applied to reduce image noise, before using the confidence region-growing algorithm for image segmentation. Two symmetrical seed points were manually defined on the most medial part of the high intensity SN area; the mean of the two areas was considered in subsequent analyses. The SN Contrast Ratios (CR) were assessed by positioning circular regions of interest (ROI), covering approximately 26 pixels, in the medial and lateral parts of both sides of the SN and in the lateral part of the crus cerebri, taken as reference.
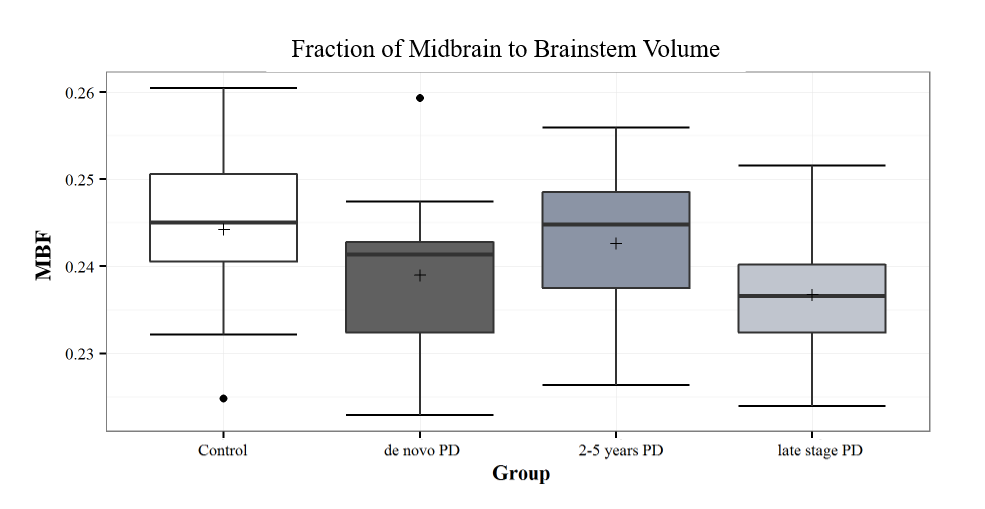
Volumetric changes were evaluated using Freesurfer6 for the automatic segmentation of the MPRAGE images. The midbrain, brainstem, hippocampus and total intracranial volumes (TIV) were estimated. To account for inter-subject variability, the Hippocampus Volume Fraction (HVF) was calculated relative to the TIV. The fraction of midbrain to brainstem volume (MBF) was also evaluated. Statistical analysis was performed using the R software (R Foundation for Statistical Computing, Vienna, Austria). Kruskal-Wallis tests were employed with P values corrected for multiple comparisons (Bonferroni method). Potential differences in the SN areas, CR, HVF and MBF were evaluated. A P-value of 0.05 was considered to be significant.
Results
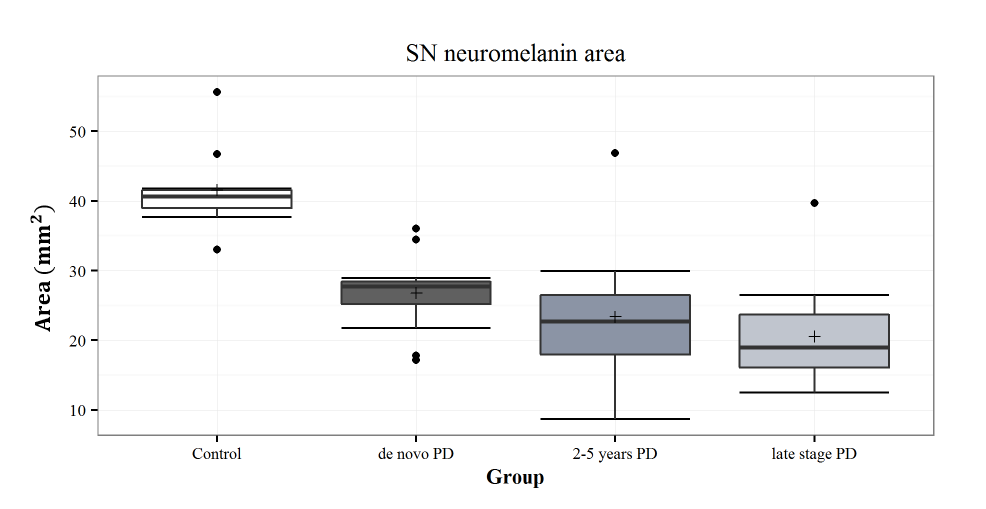
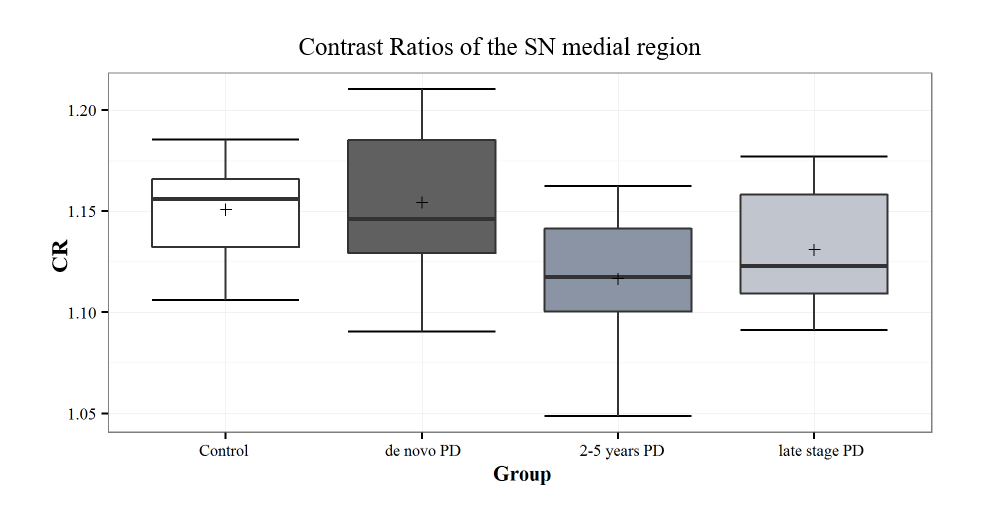
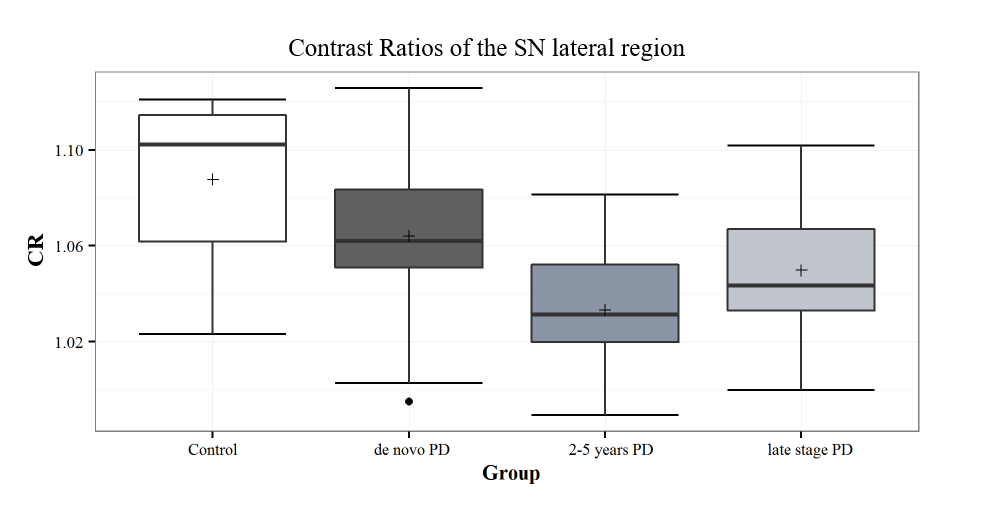
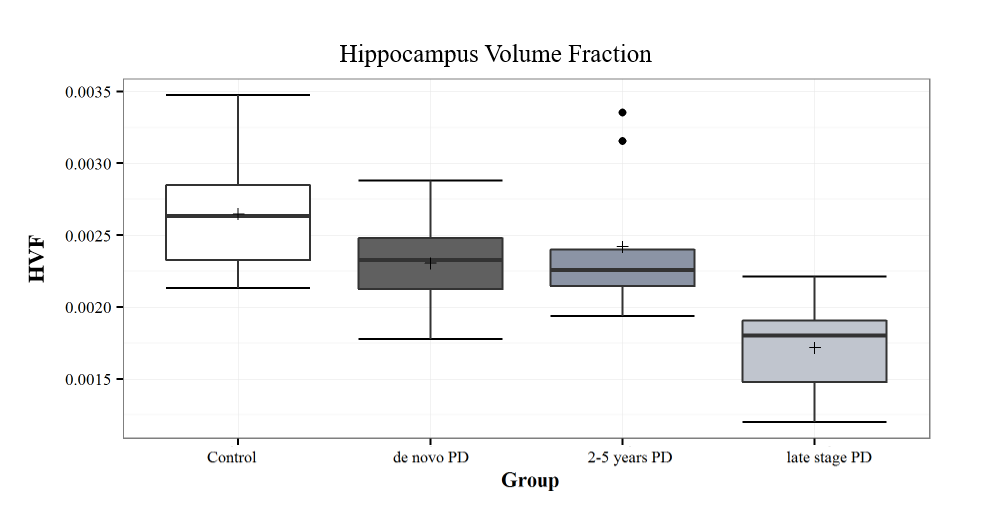
The SN area was markedly decreased in the PD groups compared with controls. Among the PD groups, a tendency for a reduction of the SN area was observed with disease progression (Figure 1). Significant differences were observed between healthy controls and all PD groups (P-value < 0.002 for all comparisons), as well as between the de novo and LSPD groups (P-value=0.005). No significant differences were found among groups in the CR in medial SN (P-value=0.06) - Figure 2. In the lateral region, a decrease in CR was observed in the PD groups compared to controls (P-value=0.01) (Figure 3). Contrarily to this trend, an increment in CR was observed for the LSPD group compared to the 2-5yrs PD group. A significant hippocampus atrophy was found in the LSPD group compared to early stage patients (Figure 4). Substantial overlaps were observed in the MBF among groups, with no significant differences found (P-value=0.205) (Figure 5).Discussion
Decreased SN areas were measured in early stage PD patients compared to controls, in agreement with previous reports2,3. Although this parameter tended to decrease further in LSPD patients, the difference was highest between de novo PD patients and controls suggesting that most changes occur before diagnosis.
Significant changes in CR were only detected in the lateral SN region; this is consistent with previous studies7. The increase in CR observed for LSPD versus 2-5 years PD group suggests a potential medication response but needs to be further investigated.
A reduced hippocampus volume had not previously been reported in LSPD and may be associated to dementia8 .
Conclusions
The results suggest that both SN area in NM-MRI and the hippocampus volumetric measurements could be useful biomarkers for clinically monitor PD progression.Acknowledgements
Portuguese Foundation for Science and Technology (FCT - IF/00364/2013).References
1. Stoessl AJ, Martin WRW, McKeown MJ, et al., Advances in imaging in Parkinson’s disease. The Lancet Neurol. 2011; 10(11):987–1001.
2. Sasaki M, Shibata E, Tohyama K, et al., Neuromelanin magnetic resonance imaging of locus ceruleus and substantia nigra in Parkinson’s disease. Neuroreport. 2006; 17(11):1215-8.
3. Reimão S, Pita Lobo P, Neutel D, et al., Substantia nigra neuromelanin magnetic resonance imaging in de novo Parkinson’s disease patients. Eur J Neurol. 2015; 22(3):540–6.
4. Junqué C, Ramírez-Ruiz B, Tolosa E, et al., Amygdalar and hippocampal MRI volumetric reductions in Parkinson’s disease with dementia. Mov Disord. 2005; 20(5), 540–4.
5. Burton EJ, McKeith IG, Burn DJ, et al., Cerebral atrophy in Parkinson’s disease with and without dementia: A comparison with Alzheimer’s disease, dementia with Lewy bodies and controls. Brain. 2004;127(4), 791–800.
6. Freesurfer. http://surfer.nmr.mgh.harvard.edu/
7. Ohtsuka C, Sasaki M, Konno K, et al., Changes in substantia nigra and locus coeruleus in patients with early-stage Parkinson’s disease using neuromelanin-sensitive MR imaging. Neurosci Lett. 2013; 541, 93–8
8. Ibarretxe-Bilbao N, Tolosa E, Junque C, et al., MRI and cognitive impairment in Parkinson’s disease. Mov Disord, 2009; 24(2),748–53.
Figures