2480
Improved detection of grey matter atrophy in Parkinson's disease in a Chinese population using the Chinese2020 template1Department of Radiology, Xuanwu Hospital, Capital Medical University, Beijing, People's Republic of China, 2Department of Medicine and Therapeutics, The Chinese University of Hong Kong, Hong Kong, Hong Kong, 3MR Collaboration, Northeast Asia, Siemens Healthcare, Beijing, People's Republic of China, 4Shenzhen Research Institute, The Chinese University of Hong Kong, Shenzhen, People's Republic of China, 5Research Center for Medical Image Computing, Department of Imaging and Interventional Radiology, The Chinese University of Hong Kong, Hong Kong, Hong Kong
Synopsis
The human brain differs significantly between different individuals, as well as between different demographics (i.e., age, gender, and race). The aim of the present study was to investigate the effectiveness of a Chinese brain template, i.e., Chinese2020, on the detection of grey matter (GM) alteration between patients with Parkinson’s disease (PD) and healthy controls (HC). The results of this study indicate that Chinese2020 was more representative of Chinese populations, which suggests that neuroimaging studies based on Chinese populations should be normalized to the Chinese brain atlas and that previous studies based on Chinese populations might need to be updated.
Introduction
Human brains are highly varied among different demographics (e.g., gender, age, and race). A recent study by our group has demonstrated that the Chinese brain atlas improved accuracy and reduced anatomical variability during registration, which suggests that a population-specific brain atlas may be more appropriate for studies involving Chinese populations [1]. In addition to the effects of variable patient characteristics, such as age, disease duration, and disease severity, the population-based brain atlas may account for inconsistencies during spatial normalization between Chinese and Caucasian populations. The aim of the present study was to compare the grey matter alteration between Chinese PD patients and healthy controls (HC) by using the a typical statistical Chinese brain template named as Chinese2020 [1], which is based on more than two thousand Chinese subjects, and by using the standard Caucasian brain atlas of MNI152, which was constructed based on 152 Caucasian brains [2].Methods
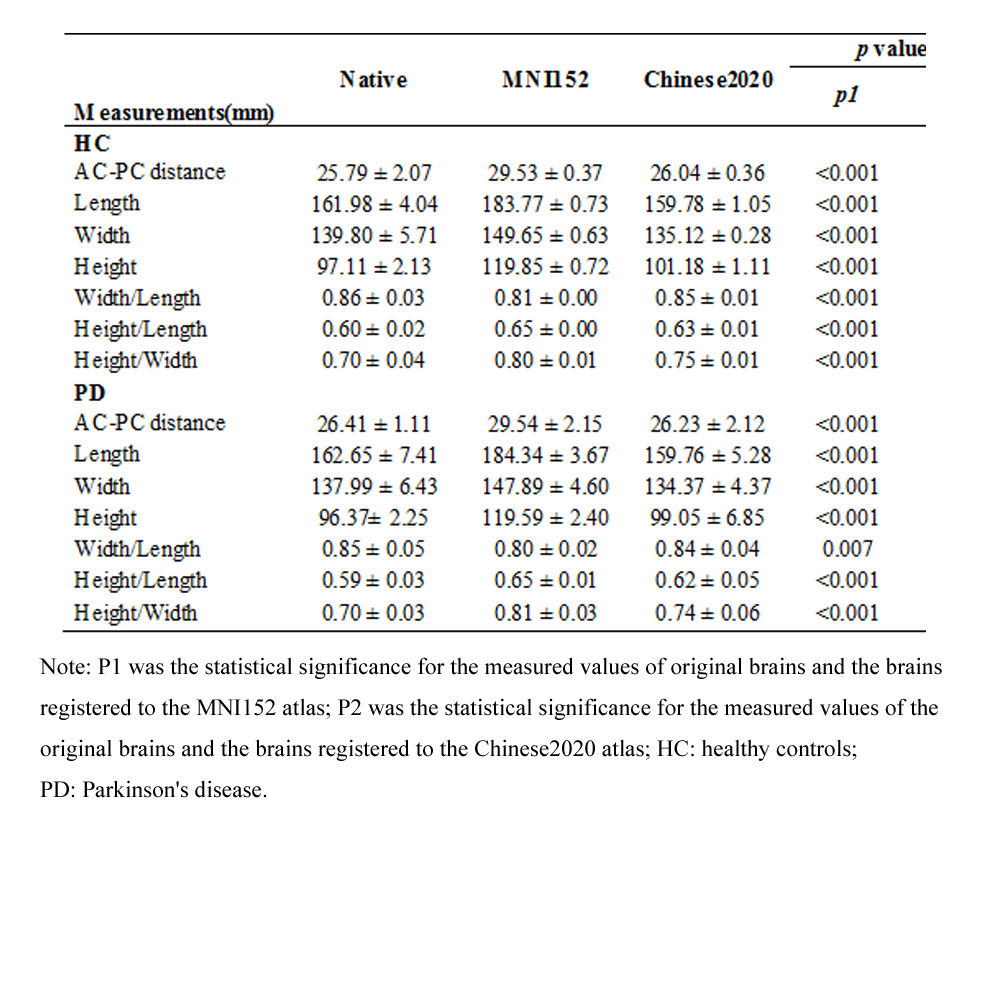
Fifteen PD patients (8 males, 64.8±7.5 years old) and 15 gender- and age-matched HC (8 males, 59.8 ± 5.2 years old) were recruited in this study. All patients met the UK PD Society Brain Bank criteria for the diagnosis of PD. Patients were assessed with the Unified Parkinson’s Disease Rating Scale (UPDRS) and the Hoehn and Yahr (HY) Scale while off medications. Cognitive state was assessed with the Montreal Cognitive Assessment (MoCA). MRI examinations were acquired using a MAGNETOM Trio Tim 3T MR system (Siemens, Erlangen, Germany). Three-dimensional (3D) T1-weighted magnetization-prepared rapid gradient echo (MPRAGE) sagittal images were collected. First, the original brain shape and size were measured in the native space for PD patients and HCs. Then the images were spatially normalized into both the MNI152 space and the Chinese2020 space. Seven metrics of brain shape and size were measured: AC-PC line distance, length (rostral-caudal), width (left -right), height (superior-inferior), width/length, height/length, and height/width.
The T1-weighted anatomical images of each participant were segmented and normalized into both MNI152 and Chinese2020 spaces using SPM8 (Statistical Parametric Mapping, Wellcome Department of Imaging Neuroscience, London, UK). The GM maps from MNI152 and Chinese2020 spaces were analyzed using the General Linear Model (GLM) on a voxel-wise comparison across the whole brain. An absolute GM threshold of 0.2 was used to avoid possible edge effects around the border between GM and WM both for MNI152 and Chinese2020 spaces. Two-sample t-tests were performed to identify grey matter alteration between PD patients and HCs.
Results
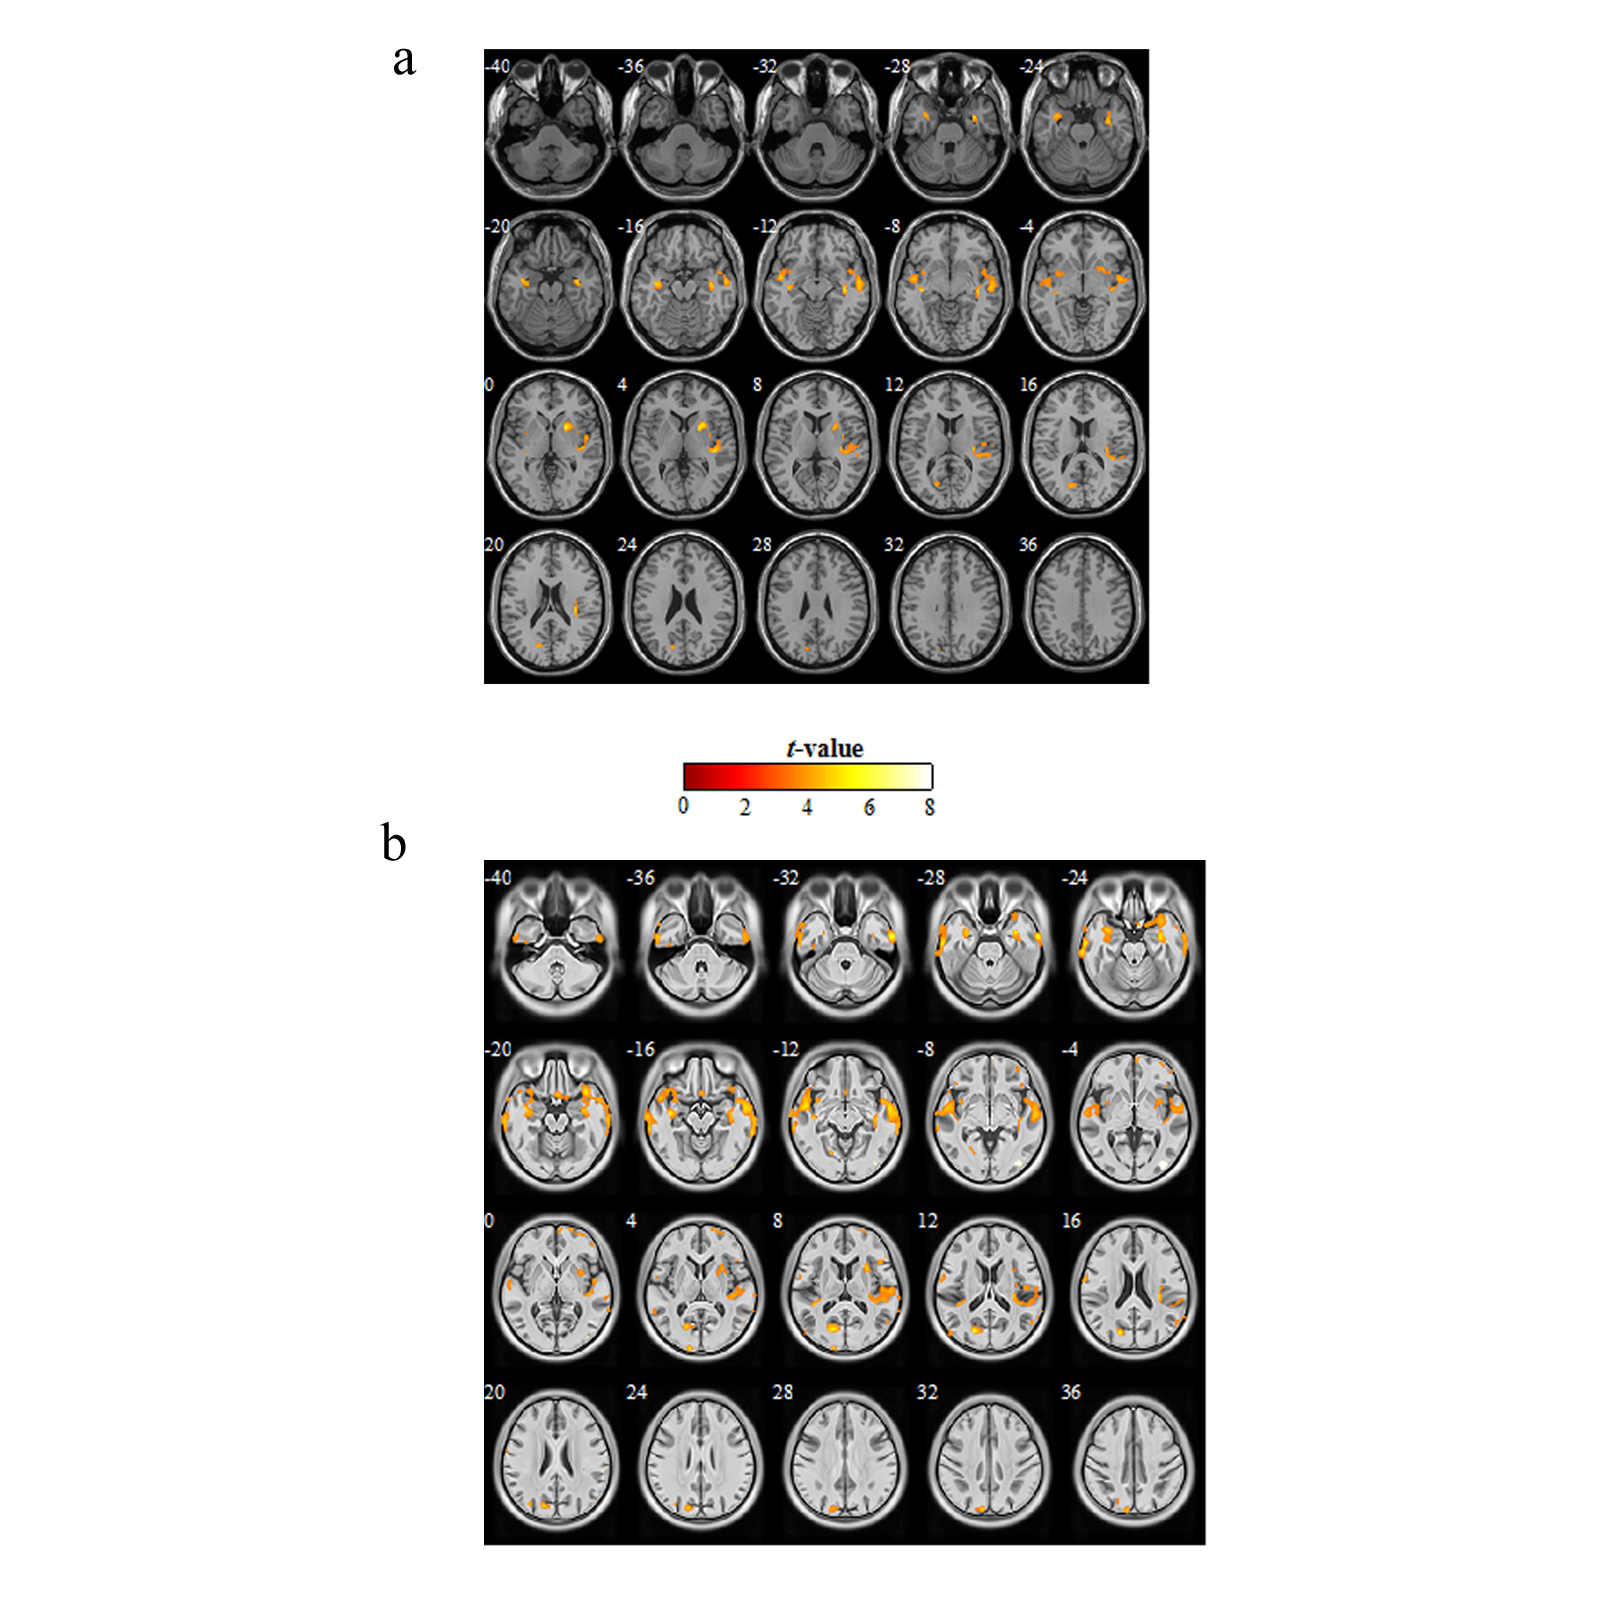
In Table 1, which compares images registered to the MNI152 and to the Chinese2020, more deformations were needed in brain shape and size when images were registered to the MNI template than to the Chinese template. These results indicate that the Chinese population better fit the Chinese template. The detected brain atrophy of each atlas is presented in Figure 1. Compared to HCs, significant GM atrophy in PD patients was detected by using the MNI152 template in areas including the bilateral temporal lobe extending into the insula and the hippocampus/parahippocampal gyrus, the left superior occipital cortex, the precuneus/cuneus, and the right putamen. The atrophy within the aforementioned regions was also detected using Chinese2020 but with a larger cluster size. Furthermore, additional GM atrophies were revealed in the right middle/inferior occipital cortex, the right precuneus, the right middle/superior/inferior frontal gyrus, and the right orbitofrontal cortex in the Chinese2020 space. No increased grey matter was observed in PD patients using either the MNI152 or Chinese2020 template. To compare the effectiveness of the Chinese2020 and the MNI152, the mean of GM percentage in the detected regions based on the Chinese2020 (61.50 ± 5.09%) was significantly higher (p < 0.05) than that of the MNI152 (39.5 ± 8.96%).Discussion
Chinese brain morphology differs from that of Caucasians in regards to shape and size. In the present study, the Chinese2020 template was employed to identify brain alteration differences between PD patients and HCs in a Chinese population. Fewer deformations were required to spatially normalize the Chinese population’s brain to Chinese2020 than to the MNI atlas, which suggests that the Chinese2020 better represented the characteristics of the Chinese population than the MNI152. Furthermore, the Chinese2020 template allowed for more accurate alignment than MNI152 and enhanced the sensitivity of MRI in detecting pathological alterations in brain morphology as shown by the finding that Chinese2020 allowed for better GM atrophy detection in Chinese PD than MNI152.Conclusion
The present study indicates that the characteristics of Chinese brains are better represented by the Chinese2020 template than the MNI152 template, which suggests that neuroimaging studies of Chinese populations should be normalized to the Chinese brain atlas.Acknowledgements
No acknowledgement found.References
[1] Liang P, Shi L, Chen N, Luo Y, Wang X, Liu K, Mok VCT, Chu WCW, Wang D & Li K. Construction of brain atlases based on a multi-center MRI dataset of 2020 Chinese adults. Sci Rep 5; 2015.
[2] Mazziotta, J. et al. A probabilistic atlas and reference system for the human brain: international consortium for brain mapping (ICBM). Philos. Trans. R. Soc. Lond. B. Biol. Sci. 356, 1293–1322 (2001).
Figures