2479
The Correlation Between Brain Iron Overload and Microstructure Change in Gray Matter Nucleus in Parkinson' s Diseasebingbing gao1, bing wu2, liang han3, jing jing3, and yanwei miao3
1first affiliated hospital of DaLian medical univercity, Da Lian, People's Republic of China, 2GE healthcare, People's Republic of China, 3first affiliated hospital of DaLian medical univercity, People's Republic of China
Synopsis
Enhanced Gradient Echo T2 Star Weighted Angiography (ESWAN) can sensitively shows iron overload in brain, especially gray matter; Diffusion Kurtosis Imaging (DKI) detects microstructure change of gray matter much better than Diffusion Tensor Imaging (DTI). PD patients has the iron overload in substantia nigra, and encephalatrophy on different levels--cortex, basal ganglia and midbrain. To emplore the relation between iron overload and microstructure change in extrapyramidal nuclei, we compared DKI and ESWAN parameters in PD and healthy control groups, and analysis the correlation between them. Found that there are some relations in substantia nigra, red nucleus and putamen in PD patients.
Target audience: Researchers and clinicians interested
in Parkinson Disease and brain tissue microstructure.
Purpose
The
T2* map in Enhanced Gradient Echo T2 Star Weighted Angiography (ESWAN) is a
sensitive marker of iron overload in brain, especially gray matter; Diffusion
Kurtosis Imaging (DKI) may better reflect microstructure change in gray matter
than Diffusion Tensor Imaging (DTI) does 1. It has been shown that PD
patients feature iron overload in substantia nigra and red nucleus which are located
inside the midbrain, and meanwhile encephalatrophy was observed in three different
levels--cortex, basal ganglia and midbrain1. The iron overload in
substantia nigra considered as a main cause of apoptosis of dopaminergic neuron
pathologically, it impacts the release of dopamine to corpus striatum and head
of caudate nucleus which located in the basal ganglia area. To explore the
relationship between iron overload and microstructure change in the latter two
levels, we compare and correlate the parameters from DKI and ESWAN in
extrapyramidal systemic nuclei of PD patients and healthy controls to.
Methods
This prospective study was approved by the hospital
ethics committee. Thirty-five
cases of clinically confirmed PD patients were included (18 males and 17
females, mean age 67.00±8.76 years), consent forms were
obtained. Twenty-three age and gender matched healthy volunteers were recruited
as control group (12 males, 11 females, mean age 66.48±5.2 years). All subjects underwent MRI scans
including T1WI,T2WI,T2 FLAIR, DKI (TR/TE 10000/107ms;
Section Thickness : 4mm; Intersection Gap : 0mm; FOV 24×24cm2; Matrix Size 128×128) and ESWAN (TR/TE : 53/20ms;
Section Thickness : 2mm; Intersection Gap : 0mm; FOV : 24×24cm2; Matrix Size : 512×512) on a 3.0T whole body scanner.
Bilateral MK value, Ka value, Kr value, MD value, Da value, Dr value and FA
value were manually measured on the head of caudate nucleus, putamen, globus
pallidus, red nucleus and substantia nigra. The regions of interests were
defined by an experienced radiologist with reference to T1WI. The DKI and SWI
parameter values of each nucleus were compared between groups by Independent
Samples T-test. The correlation between DKI and SWI parameters of each nucleus
in PD group was calculated using Spearman Correlation.
Results and Discussion
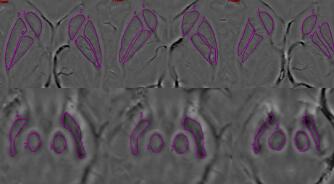
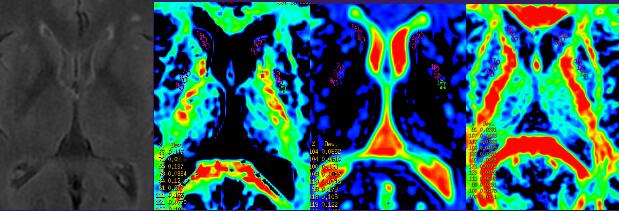
The parameters from ESWAN and DKI of a typical PD
patient are shown in Fig.1. The
correlation between DKI parameters (Kr, Da, FA) and ESWAN parameters are shown
in Fig.2. Compared to
the HC group, MK value
in substantia nigra of PD patients significantly decreased while markedly
increased in globus pallidus; Ka value decreased in red nucleus, substantia
nigra; Kr value decreased in puteman and red nucleus while increased in globus
pallidus and substantia nigra. MD value significantly increased in putamen,
globus pallidus, red nucleus and substantia nigra; Da value increased inglobus
pallidus, red nucleus and substantia nigra; Dr value increased in inglobus
pallidus and substantia nigra. FA
value in PD group significantly decreased in putamen while increased in globus
pallidus and red nucleus. The Phase value decreased in substantia nigra, red nucleus,
globus pallidus and the head of caudate nuclei while increased in putamen(all P<0.05).
Positive correlation
was found between the Phase and Kr value in substantia nigra (r=0.349, P=0.030)
and the Phase and Da value in red nucleus (r=0.414, P=0.009); meanwhile,
negative correlation was found between the Phase and FA value in left putamen.
These suggest that iron overload in gray matters, especially the substantia
nigra lead to microstructure change, due to neuron apoptosis and demyelination,
and then the microstructure change, may inversely add iron overload.
Discussion and conclusion
In
this study, correlations of ESWAN and DKI derived parameters were observed in substantia
nigra, red nucleus and putamen in PD patients. It indicates there is connection
between the known iron overload and micro-structure changes. This observation
may provide further insight of the pathological progression of Parkinson
disease.
Acknowledgements
No acknowledgement found.References
1. Gorell JMet al.Neurology 1995; [2]. Cho ZHet al. Mov Disord2011.Figures
parameters from ESWAN
parameters from DKI
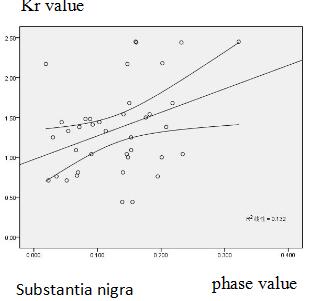
The correlation
between DKI parameters (Kr) and ESWAN parameters
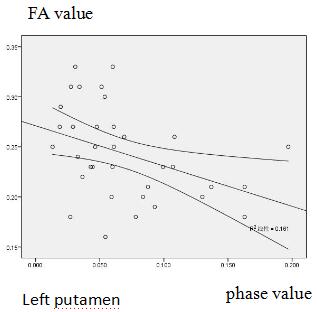
The correlation
between DKI parameters (FA) and ESWAN parameters