2472
Quantifying nigral alterations in Parkinson's disease using neuromelanin and diffusion tensor imaging1Radiology, Osaka University Graduate School of Medicine, Suita, Japan, 2Neurology, Osaka University Graduate School of Medicine, Suita, Japan
Synopsis
Dopaminergic neurodegeneration of the substantia nigra pars compacta (SNpc) in Parkinson's disease (PD) was evaluated quantitatively using both neuromelanin and diffusion tensor imaging. For the highly reproducible image analysis of the SNpc, an automatic region-of-interest selection method was developed with a voxel-based morphometric technique. Neuromelanin which can directly quantify dopaminergic neurodegeneration and mean diffusivity could differentiate PD patients from healthy controls and were correlated with each other. We conclude that a voxel-based evaluation using both neuromelanin and diffusion tensor imaging can reveal PD related neurodegenerative changes in the SNpc and may be a useful technique for quantitative diagnosis of PD.
PURPOSE:
Our aim was to assess the neurodegenerative changes of the substantia nigra pars compacta (SNpc) using both neuromelanin and diffusion tensor imaging and to investigate the clinical usefulness of these imaging in the diagnosis of Parkinson's disease (PD) and in evaluation of PD progression.
METHODS:
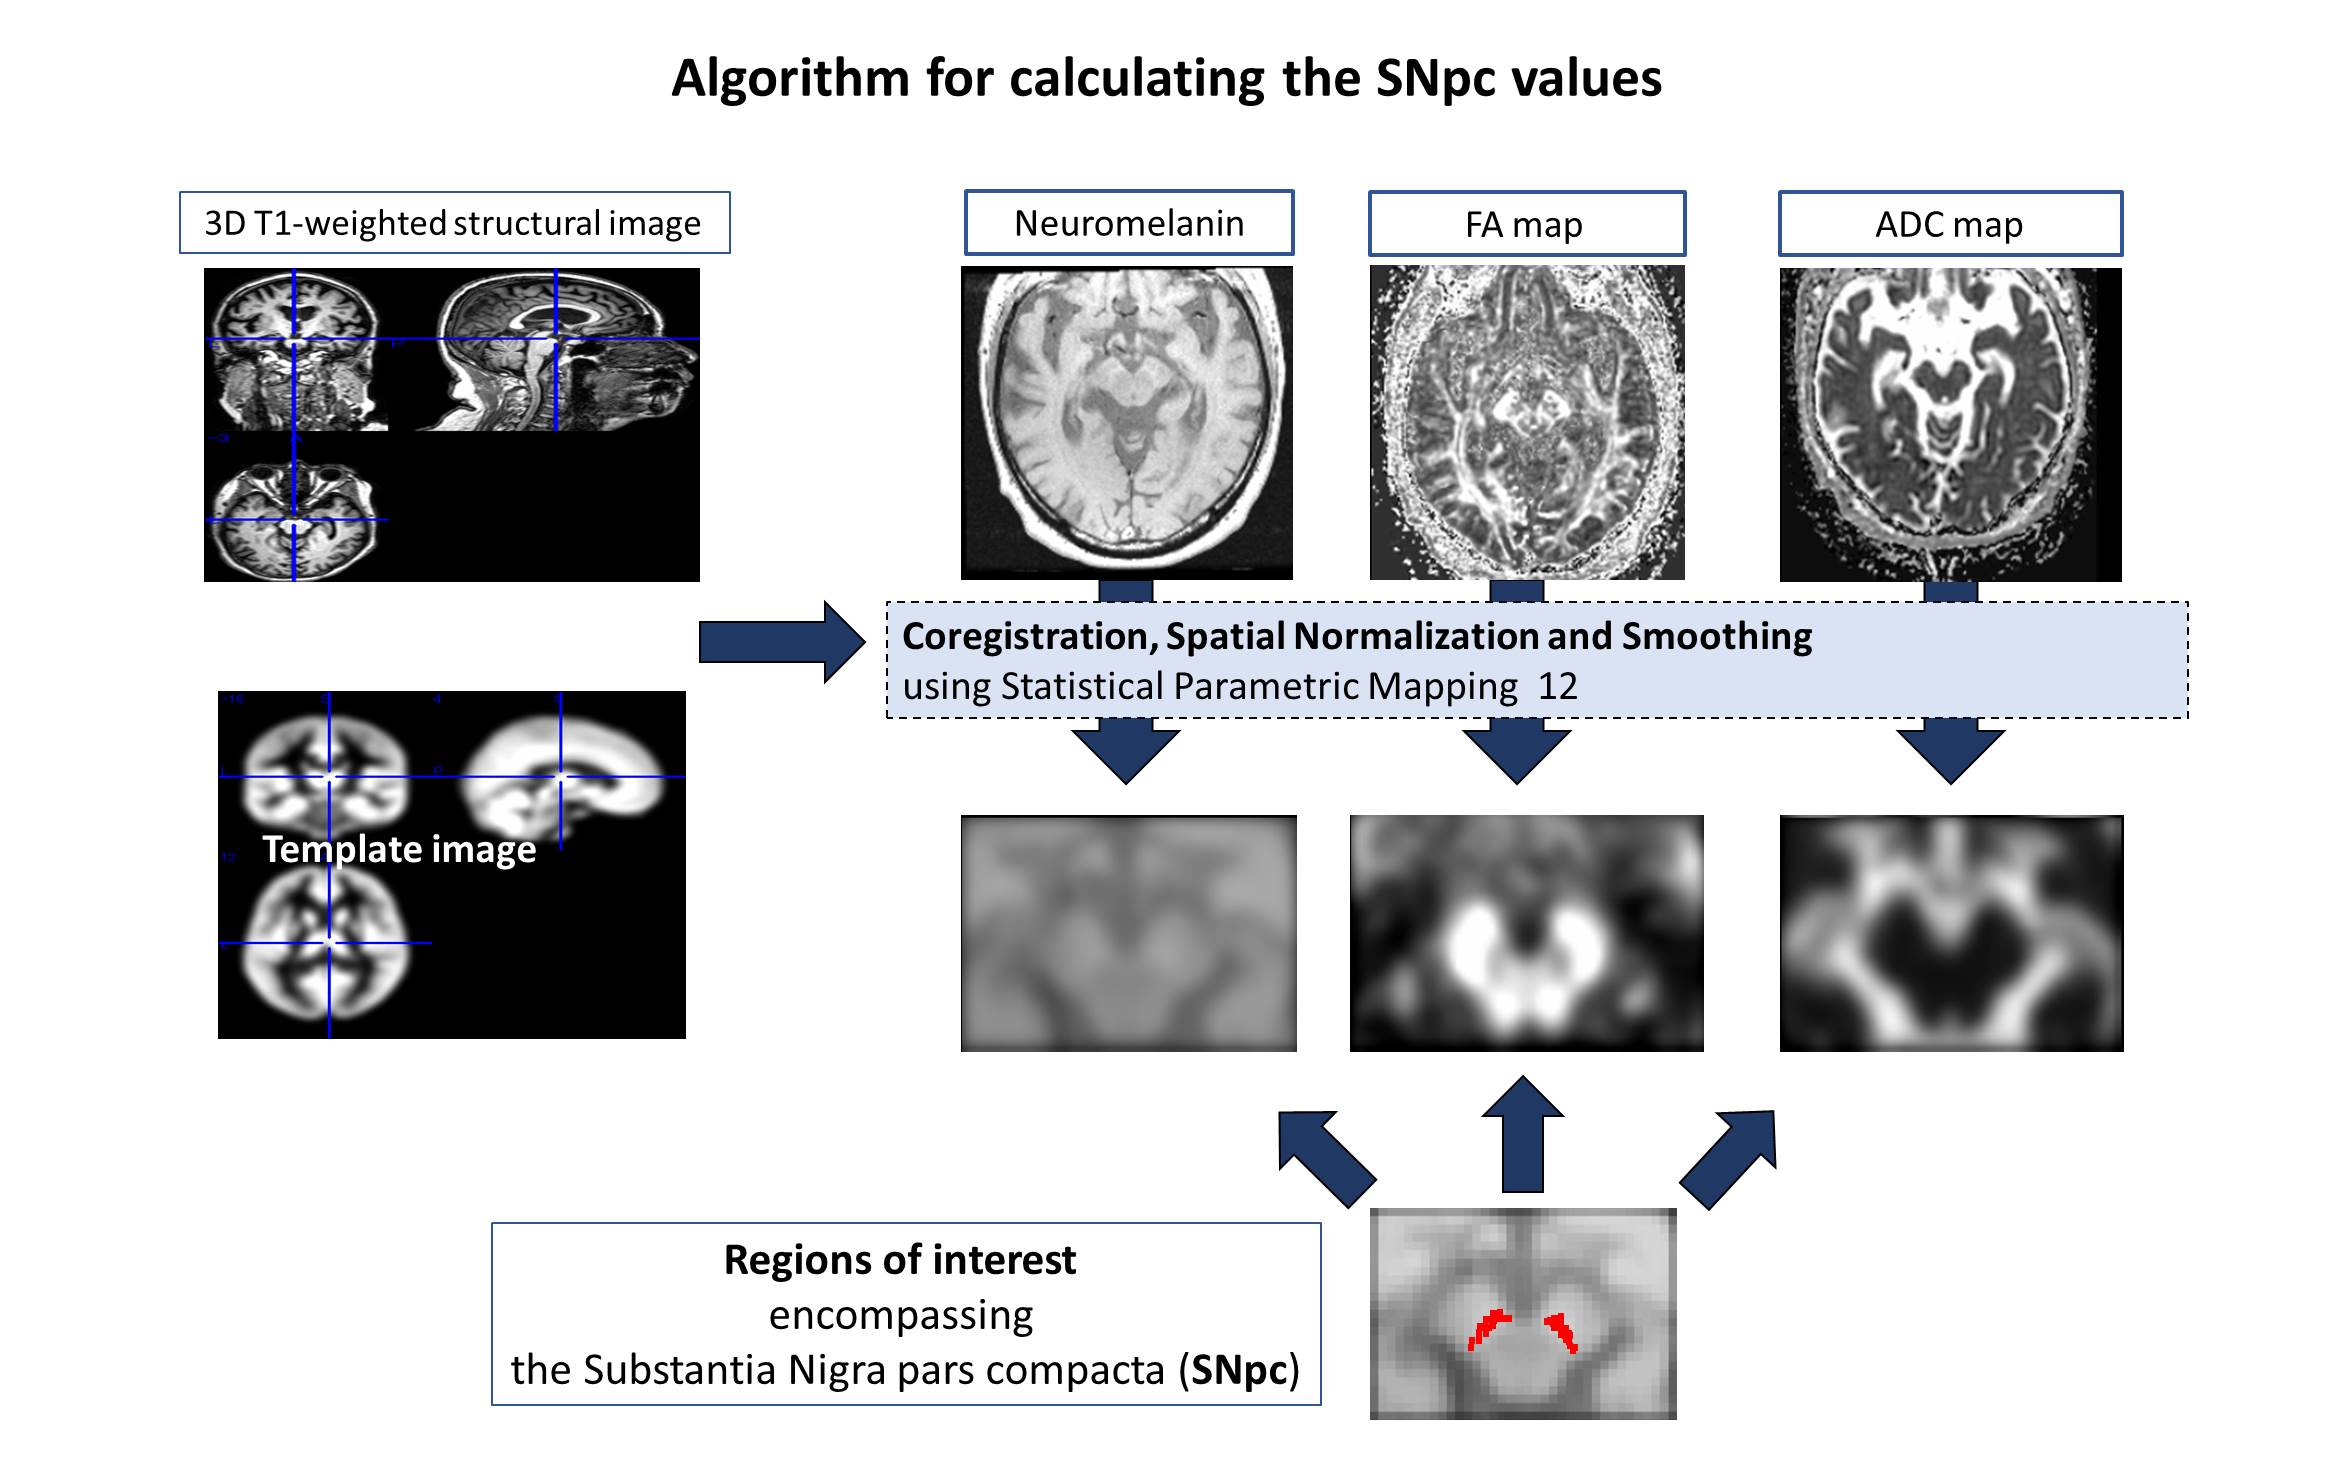
Our institutional review board approved this study, and all subjects provided prior written informed consent. This prospective study included data from 35 patients (PD group) diagnosed with PD. The numbers of patients with Hoehn–Yahr (HY) scale 1, 2, 3, 4, and 5 were 0, 14, 10, 11, and 0, respectively. Eighteen age-matched healthy controls (HC group) diagnosed as having no neurodegenerative disorders were included as healthy control subjects. All subjects underwent brain MR imaging with neuromelanin imaging, diffusion tensor imaging imaging and three-dimensional (3D) T1W imaging at 3T. All MR imaging data were transferred to a computer. For highly reproducible image analysis of the SNpc, an automatic volumetric region of interest (ROI) selection method was developed with the voxel-based morphometric technique. By using this method, the neuromelanin SNR (signal-to-noise rario), fractional anisotropy (FA) and mean diffusivity (MD) of the SNpc were calculated. Detailed image calculating process was described in Figure 1. The normal SNpc ROI was created based on a high-intensity area on the averaged neuromelanin images of healthy subjects. Neuromelanin is mainly expressed in dopaminergic neurons of the SNpc. The SNR of the SNpc in the neuromelanin images was calculated based on the mean value of the automatically segmented background region (tegmentum in the midbrain). The neuromelanin value was the neuromelanin volume with an SNR higher than that of the background region. By using these data, the significance of intergroup differences in each SNpc value was tested using Mann-Whitney’s U test. A p < 0.05 was considered significant. Receiver operating characteristic (ROC) analysis to compare the diagnostic performance of each SNpc value was performed with the aid of SPSS version 24 (SPSS Inc., Chicago, IL, U.S.A.). In addition, the correlations between neuromelanin and diffusion values and between each SNpc value and HY scale were assessed.
RESULTS:
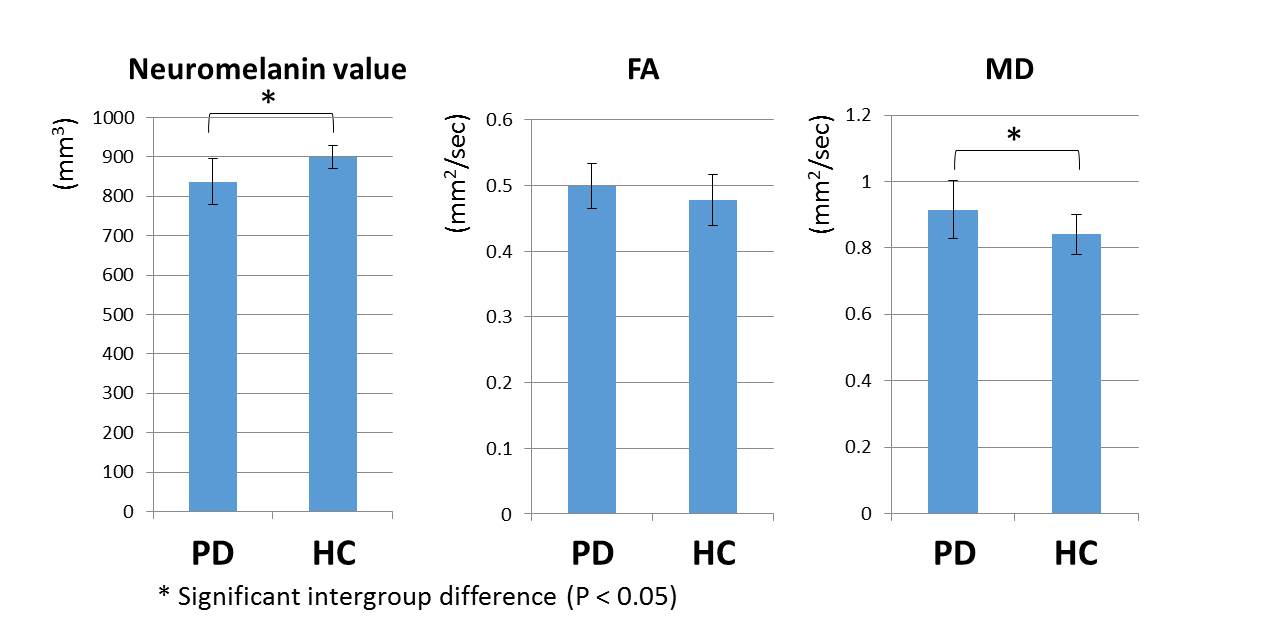
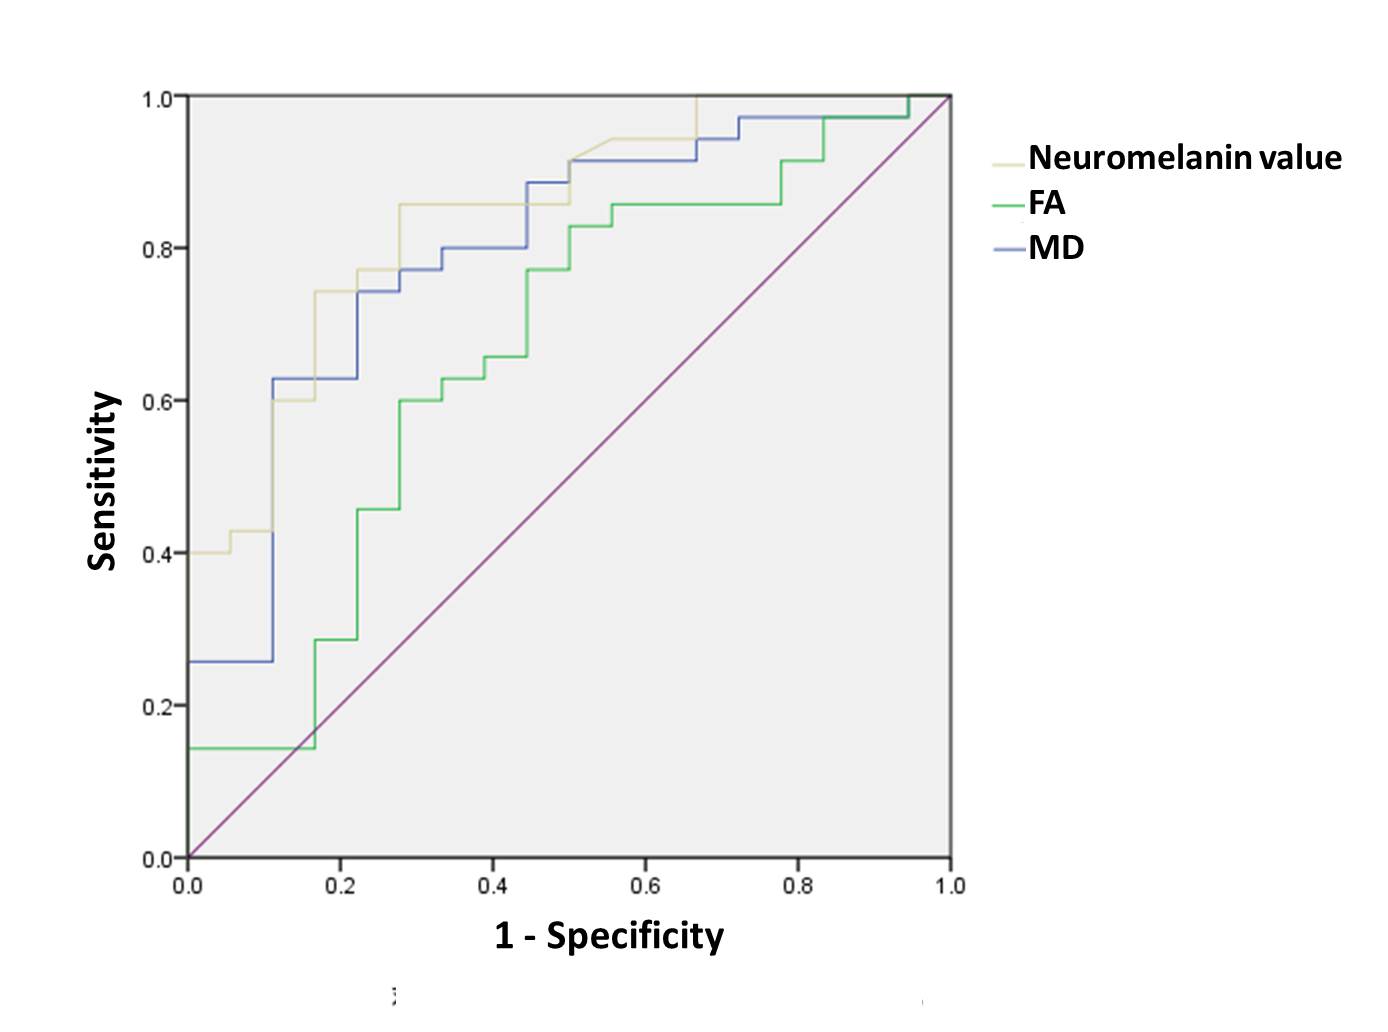
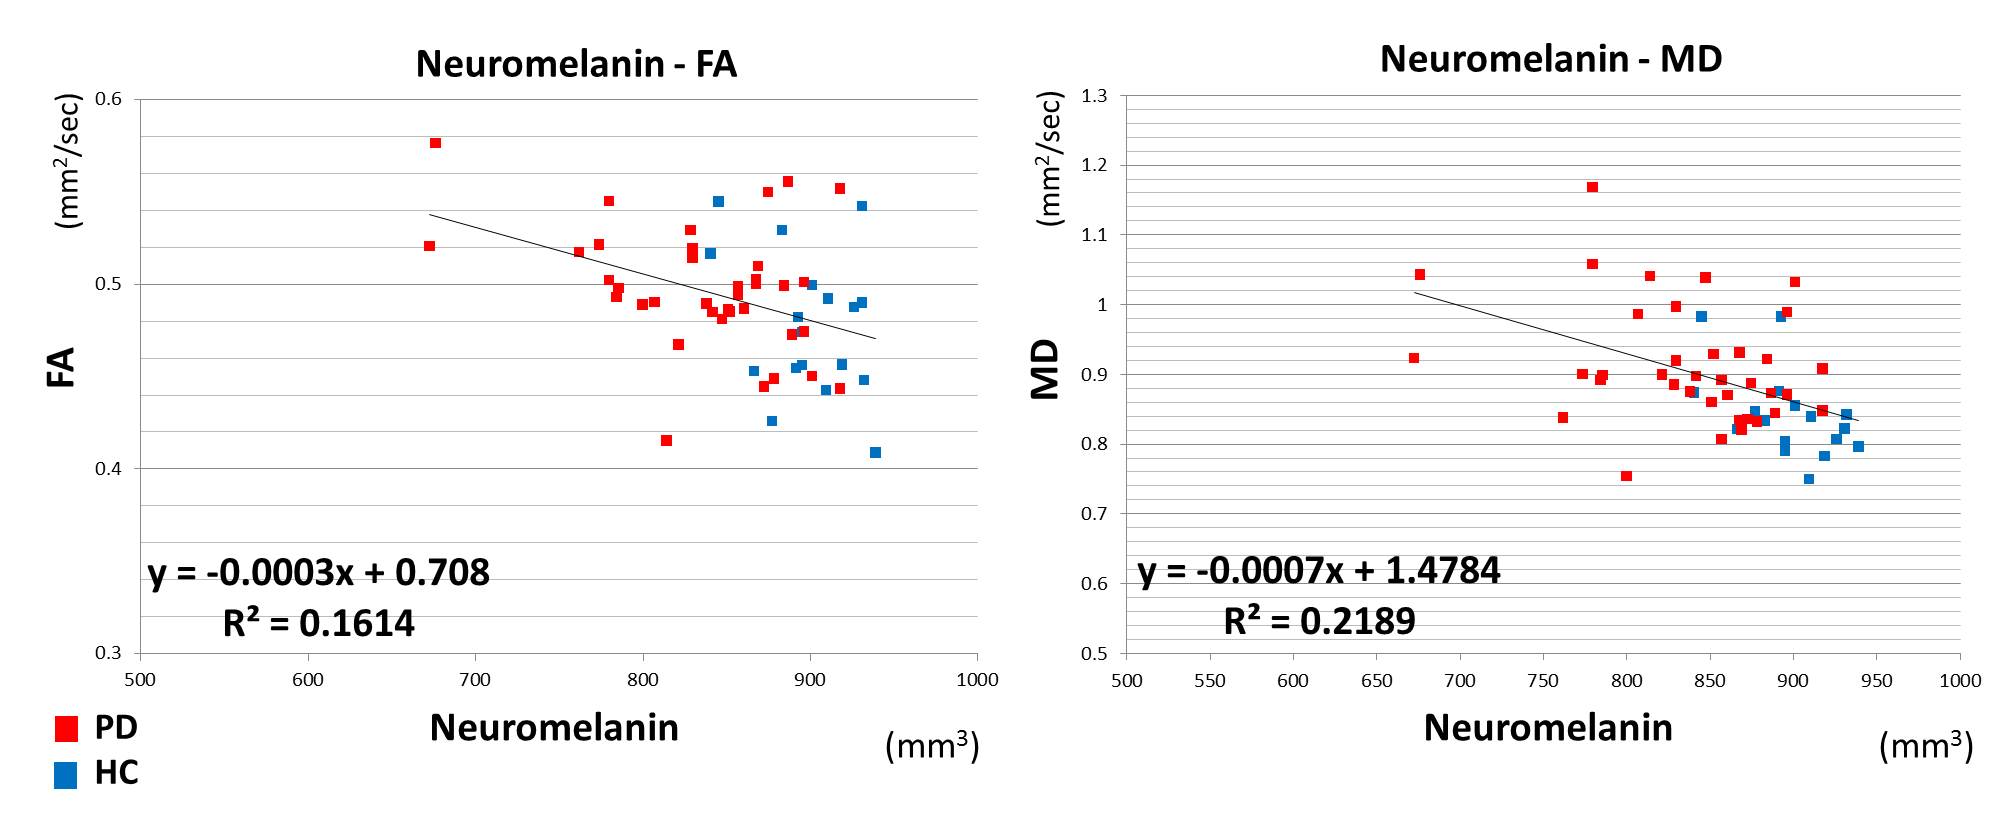
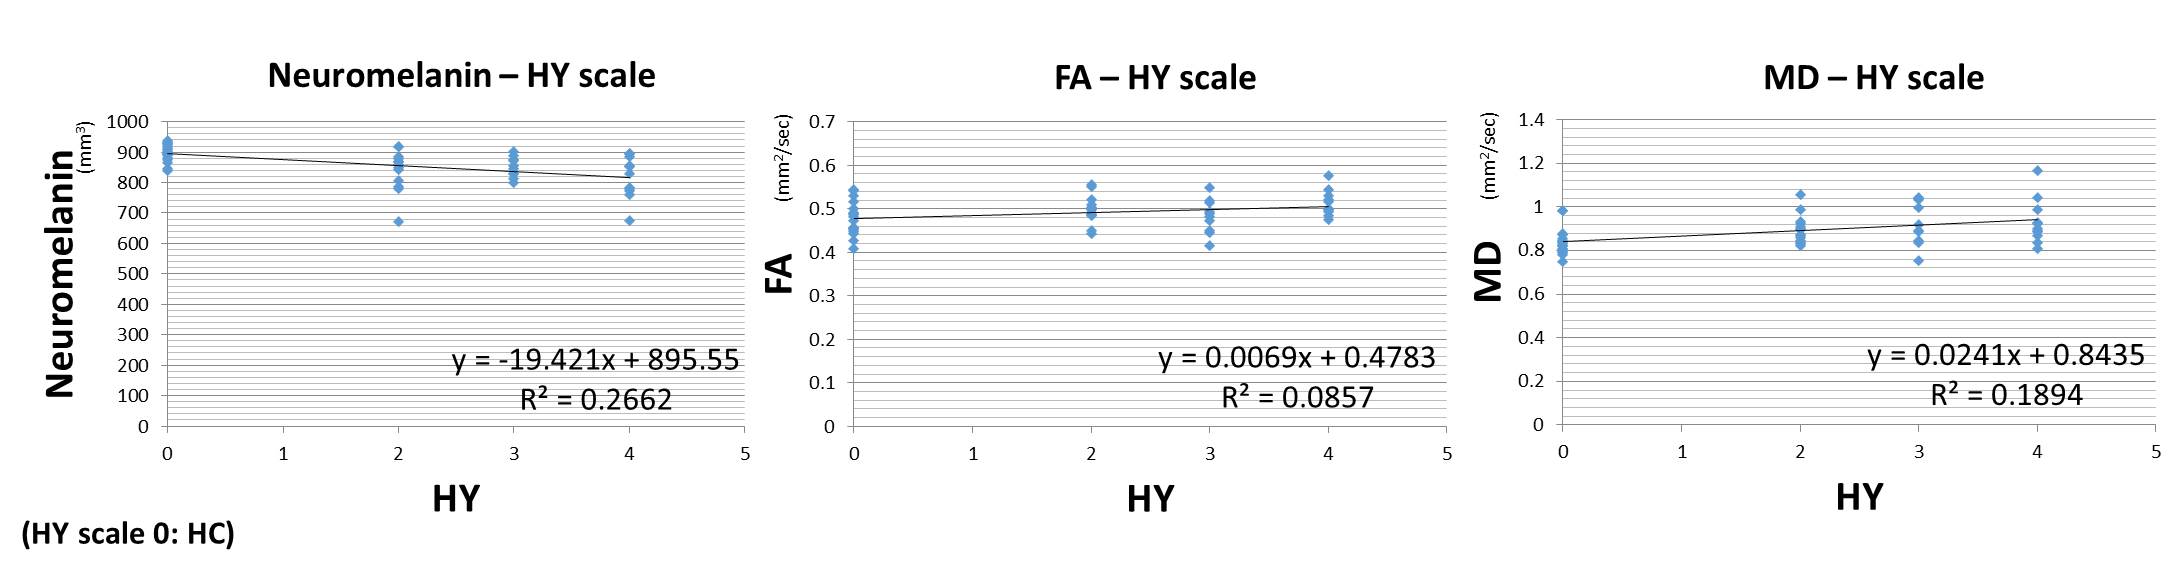
The neuromelanin value was significantly lower in PD group (837.18 ± 59.00 mm3) than in HC group (898.98 ± 29.04 mm3), while MD was significantly larger in PD group (0.92 ± 0.09 mm2/sec) than in HC group (0.84 ± 0.06 mm2/sec). For FA, no significant difference was observed between them (PD group: 0.50 ± 0.03 mm2/sec; HC group: 0.48 ± 0.04 mm2/sec). The graph showed the intergroup differences for each value (Fig. 2). The area under the ROC curve (Az [95% confidence interval]) was 0.84 for the neuromelanin value, 0.66 for FA and 0.80 for MD (Fig. 3). Only FA was significantly lower in Az value (P < 0.05). A slight correlation between neuromelanin and diffusion values was found (Fig. 4). The correlation coefficient between the neuromelanin value and MD (|r|: 0.48) was larger than the correlation coefficient between the neuromelanin value and FA (|r|: 0.40). Figure 5 showed the correlations between each SNpc value and HY scale. Slight correlations between neuromelanin value and HY scale (|r|: 0.51) and between MD and HY scale (|r|: 0.44) were found. FA and HY scale were hardly correlated (|r|: 0.29).
DISCUSSION:
PD is characterized pathologically by dopaminergic neurodegeneration in the SNpc. Neuromelanin imaging can directly quantify loss of dopaminergic neurons. Previous neuromelanin imaging studies have reported significant reductions in measures of volume of the total SNpc,1, 2 and one of them indicated its clinical application in the diagnosis of early PD stages,2 which is consistent with our results. In the present study, MD in the SNpc significantly increased in PD patients relative to healthy controls, which is consistent with the results of a previous study3 and can also indicate its clinical application in the diagnosis of PD. Increases in MD reflect microscopic barrier disruption and extracellular fluid accumulation,4 which may be indirectly correlated with dopaminergic neurodegeneration in the SNpc. Therefore, the relation between neuromelanin value and MD in our result may reveal PD-related pathogenesis. In contrast, the graph shows that both neuromelanin value and MD are hardly useful in evaluation of PD progression. FA in the SNpc is not a biomarker for PD evaluations, as previously reported.5
CONCLUSION:
A voxel-based evaluation using both neuromelanin and diffusion tensor imaging can reveal PD related neurodegenerative changes in the SNpc and may be a useful technique for quantitative diagnosis of PD.
Acknowledgements
No acknowledgement found.References
1. Ogisu K, Kudo K, Sasaki M, et al. 3D neuromelanin-sensitive magnetic resonance imaging with semi-automated volume measurement of the substantia nigra pars compacta for diagnosis of Parkinson's disease. Neuroradiology. 2013;55(6):719-724.
2. Ohtsuka C, Sasaki M, Konno K, et al. Changes in substantia nigra and locus coeruleus in patients with early-stage Parkinson's disease using neuromelanin-sensitive MR imaging. Neurosci Lett. 2013;541:93-98.
3. Kamagata K, Hatano T, Okuzumi A, et al. Neurite orientation dispersion and density imaging in the substantia nigra in idiopathic Parkinson disease. Eur Radiol. 2016;26(8):2567-2577.
4. Abe O, Aoki S, Hayashi N et al. Normal aging in the central nervous system: quantitative MR diffusion-tensor analysis. Neurobiol Aging. 2002;23(3):433–441.
5. Hirata FC, Sato JR, Vieira G, et al. Substantia nigra fractional anisotropy is not a diagnostic biomarker of Parkinson's disease: A diagnostic performance study and meta-analysis. Eur Radiol. 2016;5. [Epub ahead of print]
Figures