2471
Analysis of the Substantia Nigra from Parkinson’s disease patients and control subjects using co-registered DTI and QSM data1Medical Imaging, The Ottawa Hospital, Ottawa, ON, Canada, 2Radiology, University of Ottawa, Ottawa, ON, Canada, 3King Saud University, Riyadh, Saudi Arabia, 4Parkinson’s Disease and Movement Disorders Center, The Ottawa Hospital Research Institute, Ottawa, ON, Canada, 5Department of Medicine, University of Ottawa, Ottawa, ON, Canada
Synopsis
Different quantitative MRI techniques like Diffusion Tensor Imaging (DTI) and Quantitative Susceptibility Imaging (QSM) have been used to evaluate the substantia nigra (SN) in patients with Parkinson’s disease (PD). When multimodal MRI studies are applied to acquire several quantitative parameters the analysis of each of these datasets on an individual ROI basis can time consuming. In this study we are using a co-registration approach to a standard brain template for evaluating quantitative MR data (from DTI and QSM) in the SN of PD patients and controls.
Introduction
Parkinson’s disease (PD) is a neurodegenerative disorder characterized by rigidity, bradykinesia and tremor1. Pathologically, the disease process involves dopaminergic cell loss in the substantia nigra (SN) with the accumulation of iron even before the onset of PD motor symptoms. Different promising quantitative MRI techniques have been used to evaluate early changes in the SN, two of those are diffusion tensor imaging (DTI) and quantitative susceptibility imaging (QSM)2,3. The quantitative data which can be derived from these two types acquisitions (susceptibility, R2*, fractional anisotropy (FA), mean-, axial and radial diffusivity (MD, AD, RD)) requires intense post-processing work, if brain regions are evaluated in all datasets on an individual ROI basis. In this study, we co-registered data from QSM- and DTI acquisitions to a reference brain template (MNI152) and evaluated quantitative changes in SN of PD patients and controls based on ROIs from one to the multiple co-registered dataset.Methods
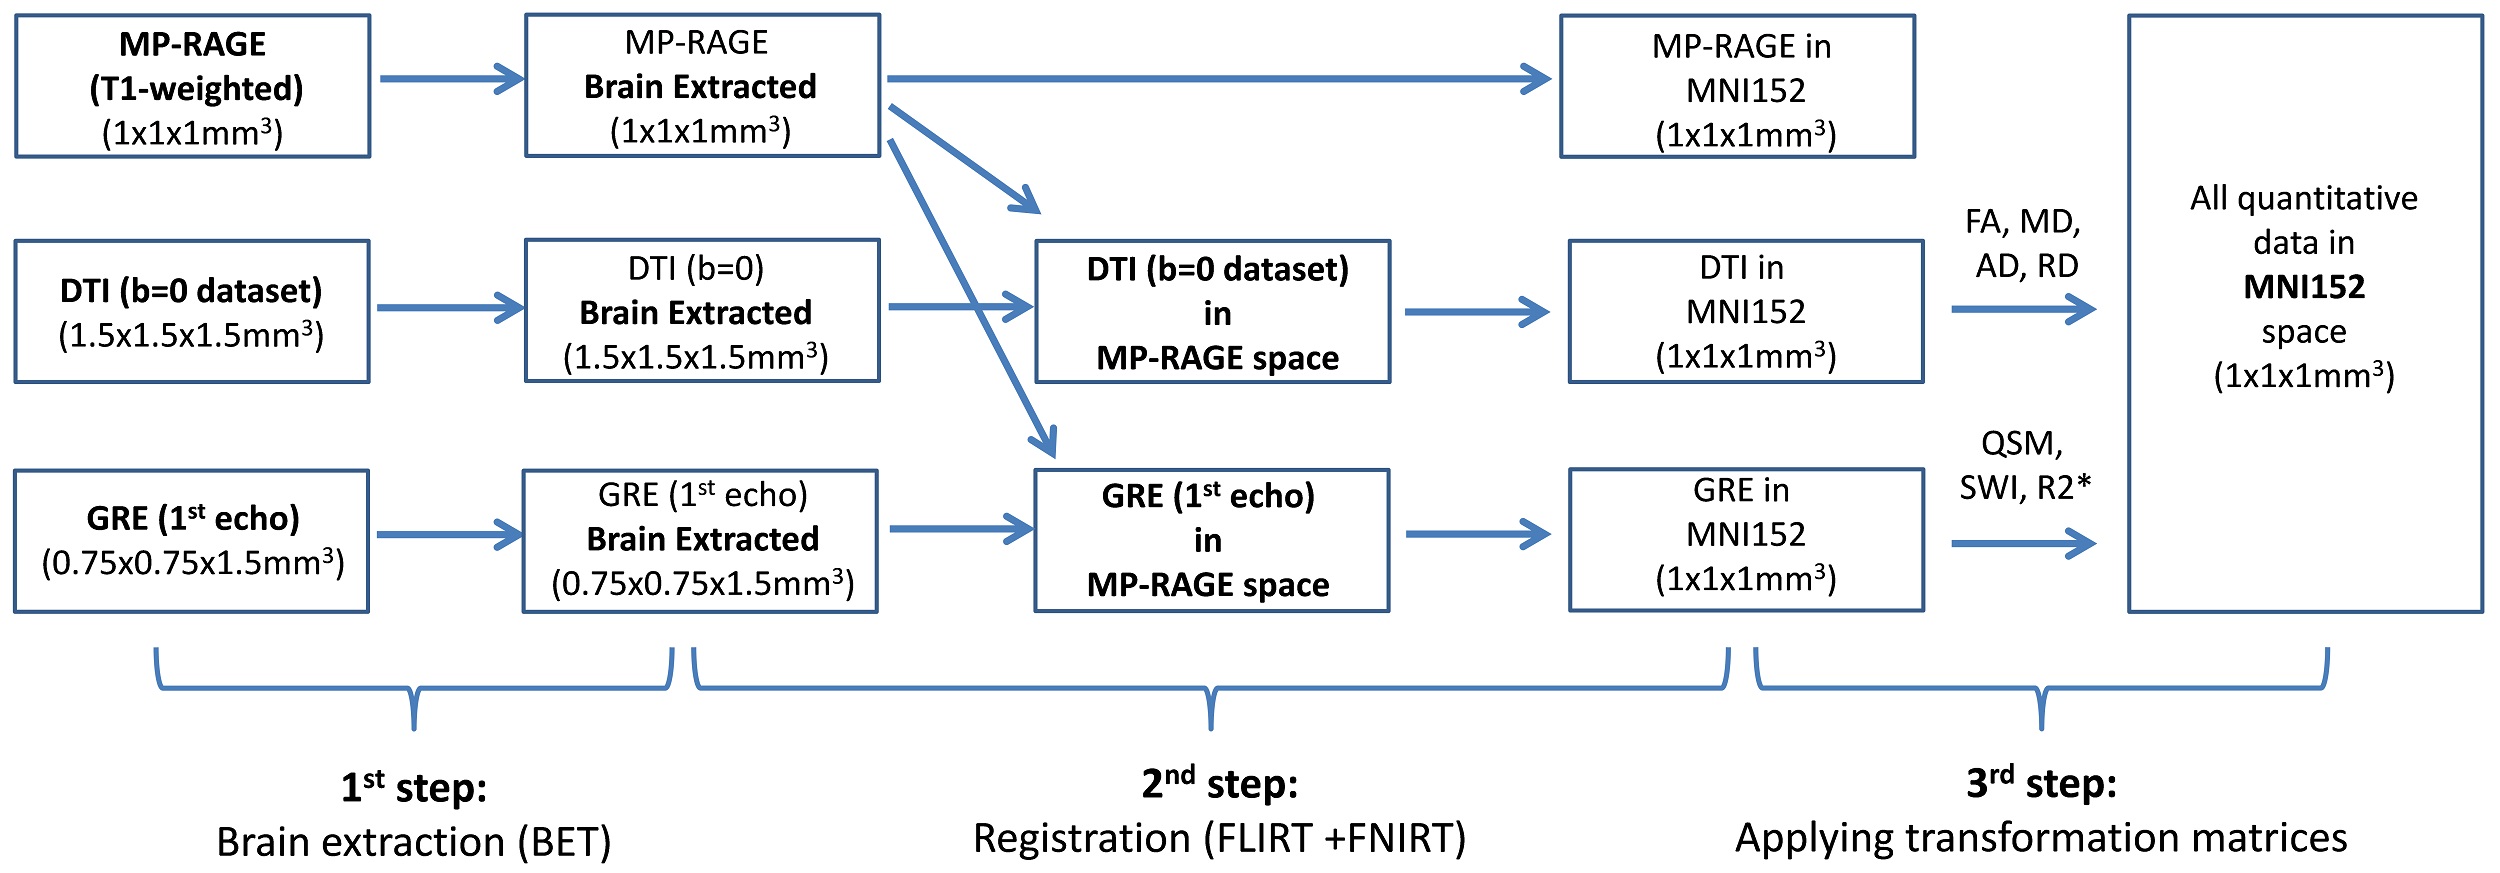
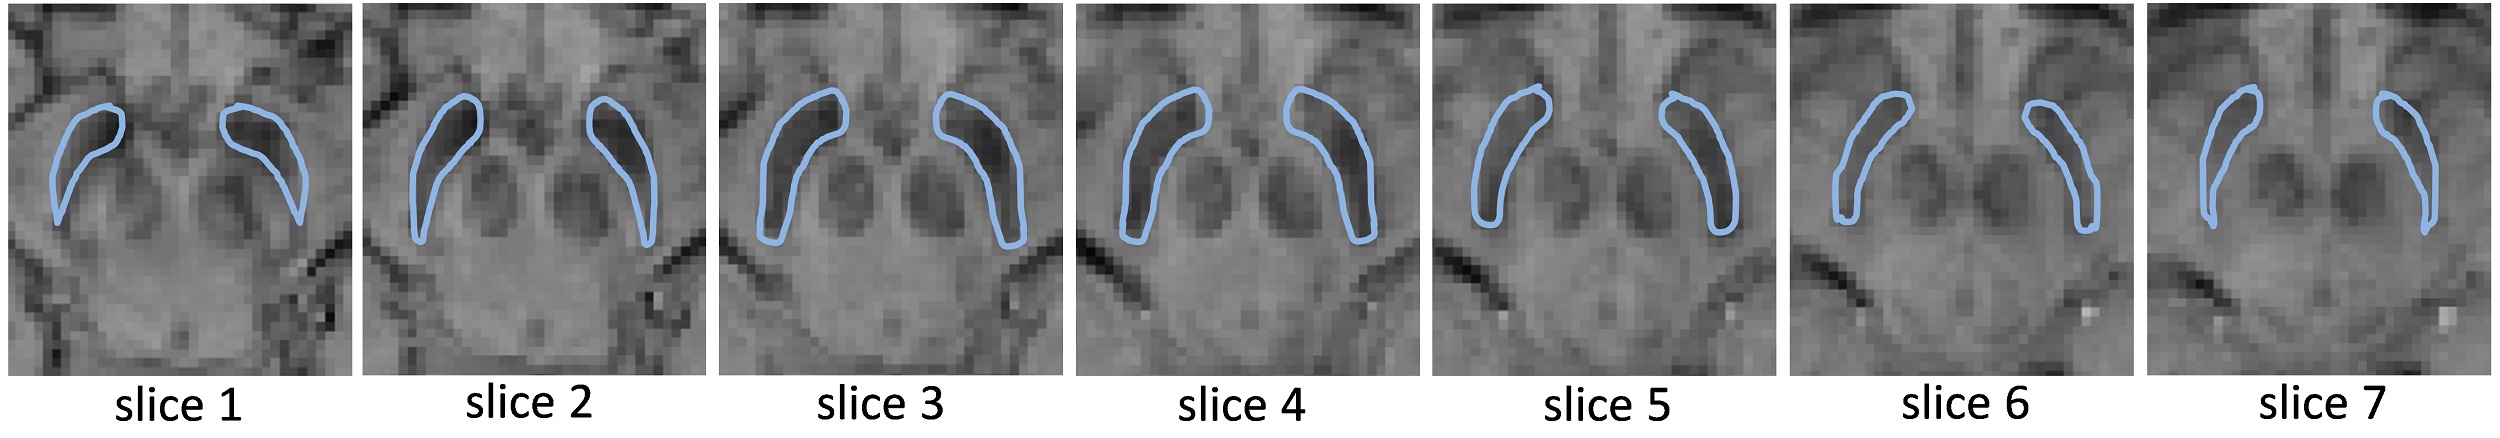
10 idiopathic PD patients with less than 2 years of symptom duration and 10 healthy age- and sex-matched controls were recruited for the study and scanned at 3T (Siemens). For co-registration purposes, an isotropic MP-RAGE dataset was acquired with the following parameters: TR/TE/TI=1900/2.8/900ms, FOV=19x19x17.5cm3, matrix=190x190x175, resolution=1x1x1mm3. For SWI, R2* and QSM data acquisition a flow compensated 3D multi-GRE sequence was used (TR=44ms, TEs = 4.6,11.2,18.0,24.8,31.6,38.4ms, FOV=20x20cm2, matrix=256x256, resolution=0.75x0.75mm2, slice=1 .5mm, 80 slices). SWI and R2* datasets were calculated with routines written in MATLAB. QSM was reconstructed using the V-SHARP4 algorithm for background field removal and the iLSQR5 method for susceptibility quantification. For DTI, a diffusion-weighted EPI sequence was applied (TR=12s, TE=98ms, FOV=19.2x19.2cm2, matrix=128x128, resolution=1.5x1.5mm2, slice=1.5mm, 76 slices, 30 diffusion directions at b=1000 mm2/s, one at b=0mm2/s) and fractional anisotropy (FA) and diffusivities (mean (MD), axial (AD), radial (RD)) were processed using FSL routines (EDDY, FDT)6. The co-registration of the datasets was performed using FSL (Figure 1): In the 1st step, the brain was extracted from the MP-RAGE, the GRE (1st echo) and the DTI(b=0) datasets. In the 2nd step, the FLIRT and FNIRT software packages6 were used to register the MP-RAGE dataset to the MNI152 space. The GRE as well as the DTI(b=0) datasets were first registered to the MP-RAGE dataset and then to the MNI152 space. In the 3rd step, the transformation matrices were applied to co-register the quantitative data into MNI152 space. SN ROIs were drawn on seven axial slices (=7mm) (Figure 2) of the SWI dataset and the ROI mask was used to derive values from the different quantitative datasets. The mean values from PD patients and controls were compared using a two-tailed t-test.Results
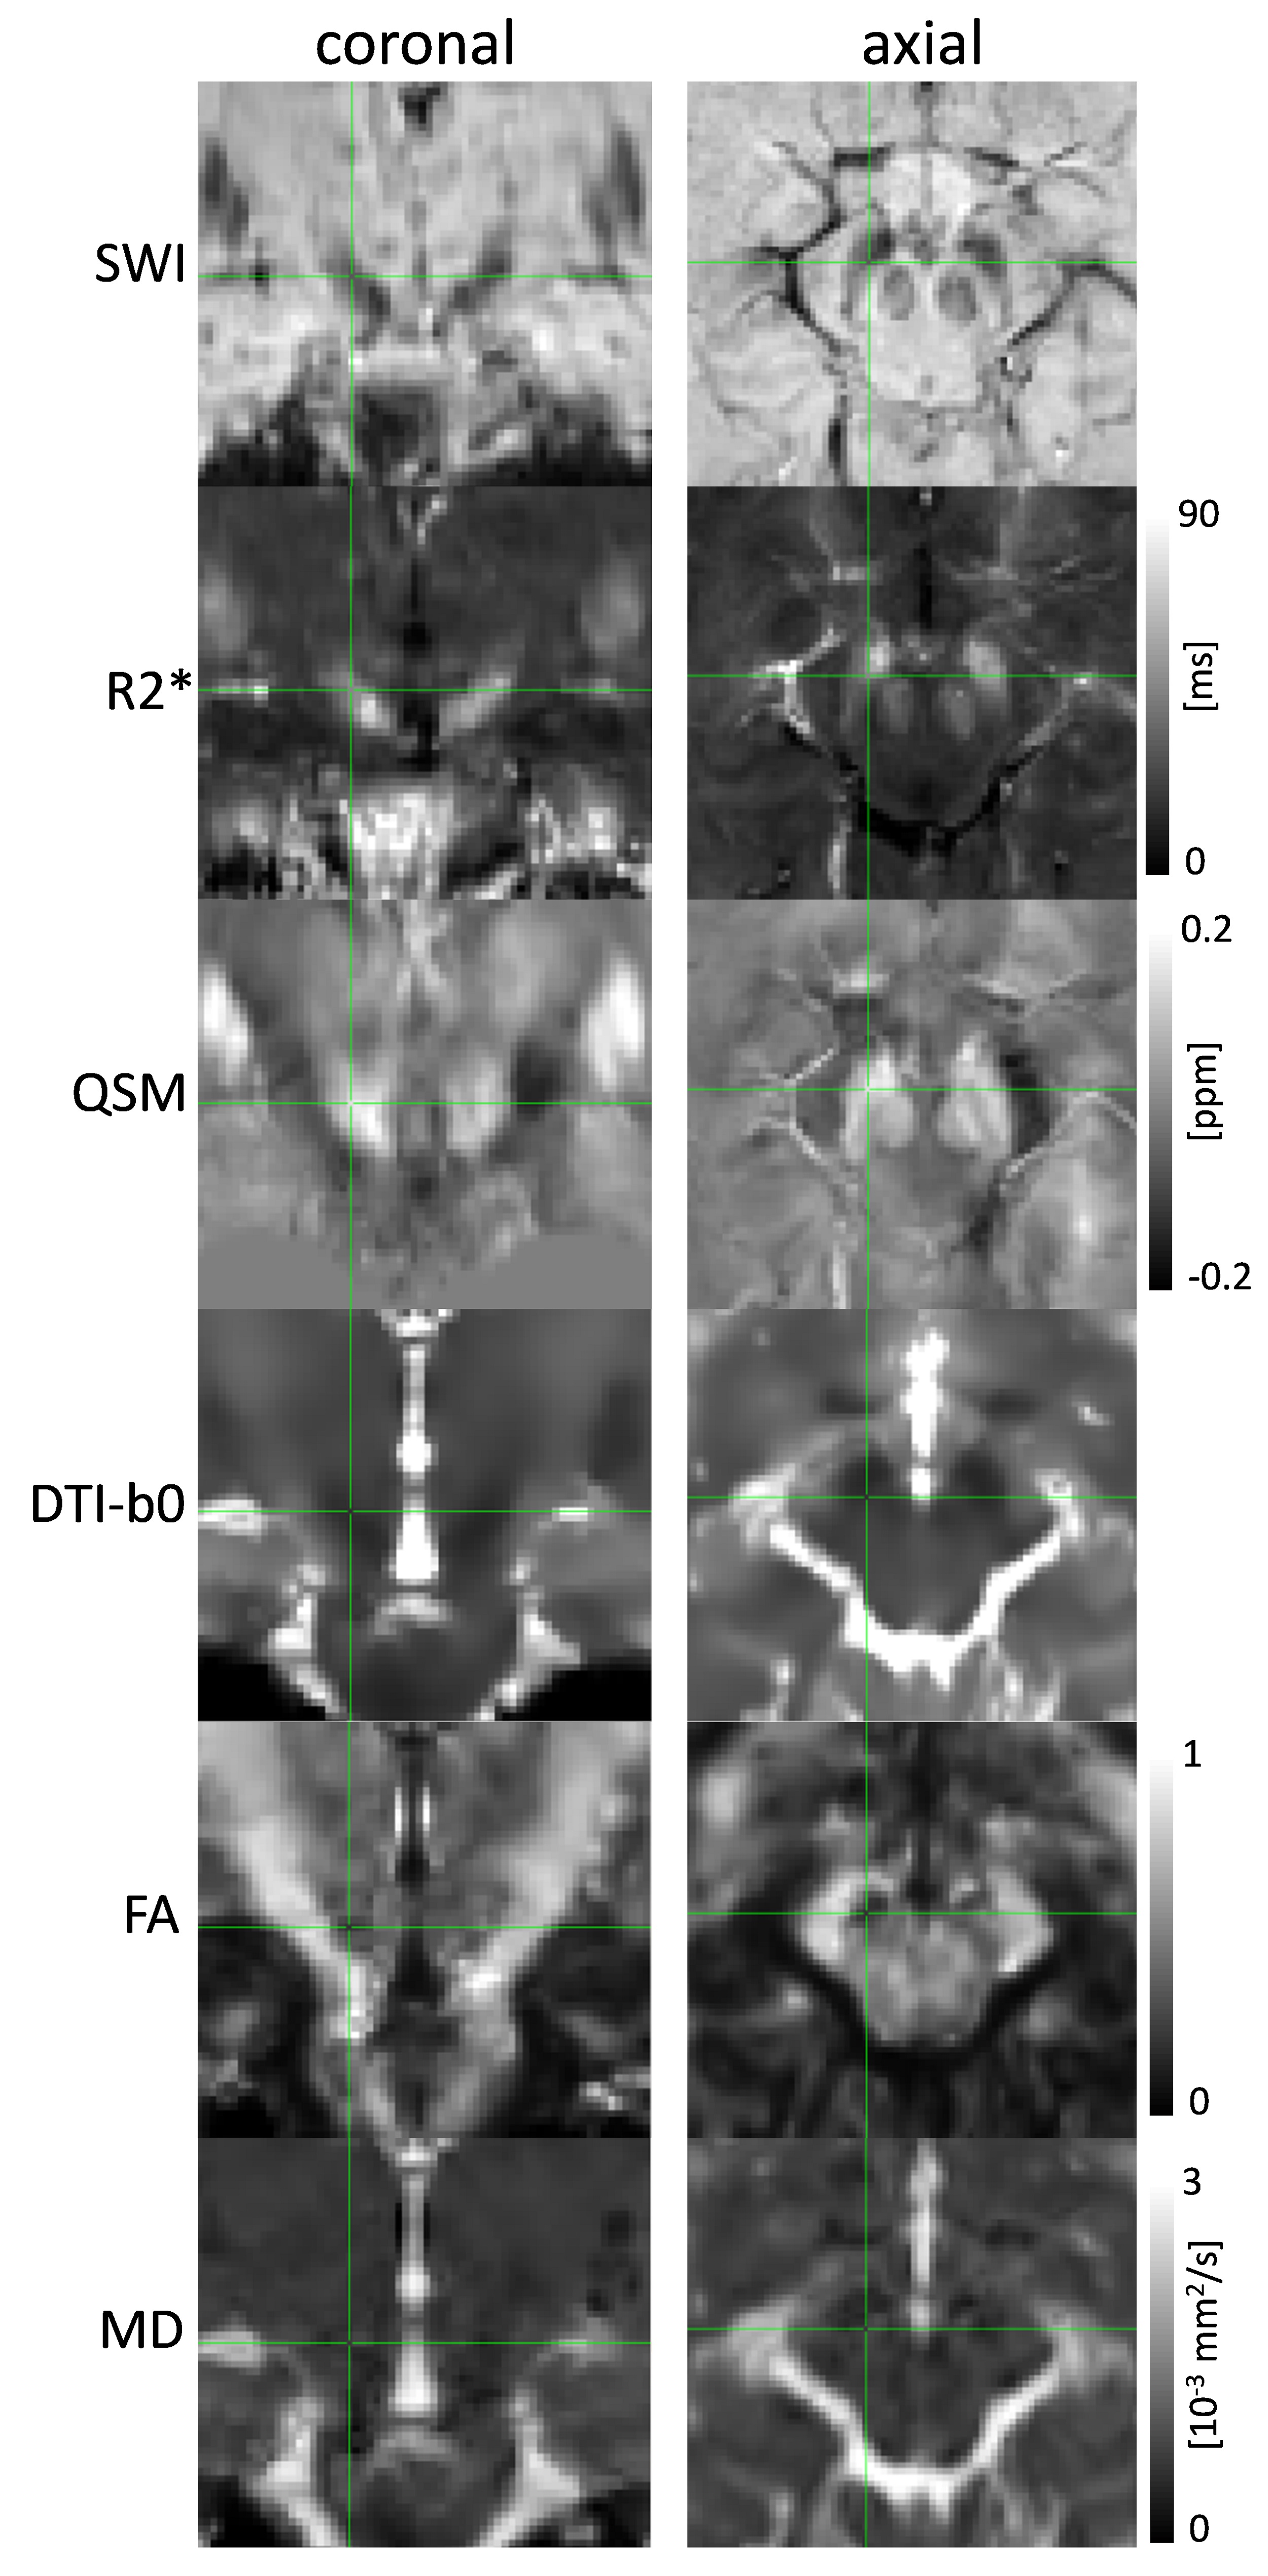
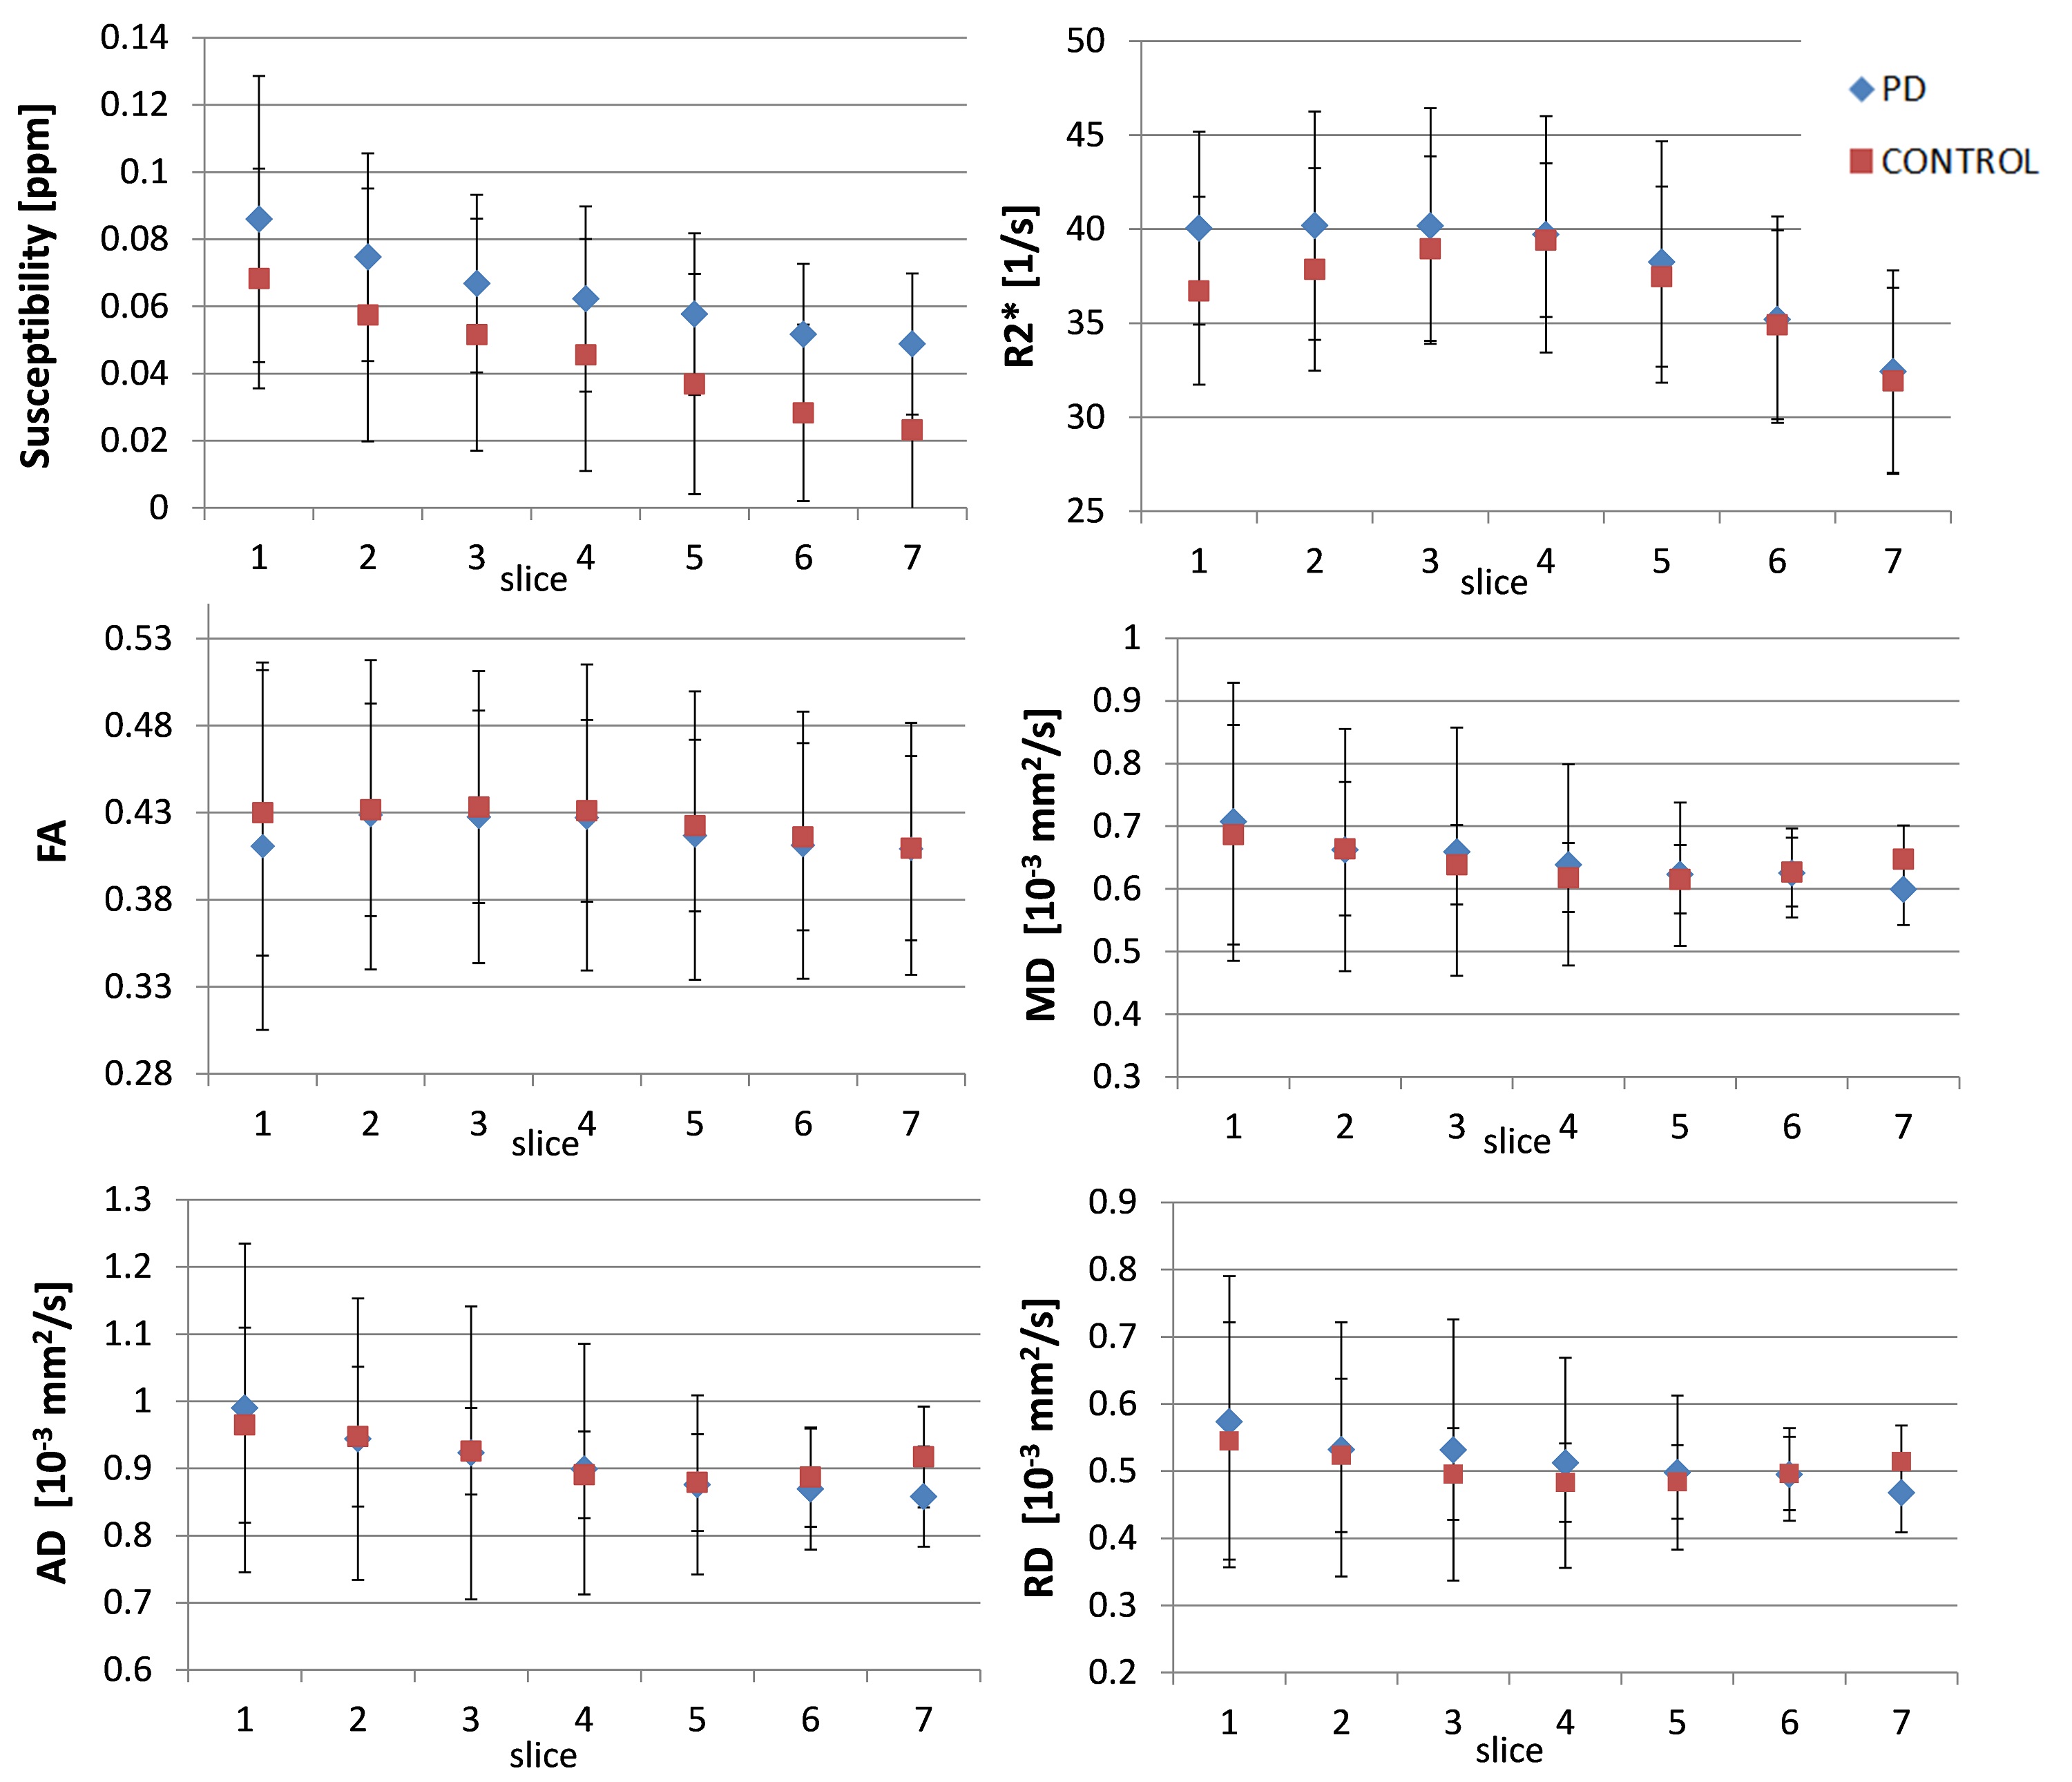
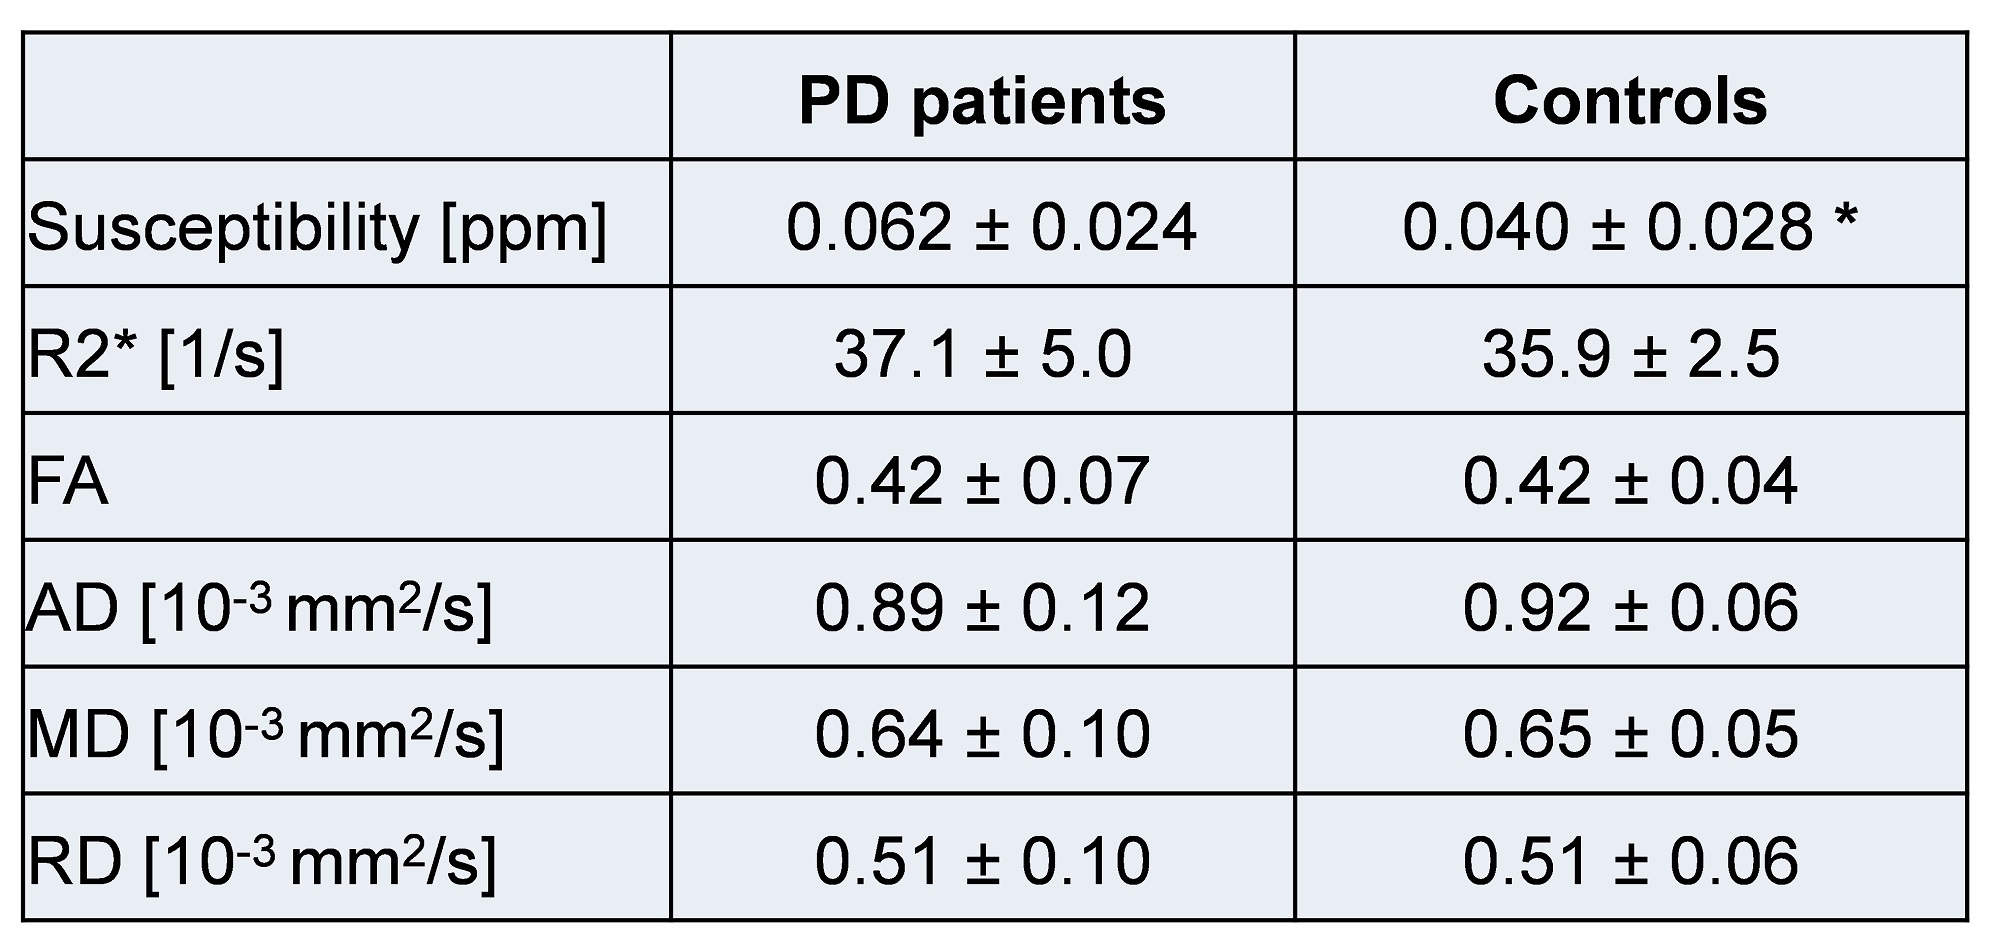
Figure 3 shows an example of the different co-registered datasets in the MNI152 space. The successful co-registration between DTI and GRE/QSM derived data can especially be seen when the SWI dataset is compared to the DTI-b0 dataset. On both datasets the SN appears as a hypo-intense structure due to their sensitivity to T2*/T2. Figure 4 summarized results for the different SN slices between the PD patients and the control group. Significant difference was found for susceptibility (p<0.1) (Table 1). For PD patients and controls the susceptibility is decreasing towards superior slices (from slice 1 to slice 7). R2* and the quantitative data derived from the DTI dataset did not results in significant differences between the two groups (p>0.1).Discussion
We evaluated quantitative MR data (susceptibility, R2*, MD, AD, RD) from the SN of idiopathic PD patients with less than 2 years of symptom duration and healthy controls using a co-registration approach. The different imaging modalities on their own were evaluated for the SN of PD patients and controls before1,2,7 and the outcomes of our small study confirm these results. Our data also suggest a greater sensitivity for susceptibility to distinguish between PD patients and controls than from DTI parameters – based from data acquired in the same imaging session. The applied co-registration process pipeline can help to process quantitative MR brain data in standardized and faster approach than drawing ROIs for every applied imaging modality individually.Conclusion
This study gives preliminary data on the role of co-registration process to help to evaluate larger amounts of quantitative data from different MR modalities and overcomes greater difficulties in delimiting regions of interest in different image sequences. The study could confirm a significant difference for the SN susceptibility between PD patients and controls, while the other quantitative parameters did not show significantly differences.Acknowledgements
No acknowledgement found.References
1. Gelb DJ, Oliver E, Gilman S. Diagnostic criteria for parkinson disease. Arch Neurol. 1999;56(1):33-9.
2. Lotfipour AK, Wharton S, Schwarz ST, Gontu V, Schäfer A, Peters AM, Bowtell RW, Auer DP, Gowland PA, Bajaj NP. High resolution magnetic susceptibility mapping of the substantia nigra in Parkinson's disease. J Magn Reson Imaging. 2012;35(1):48-55.
3. Aquino D, Contarino V, Albanese A, Minati L, Farina L, Grisoli M, Romita L, Elia AE, Bruzzone MG, Chiapparini L. Substantia nigra in Parkinson's disease: a multimodal MRI comparison between early and advanced stages of the disease. Neurol Sci. 2014;35(5):753-8.
4. Wu B, Li W, Guidon A, et al. Whole brain susceptibility mapping using compressed sensing. Magn Reson Med. 2012;67(1):137-47.
5. Li W, Avram AV, Wu B, et al. Integrated Laplacian-based phase unwrapping and background phase removal for quantitative susceptibility mapping. NMR Biomed. 2014;27(2):219-27.
6. http://fsl.fmrib.ox.ac.uk/fsl/fslwiki/FSL
7. Menke RA, Scholz J, Miller KL, Deoni S, Jbabdi S, Matthews PM, Zarei M. MRI characteristics of the substantia nigra in Parkinson's disease: a combined quantitative T1 and DTI study. Neuroimage. 2009;47(2):435-41.
Figures