2470
Predictive markers for Parkinson’s disease: A DTI based pattern classification study1Electronics And Telecommunication, Symbiosis Institute Of Technology, Pune, India, 2Department Of Neurology, NIMHANS, India
Synopsis
This work presents a paradigm for predicting changes in pathology, supporting diagnosis and providing a potential biomarker for Parkinson’s disease. This is achieved by creating a high-dimensional support vector machine (SVM) based classifier that learns the underlying pattern of pathology using numerous atlas-based regional features extracted from Diffusion Tensor Imaging (DTI) data. For the dataset of 72 controls and 73 PD patients, we achieve a 10-fold cross validation accuracy of 72.8% and a testing accuracy of 78.5%. The top discriminative features included widespread patterns of mean diffusivity changes in PD.
Background and Objective
Diffusion MRI provides in vivo micro-structural measures of the brain, and has emerged as a promising tool for differentiating Parkinson’s disease (PD) from controls.1 However, to this date, majority of the work to classify PD has been carried out by analyzing hypothesized regions of the basal ganglia.2 Clinically, PD is not limited to motor deficiencies but also presents non-motor symptoms such as depression, psychosis, olfactory dysfunction and cognitive impairment.3,4 Taking into account such multisystemic changes that may not be detected by individual analysis, we create multivariate high –dimensional classifiers based on whole brain diffusivity features, using support vector machines (SVMs) that learn patterns in the underlying pathology. The classifier provides a quantifiable score for each subject that can potentially serve as a patho-physiological marker and can reflect the extent of pathology. Furthermore, we identify key anatomic substrates (features) that provide such diagnostic utility, gaining potential neurobiological insight into the basis of the PD.Methods
Our data consisted of 72 controls (age 50.43 ± 9.9, 57 Males) and 73 PD patients (age 53.53±11.02, 59 Males) with mean UPDRS scores 18.34 ± 8.69 fulfilling the standard criteria for PD diagnosis (OFF state). All patients were screened for presence of cognitive impairment using MMSE and a score of <26 was set as an exclusion criteria. These subjects were scanned on a 3T Philips AcheivaTM scanner. DTI was performed along 15 directions with a b value = 1000 s/mm2. In addition, the images without diffusion weighting were acquired corresponding to b = 0 s/mm2. 3D T1TFE images were acquired with TR/TE = 8.1/3.7 ms and voxel size = 1 × 1 × 1 mm. The DWI preprocessing included skull stripping, motion corrected using an affine transform and noise removal using jLMMSE filter.5 The diffusion tensor (DTI) images were reconstructed using least squares approximation and were then spatially normalized to a standard atlas that included 176 labeled ROIs.6,7 Mean diffusivity (MD) images were computed and the average of MD in each of the ROIs was used as the input feature set. Out of 145 subjects, 131 (65 controls, 66 patients) subjects were randomly selected for training and cross-validation while the remaining 14 subjects (7 controls and 7 patients) were used for testing. We implemented a 2 class SVM classifier using a 10-fold cross-validation where the 131 subjects were divided into 10 equal groups, 9 groups were used for training and the left-out group was used for testing the classifier. The left-out group was tested on the constructed classifier and the prediction score was recorded. By repeatedly leaving each group out we obtained an average classification rate. Feature selection was performed within each cross-validation loop which provided us with relevant features that contributed towards the classification. We use a feature filtering method called signal-to-noise (s2n) ratio coefficients.8 The features that were frequently selected in each of the cross-validation loops were considered as the most discriminative features. Finally, the classifier was validated by testing the 14 test subjects on the built classifier.Results
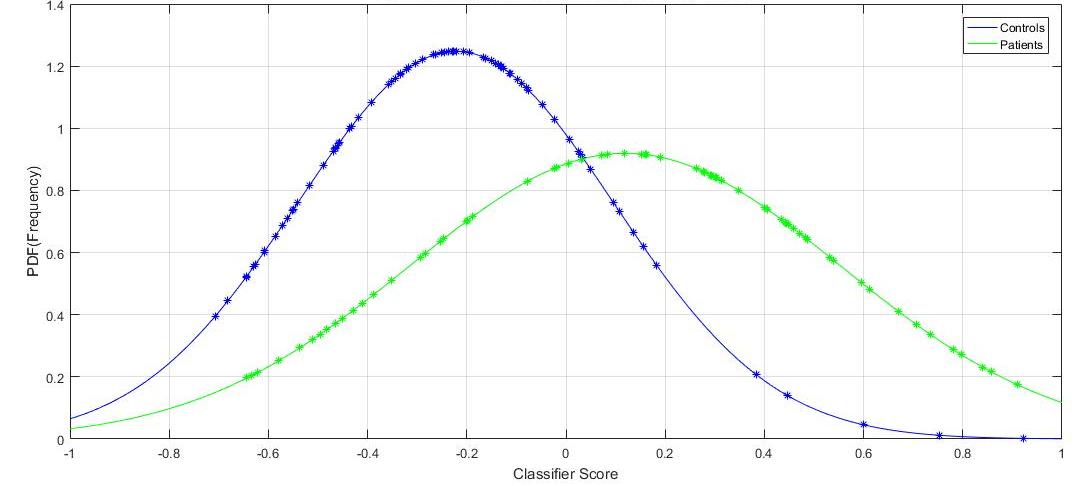
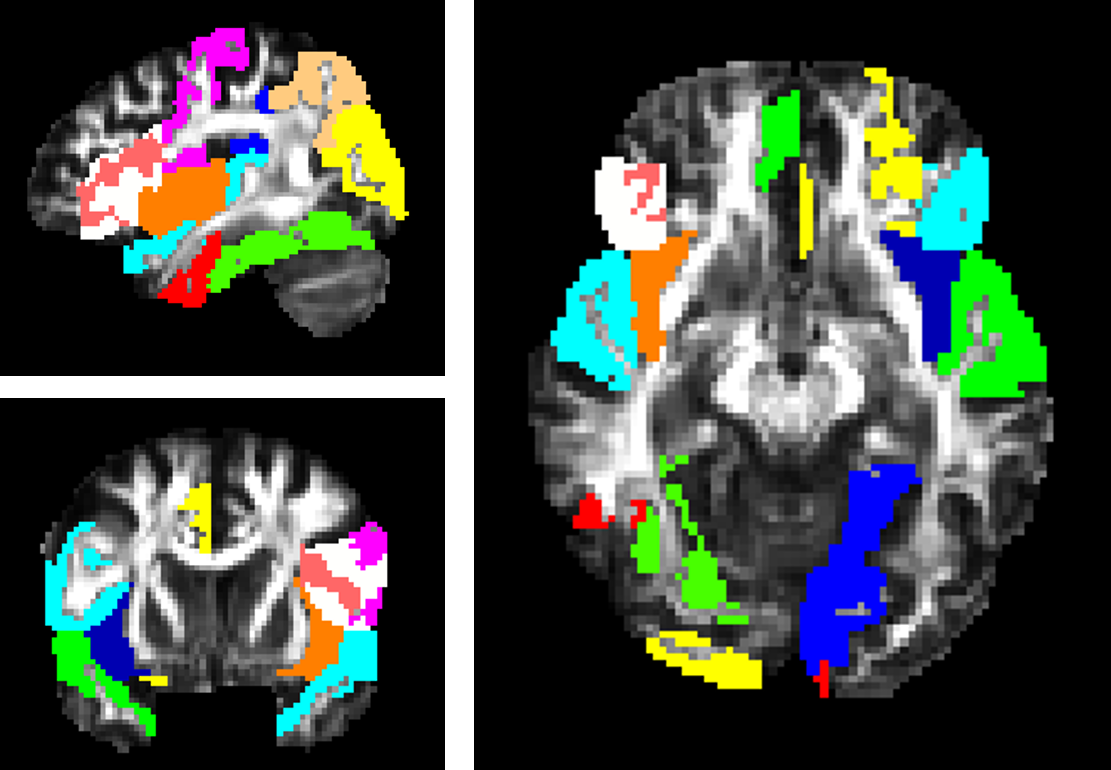
Figure 1 displays the probabilistic scores from the 10-fold cross-validation are plotted against the normal probability density (PDF) which represents the likelihood of each score. The predictive score ranges between +1 and -1 where a subject between 0 to 1 is a PD patient and 0 to -1 is a control. The average 10-fold accuracy was 72.8% while the testing accuracy was 78.5% (11/14). The top features that were selected frequently over the training set in the cross-validation included MD differences mainly in the gray matter regions such as cuneus (L), cingulate (L) superior temporal, inferior frontal, middle occipital (R), fusiform(R), insula(R) etc. as shown in figure 2. Regions from the basal ganglia were selected however the frequency of selection was not high. All the selected regions demonstrated higher mean MD values in the patient group compared to controls.Discussion
This study focused on predicting changes in pathology of PD while supporting diagnosis and providing a potential biomarker. Our classifier performed at 72.8% cross-validation accuracy and 78.5% testing accuracy. Widespread patterns of MD abnormality were observed in PD and have been demonstrated in earlier studies.9 Regions from the basal ganglia were not selected frequently however demonstrated trends of higher MD in PD. Earlier studies, 10,11 have demonstrated higher classification accuracies between PD and controls. However, these studies tend to perform feature selection outside of the cross-validation loop which may bias the results to higher accuracies. Furthermore, these do not utilize a separate test set to illustrate the working of the classifier.Acknowledgements
We would like to acknowledge BRAF-CDAC India for providing parallel computing services.References
1. Pyatigorskaya, N., Gallea, C., Garcia-Lorenzo, D., Vidailhet, M., & Lehericy, S. A review of the use of magnetic resonance imaging in Parkinson’s disease. Therapeutic advances in neurological disorders;2013,1756285613511507
2. Schwarz, S. T., Abaei, M., Gontu, V., Morgan, P. S., Bajaj, N., & Auer, D. P. Diffusion tensor imaging of nigral degeneration in Parkinson's disease: a region-of-interest and voxel-based study at 3T and systematic review with meta-analysis. NeuroImage: Clinical.2013; 3, 481-488
3. Adler, C. H., & Beach, T. G. Neuropathological basis of nonmotor manifestations of Parkinson's disease. Movement Disorders.2016
4. Adachi, M., et al., Topographical alterations of the midbrain and the substantia nigra following unilateral posteroventral pallidotomy in patients with Parkinson's disease using routine and multishot diffusion-weighted magnetic resonance imaging. Neuroradiology.2002;44(7): p. 579-85.
5. Aja-Fernández, S., Alberola-López, C., & Westin, C. F. Noise and signal estimation in magnitude MRI and Rician distributed images: a LMMSE approach. IEEE transactions on image processing.2008;17(8): 1383-1398.
6. Mori, S., Oishi, K., Jiang, H., Jiang, L., Li, X., Akhter, K., & Toga, A. W. Stereotaxic white matter atlas based on diffusion tensor imaging in an ICBM template. Neuroimage.2008; 40(2): 570-582.
7. Mori, S., Wakana, S., Van Zijl, P. C., & Nagae-Poetscher, L. M. MRI atlas of human white matter. Elsevier;2005.
8. Guyon, I. a. G.; S; Nikravesh, M.; Zadeh, L. Feature Extraction: Foundations and Applications. Springer; Berlin Hiedelberg New York;2006.
9. Youn, J., Lee, J. M., Kwon, H., Kim, J. S., Son, T. O., & Cho, J. W. Alterations of mean diffusivity of pedunculopontine nucleus pathway in Parkinson's disease patients with freezing of gait. Parkinsonism & related disorders.2015; 21(1): 12-17.
10. Haller, S., Badoud, S., Nguyen, D., Garibotto, V., Lovblad, K. O., & Burkhard, P. R. Individual detection of patients with Parkinson disease using support vector machine analysis of diffusion tensor imaging data: initial results. American Journal of Neuroradiology.2012; 33(11): 2123-2128.
11. Planetta, P. J., Ofori, E., Pasternak, O., Burciu, R. G., Shukla, P., DeSimone, J. C., & Vaillancourt, D. E. Free-water imaging in Parkinson’s disease and atypical parkinsonism. Brain, awv361;2015
Figures