2466
PC-MRI OF CEREBRAL BLOOD AND CSF FLOW VERSUS INTRACRANIAL PRESSURE MONITORING IN HYDROCEPHALUS PATIENTS1Departments of Medical Image Processing, BioFlowImage Laboratory, University Hospital of Picardie Jules Verne, AMIENS, France, 2Department of Internal Medicine and Gerontology, Toulouse University Hospital, Toulouse, France, 3Neurosurgical Unit, Department of Clinical Neurosciences, University of Cambridge, Cambridge, UK., 4Department of Nuclear Medicine, CHU Toulouse, Purpan University Hospital, Toulouse, France, 5UMR 1214 – INSERM/UPS – TONIC Toulouse Neuro-Imaging Center, Toulouse, France, 6Departments of Neurosurgery, University Hospital of Toulouse, France
Synopsis
The neurosurgical guidelines recommend low invasive intracranial pressure (ICP) monitoring with infusion tests to detect CSF dynamics alteration. In this study, we investigate how PC-MRI could be helpful in intracranial flow investigations. Eighty-three patients suspected of active hydrocephalus underwent the conventional ICP investigations. All the patients had also the day before, a rapid and simple PC-MRI to assess their cerebral blood and CSF flows. We found that patients who presented altered CSF dynamics (observed by ICP monitoring) presented also the smallest cervical CSF oscillations in the population. PC-MRI brings easy, quick and non-invasive complementary information to investigate the craniospinal dynamic.
INTRODUCTION
To select the shunt responders in suspected hydrocephalus population1, the neurosurgical guidelines recommends to apply intracranial pressure (ICP) monitoring and infusion tests to calculate resistance to cerebrospinal fluid (CSF) outflow (Ro) and ICP amplitude. These measurements remain a little invasive.
Phase contrast magnetic resonance imaging (PC-MRI) is the only technique which is able to quantify CSF and blood oscillations during the cardiac cycle2–4 and then their stroke volumes (SV). Although the use of SV to diagnose hydrocephalus patients remains debated5,6, SV can give helpful information of the craniospinal compensatory system7,8 in non-invasive manner.
The impact of hydrocephalus disease on CSF and cerebral blood oscillations is still controversial. The aim of this work was to investigate if CSF and cerebral blood oscillations measured by PC-MRI are impacted by resistance to CSF outflow measured by ICP monitoring.
METHODS
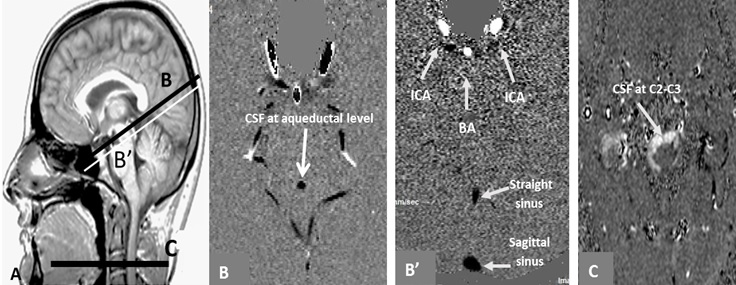
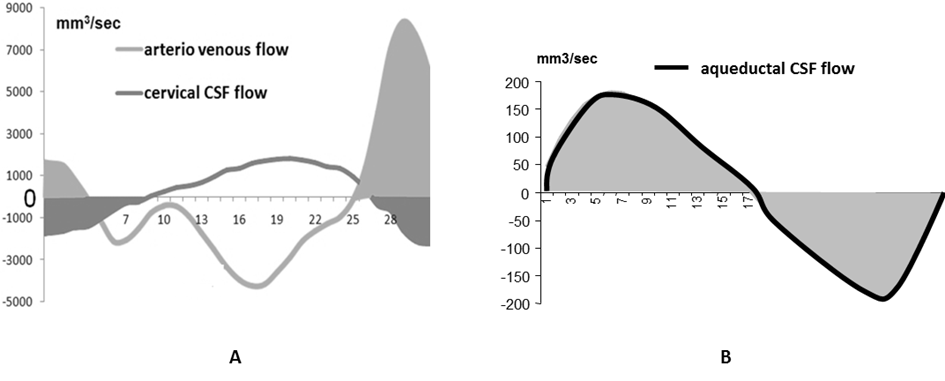
83 subjects (74±7years) suspected of hydrocephalus underwent ICP monitoring during infusion test to assess resistance to CSF outflow (Ro). After infusion, Ro was automatically calculated using ICM+ 9 and was used with clinical signs to classify the patients in normal or pathological group10. Previous day, patients underwent PC-MRI on 3T MRI machine for the quantification of CSF and blood flows (figure 1). Velocity sensitization was set to 5-10 cm/s for the CSF and 80 cm/s for the blood vessels. PC-MRI parameters included: repetition time: 23ms, echo time: 5ms, field of view: 150 mm × 150 mm, section thickness: 5 mm, flip angle: 15° and a spatial resolution of 0.59 mm × 0.59 mm. For each flow series, the acquisition time was approximatively 2 minutes depending on the cardiac period. Using Flow analysis software4, intracranial arterial and venous flows were reconstructed to measure the mean total cerebral arterial blood flow (tABF) and the mean cerebral venous flow (VBF). Aqueductal and cervical CSF flows were also reconstructed during the cardiac cycle. Cervical CSF stroke volume (CSV), aqueductal CSF stroke volume (ASV) and intracranial blood stroke volume (SVblood) were calculated by integrating respectively the cervical CSF, aqueductal CSF and arteriovenous flows along the cardiac cycle (figure 2). CSV and SVblood correspond to the volume of fluid moving inside and outside the cranium during the cardiac cycle whereas ASV corresponds only to the ventricle compartments.RESULTS
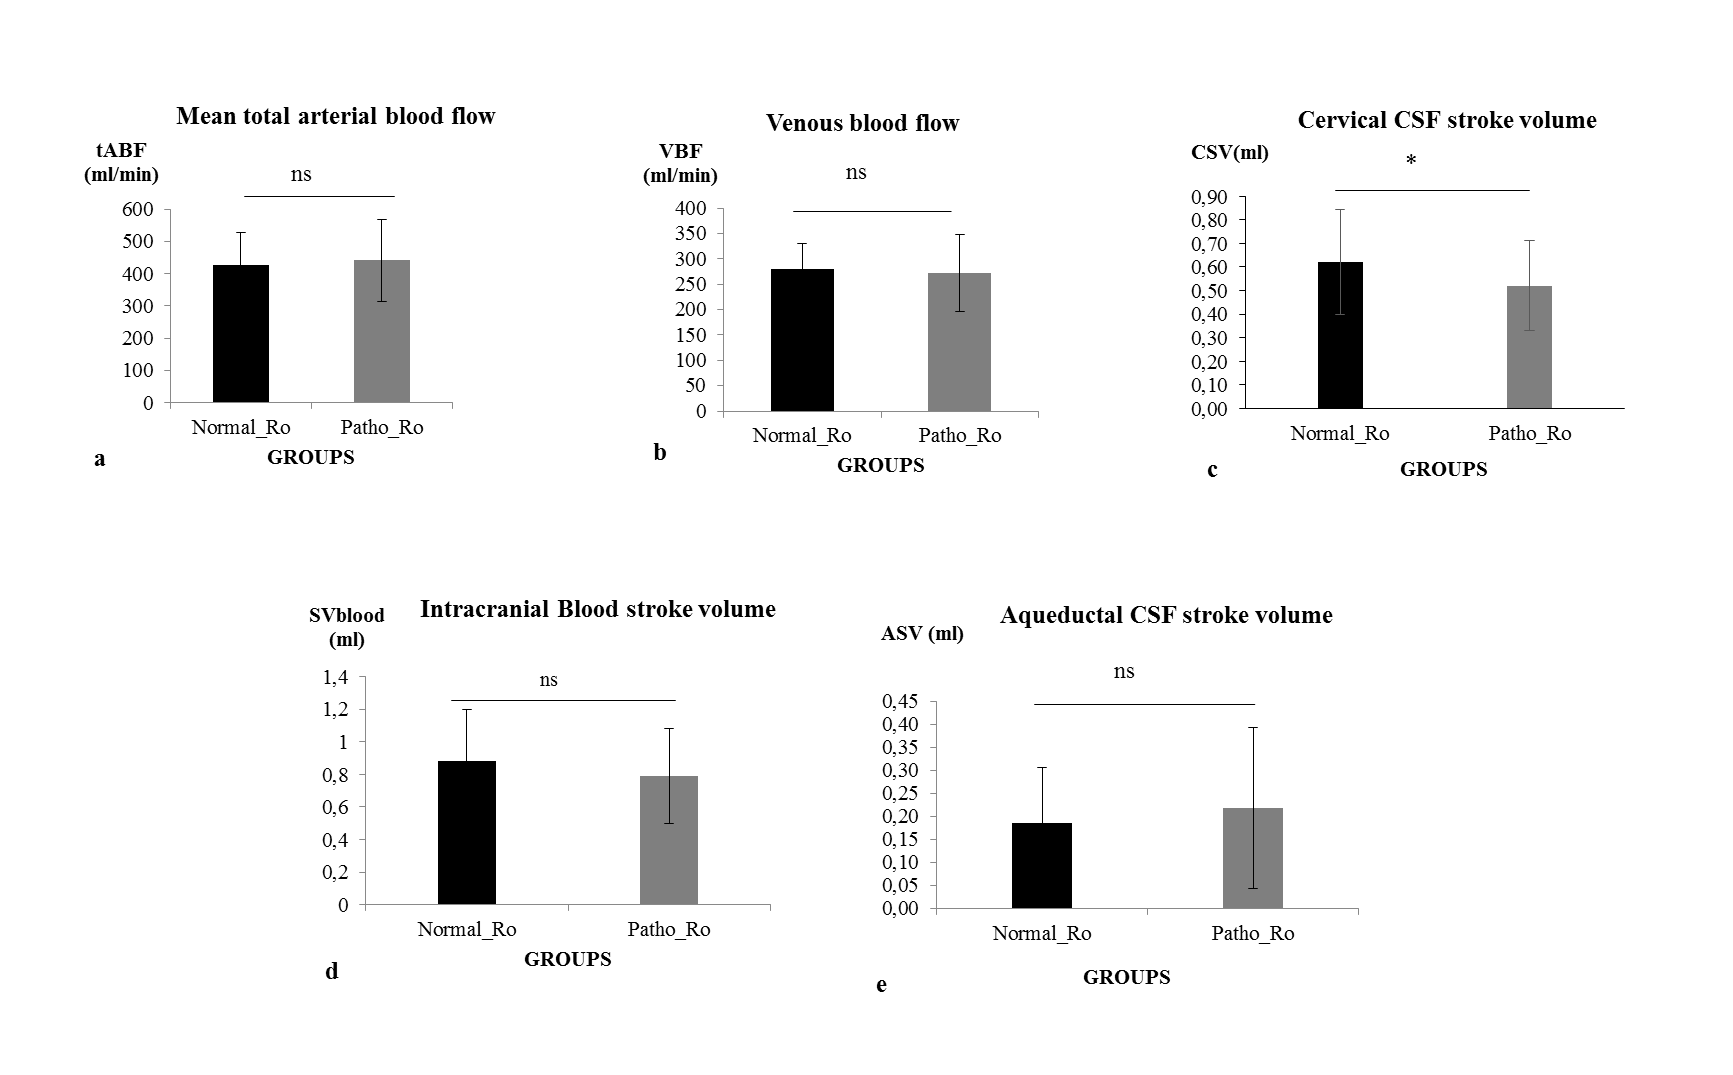
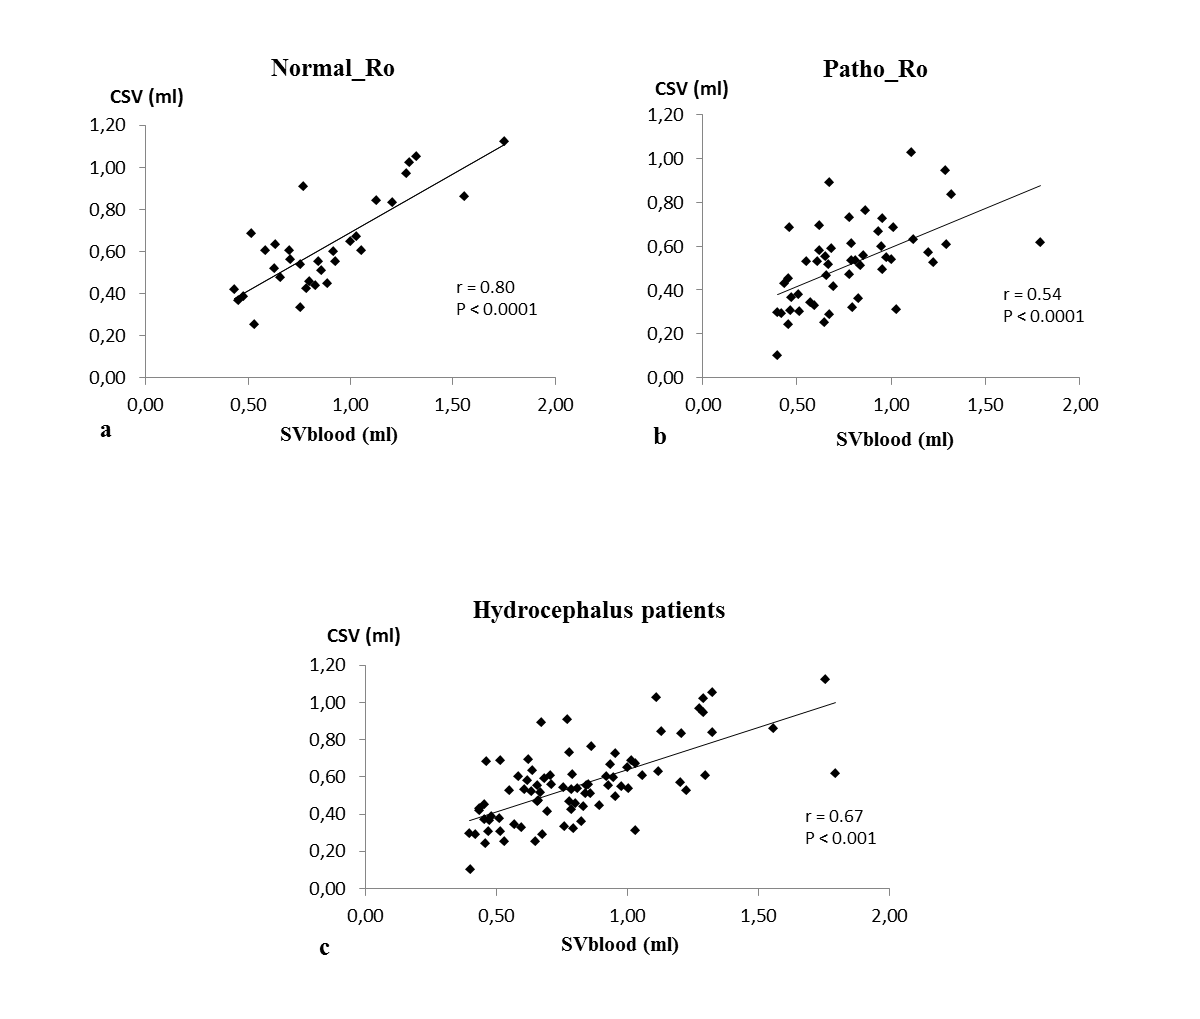
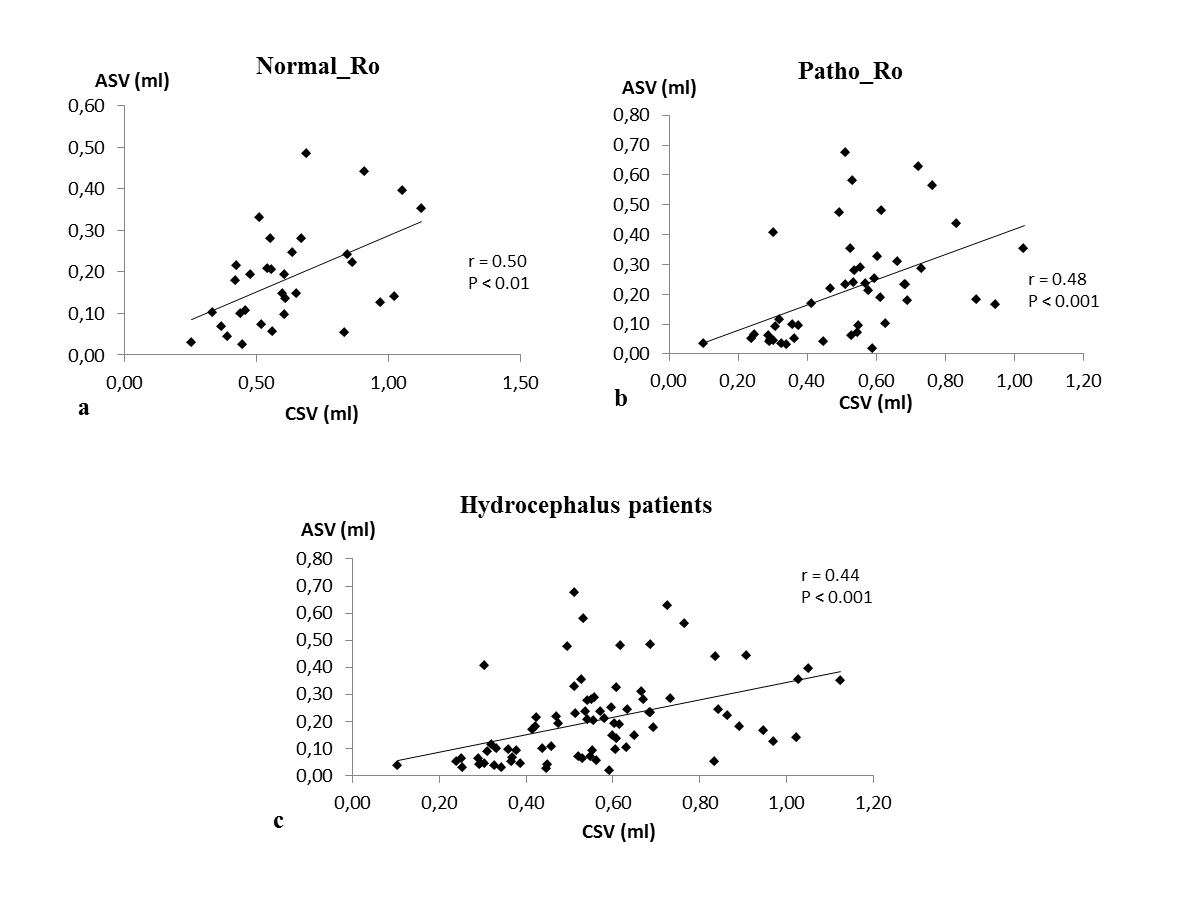
32 patients with a normal Ro (9±2mmHg/ml/min) were included in Normal_Ro group and 51 others who’s Ro was pathological (23±14mmHg/ml/min) were in Patho_Ro group. No significant differences were found between both groups respectively for mean total cerebral arterial blood flow, mean venous blood flow, intracranial blood stroke volume and aqueductal stroke volume. CSV was higher (p=0.04) in Normal_Ro (0.62±0.22ml) than in Patho_Ro (0.52±0.19ml) (figure3). There is a strong positive correlation (p<0.001) between CSV and SVblood (figure 4). A positive correlation was also found between ASV and CSV in hydrocephalus patients (figure 5).DISCUSSION
Total cerebral arterial flow is reduced in our patients compared to normal aging (575.5 ± 97 ml/min)11. This can be due to the ventricular dilation observed in hydrocephalus which causes a global decrease in cerebral perfusion. Cervical CSF stroke volume (CSV) is the only parameter different between the two groups. The decrease of CSV in Patho_Ro compared to Normal_Ro highlights that PC-MRI technique could be helpful to differentiate hydrocephalus patients.
The mean values of CSV are higher in our patients than in elderly volunteers (0.457 ± 0.147 ml) 11 whereas the mean values of ASV are higher than the normal value (0.034 ± 0.016 ml)11.
SVblood was correlated to CSV and CSV was correlated to ASV. This result indicates the existence of a strong relationship between the cerebral fluids in response to vascular expansion during the cardiac cycle.
CONCLUSION
We have shown that an impact of hydrocephalus exists on CSF and cerebral blood oscillations. Hydrocephalus patients presented an increase of their cervical and aqueductal CSF oscillations and a decrease of total cerebral arterial perfusion. Cervical CSF stroke volume is the only parameter which is different between hydrocephalus patients with normal Ro and the others with high Ro. So, cervical CSF oscillations obtained by PC-MRI could be additional information to better understand CSF dynamics in hydrocephalus patients.Acknowledgements
No acknowledgement found.References
1. Marmarou, A., Black, P., Bergsneider, M., Klinge, P. & Relkin, N. Guidelines for management of idiopathic normal pressure hydrocephalus: progress to date. Acta Neurochir. Suppl. 95, 237–240 (2005).
2. Enzmann, D. R., Ross, M. R., Marks, M. P. & Pelc, N. J. Blood flow in major cerebral arteries measured by phase-contrast cine MR. AJNR Am. J. Neuroradiol. 15, 123–129 (1994).
3. Marks, M. P., Pelc, N. J., Ross, M. R. & Enzmann, D. R. Determination of cerebral blood flow with a phase-contrast cine MR imaging technique: evaluation of normal subjects and patients with arteriovenous malformations. Radiology 182, 467–476 (1992).
4. Balédent, O., Henry-Feugeas, M. C. & Idy-Peretti, I. Cerebrospinal fluid dynamics and relation with blood flow: a magnetic resonance study with semiautomated cerebrospinal fluid segmentation. Invest. Radiol. 36, 368–377 (2001).
5. Qvarlander, S. et al. Cerebrospinal fluid and blood flow patterns in idiopathic normal pressure hydrocephalus. Acta Neurol. Scand. (2016).
6. Al-Zain, F. T., Rademacher, G., Meier, U., Mutze, S. & Lemcke, J. The role of cerebrospinal fluid flow study using phase contrast MR imaging in diagnosing idiopathic normal pressure hydrocephalus. Acta Neurochir. Suppl. 102, 119–123 (2008).
7. Bateman, G. A. The pathophysiology of idiopathic normal pressure hydrocephalus: cerebral ischemia or altered venous hemodynamics? AJNR Am. J. Neuroradiol. 29, 198–203 (2008).
8. El Sankari, S. et al. Cerebrospinal fluid and blood flow in mild cognitive impairment and Alzheimer’s disease: a differential diagnosis from idiopathic normal pressure hydrocephalus. Fluids Barriers CNS 8, 12 (2011).
9. Smielewski, P. et al. ICM+: software for on-line analysis of bedside monitoring data after severe head trauma. Acta Neurochir. Suppl. 95, 43–49 (2005).
10. Kim, D.-J. et al. Thresholds of resistance to CSF outflow in predicting shunt responsiveness. Neurol. Res. 37, 332–340 (2015).
11. Stoquart-ElSankari, S. et al. Aging effects on cerebral blood and cerebrospinal fluid flows. J. Cereb. Blood Flow Metab. Off. J. Int. Soc. Cereb. Blood Flow Metab. 27, 1563–1572 (2007).
Figures