2461
White matter volume change of carbon monoxide intoxication: a 9-month follow-up study1Electrical Engineering, National Sun Yat-Sen University, Kaohsiung, Taiwan, 2Electrical Engineering, National Taiwan University, 3Neurology, E-Da Hospital, 4Radiology, Kaohsiung Veterans General Hospital
Synopsis
Using automated segmentation, volume of brain tissues is assessed at around one week, one month, three months, and 9 months after CO exposure. Among all 17 patients (7 male, mean age: 42.7 yr) recruited in this prospective study, seven are diagnosed with delayed neuropsychiatric syndrome (DNS) and the other ten without. Our results indicate that the white matter volume of all DNS positive patients shows similar trends that it first increases at 1-month follow-up and then decreases, when other GM tissues remain the same. In addition, no volume change is observed in the group without DNS.
Introduction
Carbon monoxide intoxication could cause serious damage to the brain tissue due to cellular hypoxia and direct poisoning effect. In addition to acute symptoms, some surviving patients may experience recurrent neuropsychiatric symptoms after an interval of normality, which is the so-called lucid interval, and it is important, yet difficult, to predict the occurrence of delayed neuropsychiatric syndrome (DNS).1 Previous studies suggest that progressive demyelination in WM is more related to chronic symptoms than gray matter and could be a cause of DNS.2 Diffusion MR imaging also shows that low ADC occurs at acute stage in cases of DNS.3 In addition to the abnormal WM intensity observed in MR imaging, the reduced fornix-to-brain ratio 4 and cross-sectional area of corpus callosum 5 at chronic stage has been reported in longitudinal studies, suggesting generalized WM atrophy. However, the whole-brain volumetric evaluation on CO intoxication 6 is seldom discussed in a longitudinal approach. Therefore, the purpose of this prospective study is to investigate the volume change of brain tissues, especially WM, on patients with and without DNS.Methods
Seventeen patients (7 male, 20 to 69 years old with a mean age of 42.7) enrolled in this study were scheduled to undergo MRI examinations at seven days, one month, three months, and nine months, respectively, after CO inhalation at a 1.5-T scanner (Signa HDx, General Electric Healthcare, Milwaukee, WI). Four of them were not physically available at the first experiment. Among all these subjects, seven (4 male) were diagnosed to have DNS. At each follow-up exam, the MPRAGE sequence was applied (TE/TR/TI = 4.2/8.9/400 ms, flip angle = 20°, FOV = 240 mm, voxel size = 0.94×0.94×1 mm3) to obtain the whole-brain high-resolution T1-weighted imaging for volumetric assessment. Automatic tissue segmentation (FreeSurfer software package, version 5.3.0) is performed to estimate the volume of brain tissues, including white matter, gray matter, and the intracranial space. The paired t-test is used to check if longitudinal change in volume appears in any two of the follow-up exams.Results
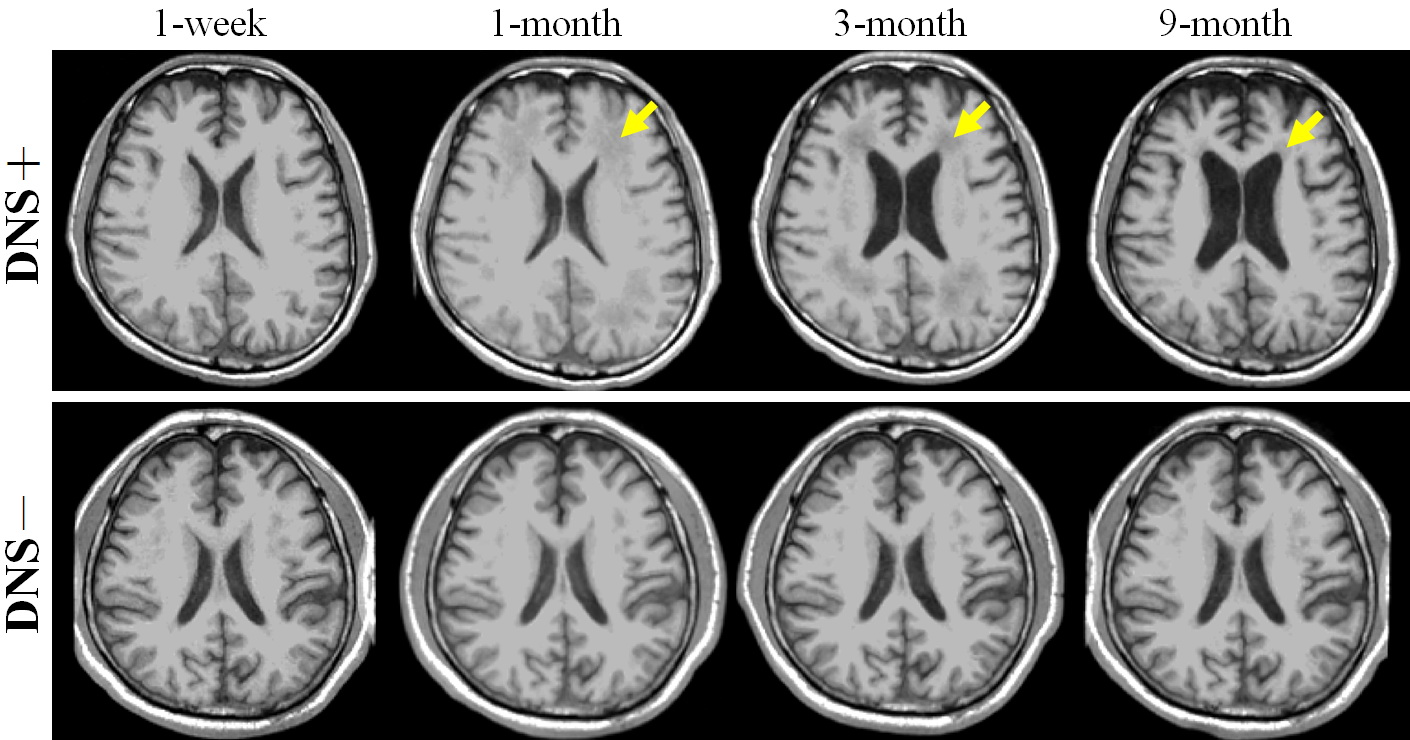
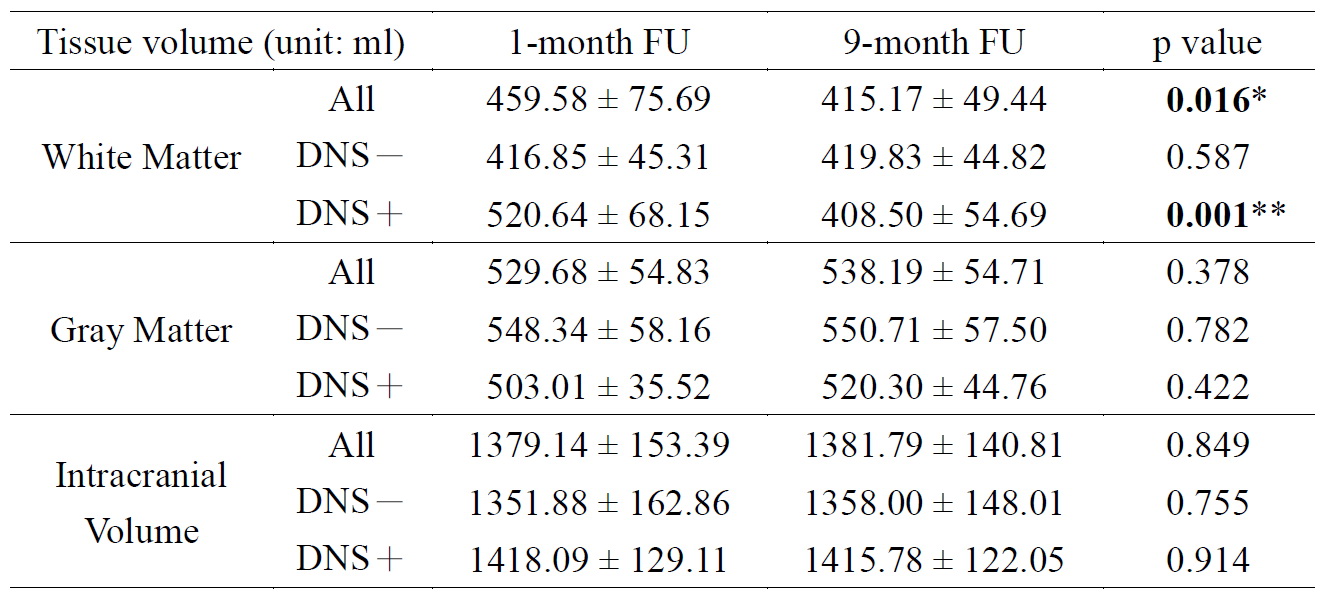
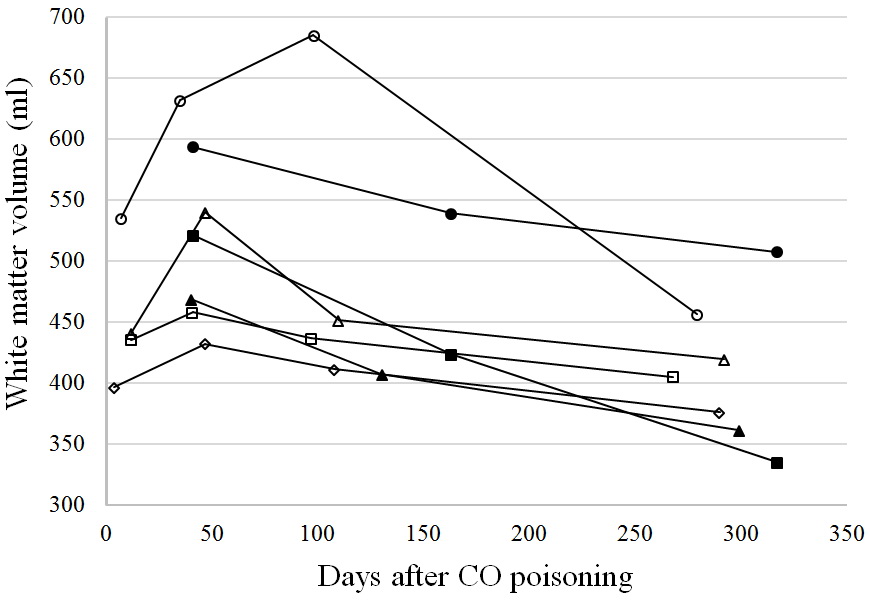
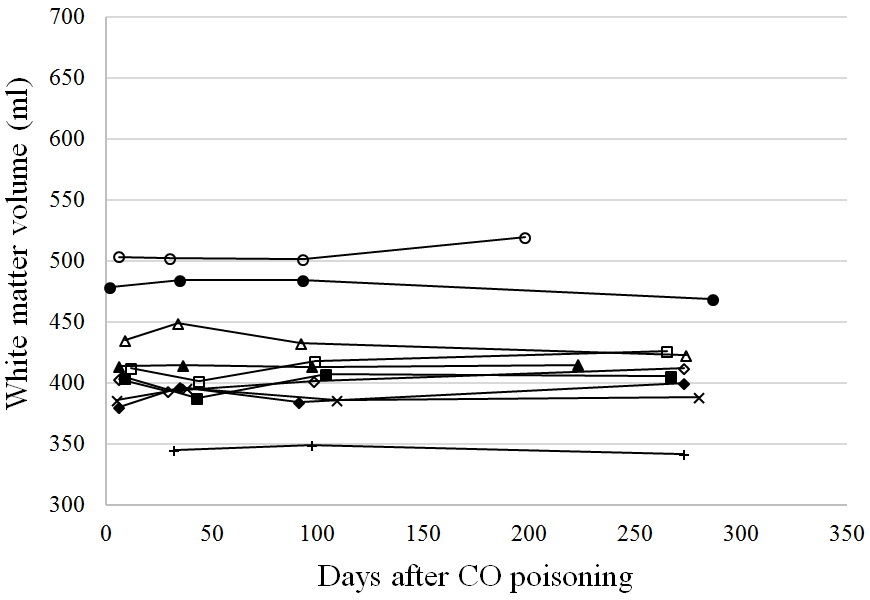
Figure 1 shows the image results of two patients, one with DNS and another without. For each case, a series of four axial T1WI, which were collected at different follow-up times, is demonstrated after co-registration. For the DNS positive case, cerebral WM hypointensity appears at 1-month follow-up (yellow arrows) of and persists until 9 months. Compared to the first image taken at the seventh day after onset, the ventricular space remains in similar shape or slightly shrinks at 1-month, followed by obvious dilation at 3-month and 9-month. On the other hand, no visual difference is observed among the images of the DNS negative patient. To maximize the sample size, the tissue volumes obtained at 1-month, instead of 1-week, are compared with those at 9-month. The table in Fig.2 indicates that the total WM volume decreases significantly at 9-month, and no statistical difference is found on the GM volume, intracranial volume, and volumes of other deep gray matter tissues (data not shown due to limited space), including hippocampus and basal ganglia. Furthermore, the shrinkage of WM only happens in patients with DNS. For better observation of the longitudinal change of WM volume, scatter plots of DNS+ and DNS- groups are shown in Fig.3 and 4.Discussion
According to our results (Fig.3), the WM volume of all DNS patients shows similar trends that it first increases at 1-month follow-up and then decreases. After 9 months, the WM of each subject who finishing all follow-ups (n=4) became even smaller than what it was after one week. Previous findings on autopsy 7 and diffusion MRI 3,8 indicate that the cytotoxic edema takes place in the damaged WM at the acute stage and progressive demyelination could remain in the chronic phase. These pathological features could nicely correspond to our observation in this study that the early swelling of WM tissue is followed by atrophy due to neurodegeneration. In addition, the intracranial volume shows no significant difference between DNS- and DNS+ groups (p = 0.413), suggesting that larger WM volume at 1-month is not a result of biased head size. On the other hand, no significant change in volume of WM or other gray matter tissues has been found in CO poisoning survivors without DNS.Acknowledgements
The authors acknowledge the grant (MOST 105-2221-E-110-054) supported by Ministry of Science and Technology of Taiwan.References
1. Ernst A, Zibrak JD. Carbon monoxide poisoning. N Engl J Med. 1998; 339(22):1603–1608.
2. Beppu T. The role of MR imaging in assessment of brain damage from carbon monoxide poisoning: a review of the literature. AJNR Am J Neuroradiol. 2014; 35(4): 625-631.
3. Kim JH, Chang KH, Song IC, et al. Delayed encephalopathy of acute carbon monoxide intoxication: diffusivity of cerebral white matter lesions. AJNR Am J Neuroradiol. 2003; 24(8):1592–1597.
4. Kesler SR, Hopkins RO, Blatter DD, et al. Verbal memory deficits associated with fornix atrophy in carbon monoxide poisoning. J Int Neuropsychol Soc. 2001; 7(5):640-646.
5. Porter SS, Hopkins RO, Weaver LK, et al., Corpus callosum atrophy and neuropsychological outcome following carbon monoxide poisoning. Arch Clin Neuropsychol. 2002; 17(2):195-204.
6. Chen HL, Chen PC, Lu CH, et al. Structural and cognitive deficits in chronic carbon monoxide intoxication: a voxel-based morphometry study. BMC Neurol. 2013; 13:129.
7. Lapresle J, Fardeau M. The central nervous system and carbon monoxide poisoning. II. Anatomical study of brain lesions following intoxication with carbon monixide (22 cases). Prog Brain Res. 1967; 24:31-74.
8. Lin WC, Lu CH, Lee YC, et al. White matter damage in carbon monoxide intoxication assessed in vivo using diffusion tensor MR imaging. AJNR Am J Neuroradiol. 2009;30:1248–1255.
Figures