2457
Relationship between cerebral blood flow and water diffusion in the brain of misery perfusion model mice1National Institutes for Quantum and Radiological Science and Technology, Chiba, Japan, 2Fukushima Medical University, Fukushima, Japan
Synopsis
We have investigated degeneration of the nerve fibers in chronic cerebral hypoperfusion model mice using DTI. Simple t-tests indicated that there are significant differences in CBF between the control and occluded sides of the brain, but there was no significant difference for MD. However, analysis of covariance showed that MD was strongly correlated with CBF, and that there were significant differences in MD between the contra- and ipsilateral sides. The result suggests degeneration of the nerve fibers due to chronic hypoperfusion. It is also suggested that CBF-related signal changes might be important for pathological diagnosis with DTI.
Introduction
Chronic cerebral hypoperfusion model mice were created by unilateral common carotid artery occlusion (UCCAO) surgery that does not cause cerebral infarction, but does cause a long term reduction in cerebral blood flow (CBF) to the occluded side. Cognitive dysfunction in this mouse model has been demonstrated in behavioral experiments1, but nerve density change was not found in a previous positron emission tomography (PET) study2. Because degeneration of the nerve fibers is considered to be responsible for cognitive dysfunction, in this study we investigated the possibility of neurodegeneration using diffusion tensor imaging (DTI). Also, as changes in cerebral blood flow are known to affect diffusion-weighted imaging due to changes in the pseudodiffusion coefficient (D*)3-4, we have analyzed the DTI of chronic hypoperfusion model mice with respect to the influence of CBF.Methods
We subjected 10 male C57BL/6J mice to UCCAO surgery to create the chronic hypoperfusion model. A mixture of air, oxygen, and isoflurane anesthesia was given by face mask. A midline cervical incision was made, and the right common carotid artery was isolated from the adjacent vagus nerve and double-ligated using 6–0 silk sutures. Each measurement was carried out 1 month after UCCAO surgery.
A 7T animal MRI (Kobelco and Bruker, Japan) system was used for this experiment. DTI was performed with a 4-shot spin-echo echo-planar imaging (EPI) sequence (TR = 3.5s, TE = 23 ms, FOV = 2.56 cm × 2.56 cm, matrix size = 128 × 128, slice thickness of 1 mm, gradient directions = 30, Δ = 10 ms, δ = 5 ms, and b values = 0 and 670 s/mm2).
CBF measurements were carried out using the flow-sensitive alternating inversion recovery (FAIR) arterial spin labeling (ASL) technique with rapid acquisition with relaxation enhancement (RARE) image acquisition (TR = 12 s, TR = 46.8 ms, FOV = 2.56 cm × 2.56 cm, matrix size = 128 × 128, slice thickness of 1 mm, and RARE factor = 72). For both the non-selective and slice-selective acquisitions, images at twenty-two different inversion times were acquired: 30, 100, 200, 300, 400, 500, 600, 700, 800, 900, 1000, 1100, 1200, 1300, 1400, 1500, 1600, 1700, 1800, 1950, 2100, and 2300 ms. Quantitative traveling-time-independent CBF values were calculated from the signal differences between nonselective and slice-selective images.
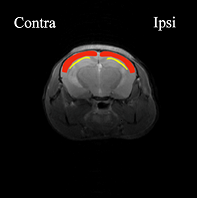
Mean diffusivity (MD) and fractional anisotropy (FA) maps were estimated from the data using MATLAB (Mathworks, MA, USA). Regions-of-interest (ROIs) in the neocortex and deep cerebral white matter were manually drawn on the FA maps from each animal (Fig. 1), and values for CBF, MD and FA in each ROI were calculated.
In addition, brain sections obtained from chronic hypoperfusion model mice were subjected to immunohistochemical staining with MAP2, which binds to dendrites.
Results
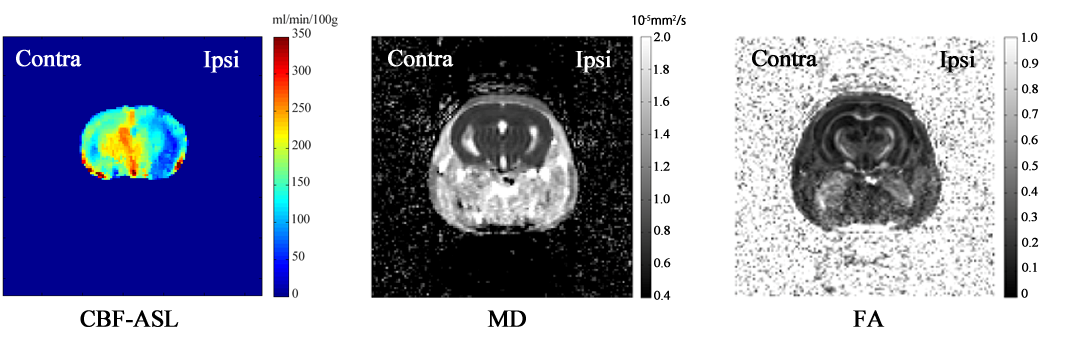
Typical CBF, MD, and FA maps are shown in Fig. 2. The CBF map has laterality, but the others look more symmetric. The maps were analyzed with the following statistical methods.
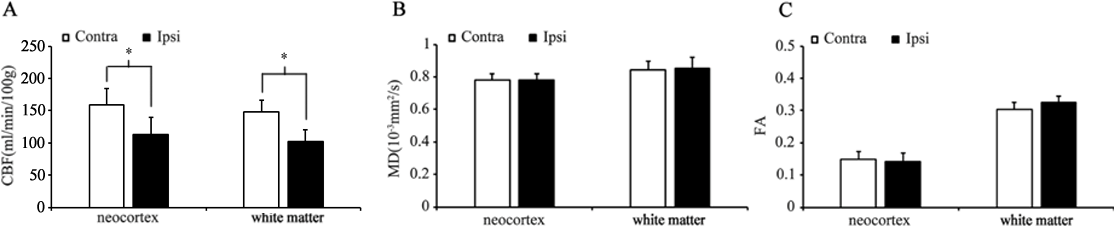
Paired-t tests: Significant reduction of the CBF on the occlusion side in both the neocortex and white matter ROIs was found (p < 0.001), while neither the MD nor FA showed any significant change in either ROI (Fig. 3).
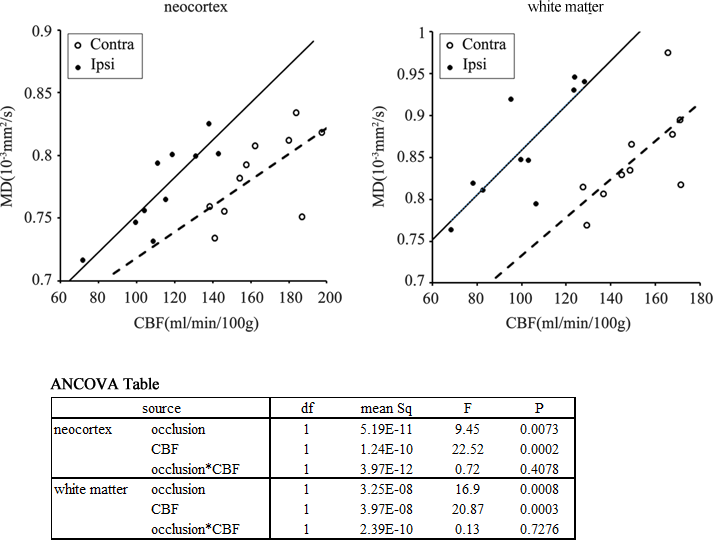
Analysis of covariance (ANCOVA): Since a positive correlation between CBF and D* has been reported3-4, the MD was analyzed with ANCOVA using the CBF as a covariate. It was found that MD is strongly correlated with CBF (p < 0.001, Fig. 4), and that there are significant differences in MD between the contra- and ipsilateral sides for both ROIs (p < 0.01, Fig. 4). No significant differences were obtained for the FA.
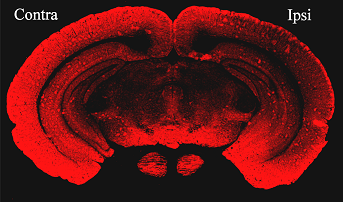
Immunohistochemical staining: Staining of brain sections with MAP2 showed a decrease in luminance on the occlusion side (Fig. 5).
Discussion
The significant differences in contra- and ipsilateral MD found with ANCOVA might be explained by the UCCAO-inducing neurodegeneration. This view is supported by the immunohistochemical staining results. However, it is unclear why no significant differences were obtained for the FA.
The result that no significant difference was obtained for MD with the paired-t test suggests that the increase in MD is masked by CBF-related signal changes. It may be necessary to correct for this effect when attempting pathological diagnosis with DTI.
Acknowledgements
This work was supported by the grants from KAKENHI (15H04910) and MEXT, Japan.References
[1] Yoshizaki K, et al. Exp Neurol. 2008;210:585-591. [2] Nishino A, et al. Sci Rep. 2016;27;6:25072. [3] Le Bihan D, et al. Radiology. 1986 Nov;161(2):401-7. [4] Hu LB, et al. Chin Med J. 2015;128:2565-2569.Figures