2448
White Matter Hyperintensities Segmentation and Stereological Bias Correction On Clinical MRIs1Biomedical Engineering, University of Southern California, Los Angeles, CA, United States, 2Division of Cardiology and Radiology, Children's Hospital Los Angeles, Los Angeles, CA, United States
Synopsis
White matter hyperintensities are lesions in the brain that exhibit high signal intensity on T2-weighted FLAIR images. In this study, we designed a seed-based segmentation method of these lesions from T2-weighted images of 1.3mm axial resolution, utilizing the local gradient field on a breadth-first search scheme as well as level thresholding and smoothing for false-positive reduction. Additionally, since clinical MRIs are at lower resolution of 1x1x5mm, we modeled the relationship between lesion cross-sectional radius and its true volume with a cubic polynomial fit to correct for stereological bias.
Introduction
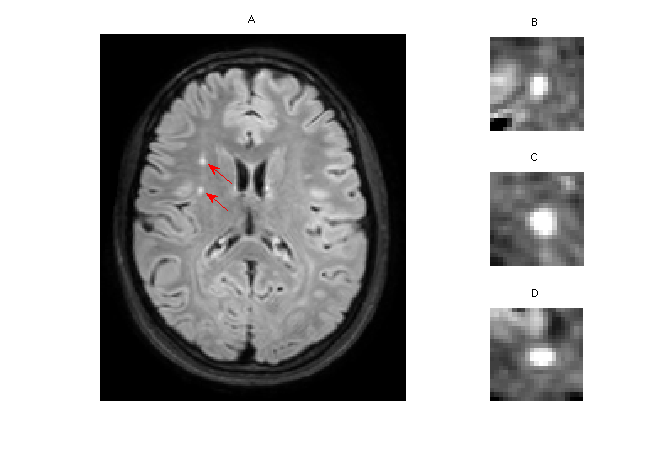
White matter hyperintensities (WMH) are small lesions in the brain that are bright on T2-weighted FLAIR images (Figure 1a), commonly occurring in patients with sleep apnea, hypertension, the elderly and patients with sickle cell anemia. Previous studies have demonstrated segmentation using machine-learning methods.1,2 In this study, we designed a semiautomatic non-iterative method that is completely intensity-based and requires no previous training to segment these lesions from T2-weighted images, tested it on high-resolution (1.3mm isotropic) 3D T2 datasets from 30 SCD patients, and compared lesion volumes with manually traced contours. Since clinical head MRIs have slice thicknesses of 5mm, individual WMH are typically observed in only one slice. We therefore resampled the 3D datasets at clinical imaging resolution (1x1x5mm) and modeled the relationship between lesion cross-sectional area observed on 2D and true lesion volume to correct for intrinsic stereologic bias.Methods
All patients provided informed consent under a protocol (CCI#11-0083) approved by the Committee on Clinical Investigation at Children’s Hospital Los Angeles. 3D T2-weighted FLAIR images were collected on a Philips 3T Achieva using an 8-element head coil and the following parameters: TR 4800ms, TE 250ms, FOV 256x256x123, resolution 1x1x1.3mm, flip angle 90 degrees. Images were viewed in a custom MATLAB environment.
A total of thirty SCD patients were studied, yielding 45 WMHs on T2-weighted imaging (1-16 per patient). The semiautomatic method required a seed inside the lesion. Region growing was performed in six directions using the local gradient field. After computing the gradient magnitude from T2-weighted images, the program utilized a breadth-first search approach to expand by adding adjacent voxels to the search queue when the voxel’s gradient magnitude was larger than that of its predecessor voxel. The search terminated when the search queue is empty.
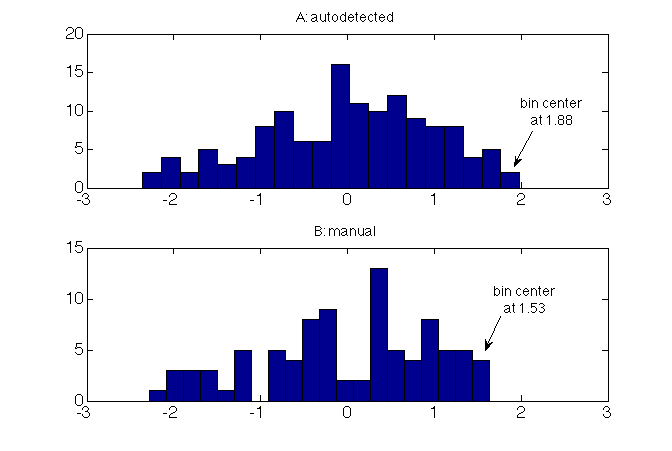
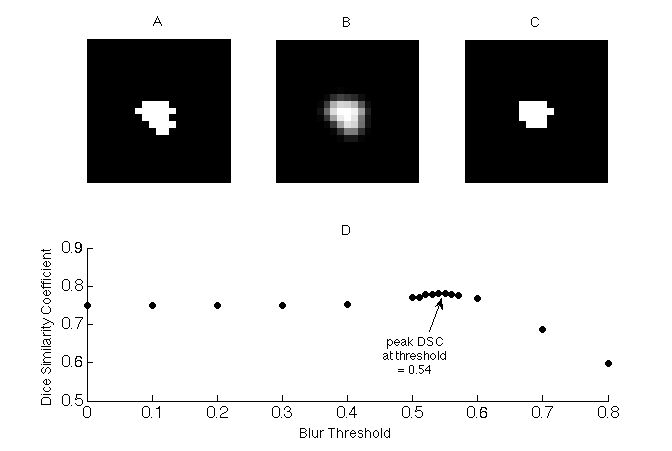
To reduce false positives on the segmentation, the program implemented level-thresholding, removing pixels that were 0.3 z-scores from the maximal signal intensity in the lesion; pixel intensities were reciprocally transformed to improve normality. The 0.3 z-score threshold was determined empirically, by comparing lesion histograms from 11 autodetected and manual contours in subset of 5 patients (Figure 2). To reduce irregularities in lesion shape, the segmented binary lesion was smoothed with a 3x3x3 Gaussian kernel and thresholded at an experimental value of 0.54 (Figure 3). The resulting lesion was compared with manual segmentations for validation by using Dice Similarity Coefficient $$$DSC = \frac{2\times\mid Auto\bigcap Manual \mid }{\mid Auto+Manual\mid}$$$ and lesion volume was compared by Bland-Altman agreement $$$BA = \frac{Auto + Manual }{Average(Auto,Manual)}$$$.
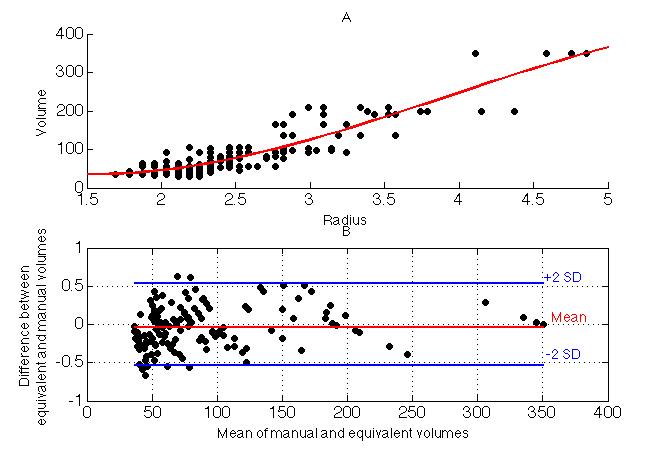
To approximate images acquired at clinical resolution, the 3D dataset was resampled (AFNI 3dresample) to create 1x1x5mm resolution images; five different 2D datasets were created from each 3D dataset by shifting the slice alignment by 1mm. Equivalent radius was calculated from the area of manual contour with $$$R_{eq} = \sqrt{\frac{Area}{\pi}}$$$ in voxel units. A cubic polynomial was used to model the relationship between Req and the corresponding manual volume (Figure 4a). The Goodness-of-Fit of the predicted 3D volume was compared with the true volume using Bland-Altman limits of agreement, normalized to lesion volume.
Results
Inspections of the lesions in the patient cohort show that these hyperintensities tend to be relatively smooth and convex in shape as shown in Figure 1 (one-way ANOVA test on diameters measured on 3 orientations show no significant difference (p = 0.58)).
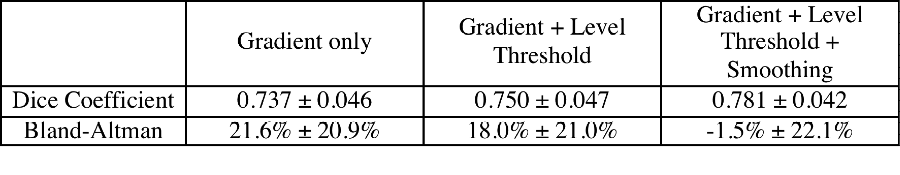
Table 1 summarizes the Dice Coefficients and Bland-Altman volume comparisons for each step in the analysis pipeline. The Dice Coefficient improved modestly with each step, but volumetric bias improved dramatically. Bland-Altman limits of agreement between auto and manually detected lesions was -45.7% to 42.7%. Simple gradient and level-based thresholding overestimated manually traced lesion volume, suggesting undue weighting of partial volume pixels.
Cubic regression of cross-sectional radii and manual volume (r2=0.833) yields the following model:$$V_{eq} = -134.24+84.62×R_{eq}+31.59×(R_{eq}-2.55)^2-7.65×(R_{eq}-2.55)^3.$$
Comparison between the manual and equivalent volume predicted from 2D yields no bias and limits of agreement of -54% to +54% (Figure 4b), only slightly less robust than autodetection from the 3D acquisition.
Discussion
We demonstrate that seed-based semiautomatic quantification of WMH is simple, fast, and accurate, even at clinical imaging resolution. This method operates on T2-weighted images of 1mm inplane resolution to yield the number of voxels within the lesion. The Dice Coefficient reported is comparable with the values attained using other machine-learning methods for moderate-sized lesions.1,2 From an equivalent radius derived from WMH cross-sectional area, unbiased estimates of lesion volume could be obtained using a cubic polynomial fit to correct for stereologic bias. The program will be used to derive WMH probability maps from large archives of clinical and research data.Acknowledgements
This work supported by the National Heart Lung and Blood Institute. Grant Number: 1U01HL117718-01, and Minority Supplement to 1U01HL117718-0, the National Center for Research through the Clinical Translational Science Institute at Children's Hospital Los Angeles. Grant Number: 5UL1 TR000130-05, and Philips Healthcare through research support in kind.References
1. Anbeek P, Vincken KL, van Osch MJ, Bisschops RH, van der Grond J. Probabilistic segmentation of white matter lesions in MR imaging. Neuroimage. 2004 Mar;21(3):1037-44.
2. Gibson E, Gao F, Black SE, Lobaugh NJ. Automatic segmentation of white matter hyperintensities in the elderly using FLAIR images at 3T. J Magn Reson Imaging. 2010 Jun;31(6):1311-22.
Figures