2446
Relationship between venous congestion and susceptibility of collecting veins: an in-vivo QSM study with developmental venous anomaly1Radiology, Seoul St. Mary's hospital, College of Medicine, The Catholic University of Korea, Seoul, Korea, Republic of
Synopsis
A developmental venous anomaly (DVA) is a common vascular malformation, with an unusual-locating collection vein and fine venous structures draining into it. Occasionally, abnormal signal intensity is combined in draining area of DVA, which is a result of venous congestion. In this work, we explored the magnetic susceptibility of draining veins in DVAs with and without venous congestion. DVAs with venous congestion showed higher susceptibility values in collecting veins than those without venous congestion. Using 3D GRE and QSM, we could assess the oxygen metabolism of brain tissue with venous congestion.
Purpose
A developmental venous anomaly (DVA) is a common vascular malformation, with an estimated incidence of 2.5%.1 An unusual-locating collection vein and fine venous structures draining into it are typical description of this brain lesion. Its imaging and clinical findings suggested it to be an embryologic variant of venous drainage. Several reports suggested that some of DVA could have abnormal parenchymal signals.2 A recent study using diffusion- and perfusion-weighted images revealed that the nature of this abnormal signal was vasogenic edema and venous congestion.3 If those abnormal signals were associated with venous congestion, collecting veins of them might have higher concentration of deoxyhemoglobin than those without abnormal signals, due to prolonged transit time via capillary structures.
Using phase information of MR images and acquired susceptibility values of venous structures, the oxygenation status of structures of interest can be evaluated.4 In this work, we applied quantitative susceptibility mapping (QSM) to patients with DVA, and assessed the effect of venous congestion to susceptibility value of collecting veins of DVA.
Methods
Using radiology data base, we identified 16 patients with supratentorial DVA and no other lesion on brain MRI, which included 3D gradient echo image (GRE). At 3T MRI, single- or multi-echo 3D GRE images were acquired under clinical circumstances. Acquisition parameters are as follows: for single echo data, TR 28 msec, TE 20 msec, FA 15°, voxel size 0.72 x 0.72 mm, slice thickness 2 mm; for multi-echo data, TR 30 msec, TE 7.2/13.4/19.6/25.8 msec, FA 17°, voxel size 0.43 x 0.43 mm, slice thickness 2 mm. QSM was reconstructed using the iLSQR method from phase images after background phase removal.5,6
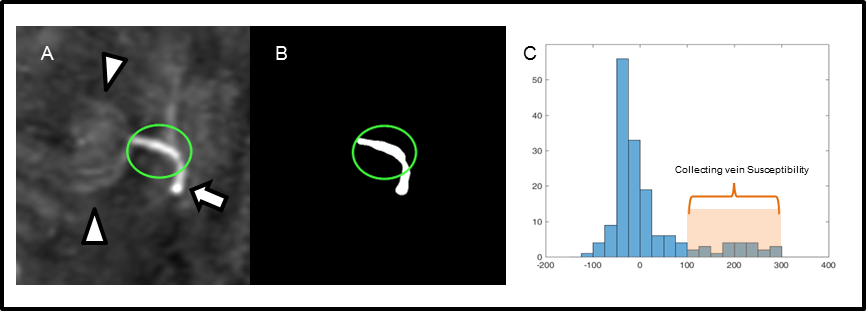
To evaluate oxygen metabolism, susceptibility value of draining vein and its surrounding brain parenchyma without abnormal signal were measured on QSM images (Figure 1). Diameters of collecting veins were measured on QSM, to minimize blooming artifact of venous structure noted on SWI, or partial volume averaging on conventional 2D T2-weighted images. On T2-weighted images or FLAIR images, area of abnormal signal intensity was measured using semi-automatically drawn ROI using region growing algorithm (itk ConnectedThresholdImageFilter).7 Clinical and MR measurements were compared between DVAs with abnormal signal and those without, using student’s t-test or Mann-Whitney U test. In addition, correlation between susceptibility value of draining veins and their diameter was assessed.
Results
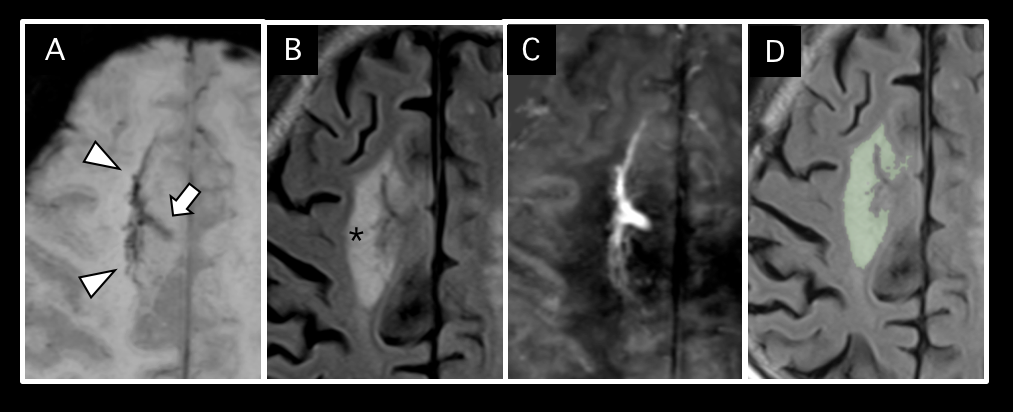
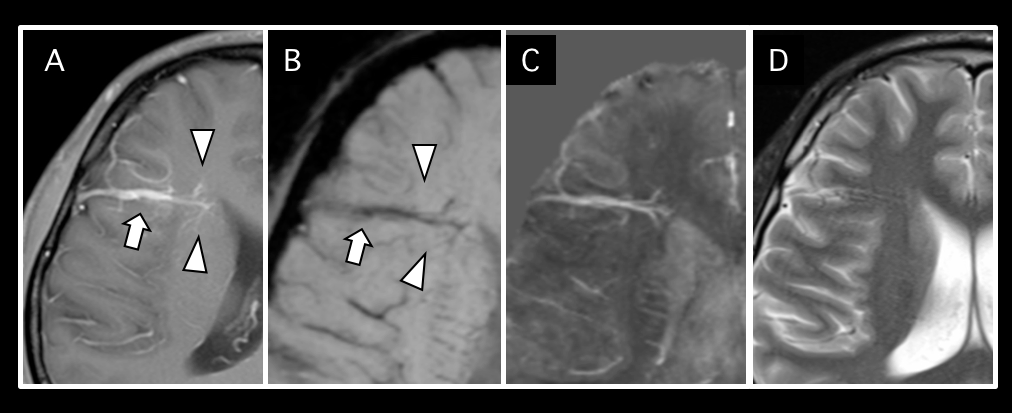
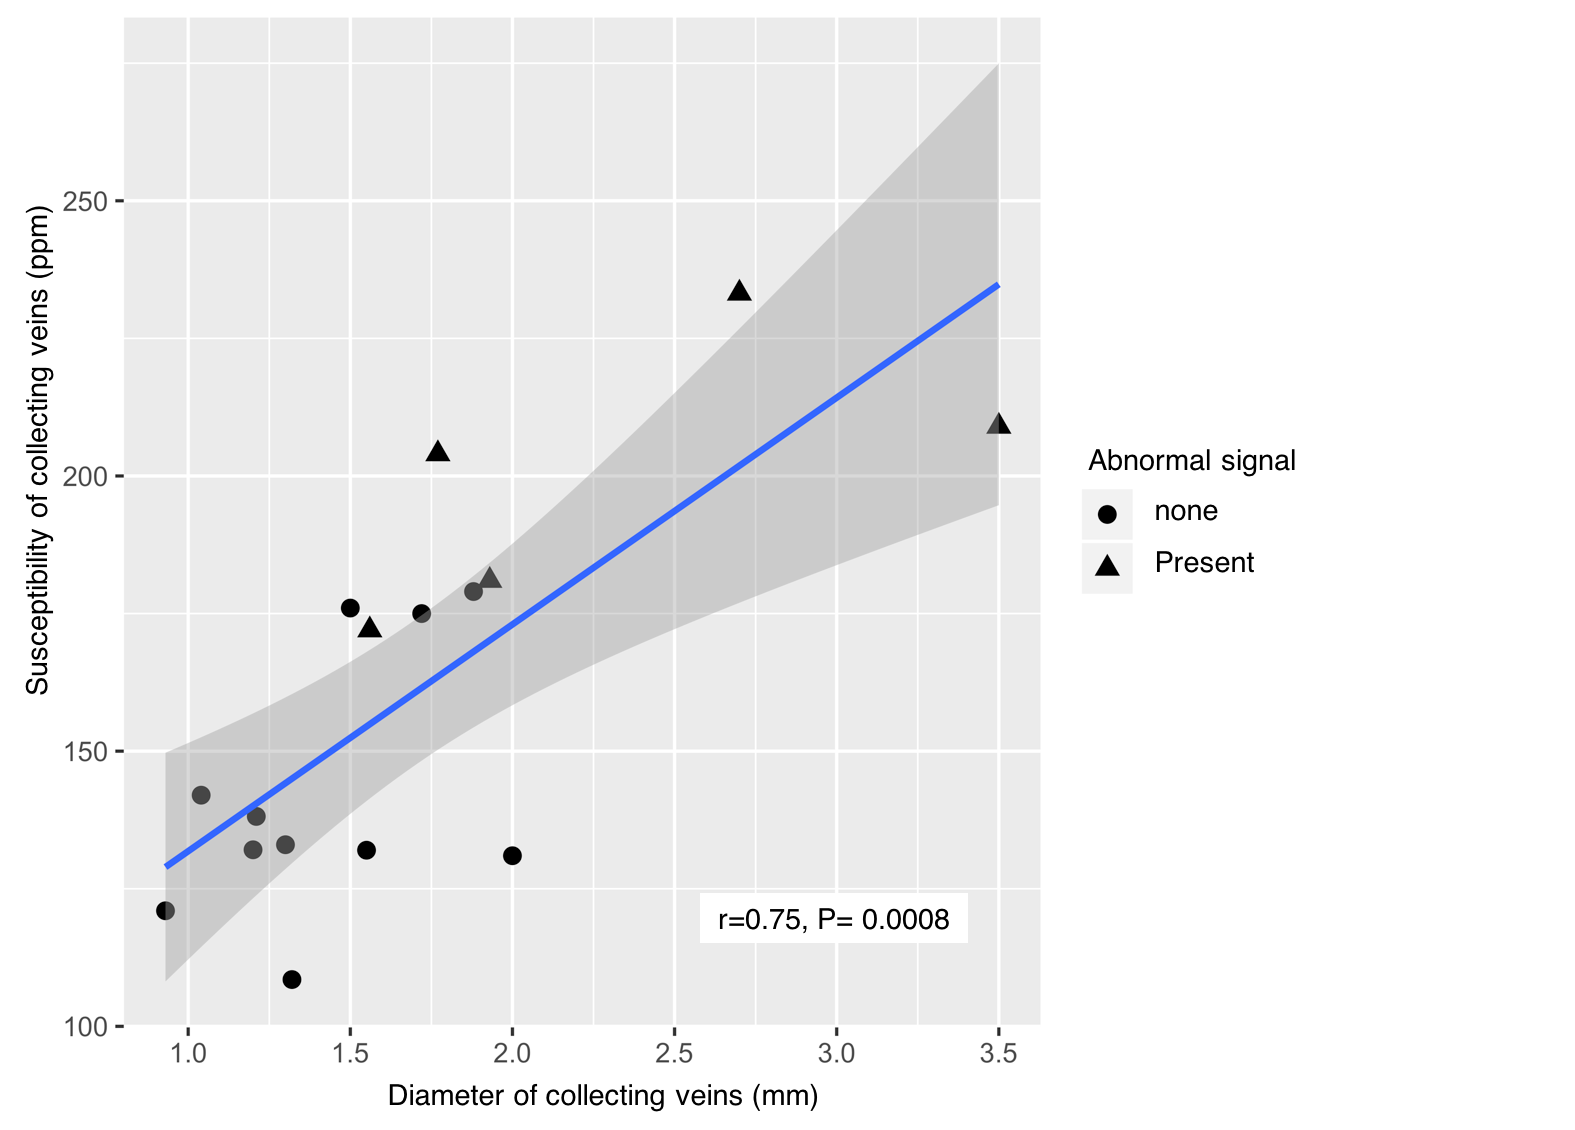
Among 16 DVAs, 5 DVAs (Group A) showed abnormal signal in draining area and the other 11 (Group B) showed no parenchymal signal change on T2-weighted image (Figure 2). Susceptibility of draining vein of Group A (199.8 ± 24.2, Figure 3) was significantly higher than that of Group B (142.5 ± 23.6, P=0.001, Figure 4). However, susceptibility of background tissue around the draining vein was not significantly different in two groups (Figure 2). Age of Group A was significantly higher than that of Group B. Susceptibility of collecting veins was positively correlated with diameter of them (r=0.75, P=0.0007, Figure 5).Discussion
To estimate regional oxygen metabolism, it is crucial to define specific venous structures which get venous drainage of interested brain area.4 However, due to variation of venous system of the brain, it is not easy to define specific regional veins. On the contrary, in DVA, defining a specific vein which gets venous drainage of interested brain tissue is relatively clear, because of the presence of a single collecting vein.
In this study, we observed that DVAs with venous congestion, or abnormal signal intensity (Group A) showed higher susceptibility of draining vein than those without (Group B). This result supported our hypothesis that draining vein of DVA with venous congestion had higher concentration of deoxyhemoglobin within the collecting veins. In addition, old age of Group B suggest that the long term venous congestion might result parenchymal abnormal signal.
There was positive correlation between diameter of collecting veins and their susceptibility values. Because the collecting veins of DVAs are embryonic remnant structures, and they might be insufficient venous draining compared to normal venous systems. Therefore, brain areas draining via DVA might be prone to venous congestion. Our result suggested that large DVAs were more likely to have ‘insufficient venous drainage’ than those with small area to be drained into them.
Conclusion
DVAs with venous congestion showed higher susceptibility values in collecting veins than those without venous congestion. Using 3D GRE and QSM, we could assess the oxygen metabolism of brain tissue with venous congestion.Acknowledgements
The authors would like to thank Jinkyeong Sung for her help with manuscript preparation.References
1. Amemiya S, Aoki S, Takao H. Venous congestion associated with developmental venous anomaly: findings on susceptibility weighted imaging. Journal of magnetic resonance imaging : J Magn Reson Imaging. 2008;28:1506-1509
2. Takasugi M, Fujii S, Shinohara Y, Kaminou T, Watanabe T, Ogawa T. Parenchymal hypointense foci associated with developmental venous anomalies: evaluation by phase-sensitive MR Imaging at 3T. AJNR Am J Neuroradiol. 2013;34:1940-1944
3. Jung HN, Kim ST, Cha J, Kim HJ, Byun HS, Jeon P, et al. Diffusion and perfusion MRI findings of the signal-intensity abnormalities of brain associated with developmental venous anomaly. AJNR Am J Neuroradiol. 2014;35:1539-1542
4. Wehrli FW, Fan AP, Rodgers ZB, Englund EK, Langham MC. Susceptibility-based time-resolved whole-organ and regional tissue oximetry. NMR Biomed. 2016
5. Li W, Avram AV, Wu B, Xiao X, Liu C. Integrated Laplacian-based phase unwrapping and background phase removal for quantitative susceptibility mapping. NMR Biomed. 2014;27:219-227
6. Li W, Wang N, Yu F, Han H, Cao W, Romero R, et al. A method for estimating and removing streaking artifacts in quantitative susceptibility mapping. NeuroImage. 2015;108:111-122
7. Yoo TS, Ackerman MJ, Lorensen WE, Schroeder W, Chalana V, Aylward S, et al. Engineering and algorithm design for an image processing API: A technical report on ITK--the insight toolkit. Stud Health Technol Inform. 2002;85:586-592.
Figures