2441
Automated Brain Tissue and Myelin Volumetry Based on Quantitative MR Imaging with Variable In-plane Resolutions1Radiology, Juntendo University, Tokyo, Japan, 2Radiology, The University of Tokyo Graduate School of Medicine, Tokyo, Japan, 3Radiological Sciences, Tokyo Metropolitan University Graduate School of Human Health Sciences, Tokyo, Japan
Synopsis
Automated brain tissue segmentation and volumetric assessment based on the quantification of the T1 relaxation time, T2 relaxation time and the proton density (PD) have demonstrated good accuracy and reproducibility. Recently, an automated myelin volume calculation based on quantitative imaging also has been introduced. This study showed that automated brain tissue and myelin volumetry based on quantitative MR imaging with lower in-plane resolutions have good repeatability and can be obtained in short acquisition times, which is beneficial for follow-up study.
Purpose
Brain volumetry based on Magnetic Resonance Imaging (MRI) has been broadly used in the clinical setting for the assessment of many neurologic diseases.1 Automated brain tissue segmentation and volumetric assessment based on the quantification of the T1 relaxation time, T2 relaxation time and the proton density (PD) have demonstrated good accuracy and reproducibility.2-6 Quantitative MR imaging can also be used for measuring myelin volume.7 For follow-up study, examination with high repeatability and short acquisition time is desired. The purpose of this study was 1) to show the reproducibility of the automated brain tissue and myelin volumetry by quantitative imaging and 2) to validate the reproducibility of the automated brain tissue and myelin volumetry with low in-plane resolution images.Methods
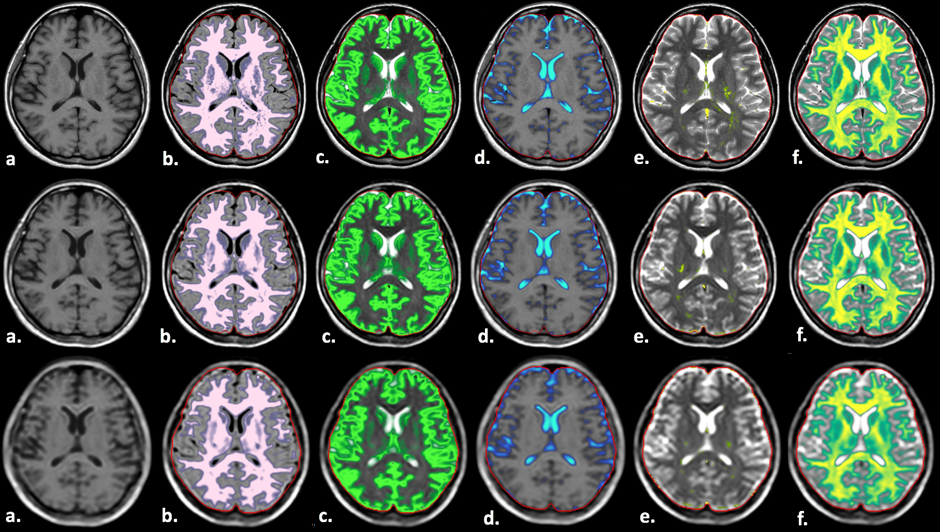
MR system at 1.5 T (Achieva, Philips Healthcare, Best, the Netherlands) was used for all imaging of 6 healthy controls. Quantification of T1, T2, and PD was performed with QRAPMASTER method that consists of multi-slice, multi-echo and multi-delay acquisition. Three in-plane resolutions; 0.8 mm (standard protocol in our institution for quantitative imaging), 2 mm, and 3 mm with slice thickness of 4 mm; number of slice, 30 were used and scanning times were recorded. Other parameters for quantitative MR imaging are as follows; FOV of 230 mm x 190 mm, matrix size of 288 x 214 for 0.8 mm, 116 x 88 for 2 mm, and 76 x 53 for 3 mm in-plane resolutions. To measure the test-retest repeatability, the healthy controls were scanned twice for each in-plane resolution. Brain was segmented as WM; GM; CSF; Non-WM/GM/CSF; myelin (Figure 1b-f). Brain parenchymal volume (BPV), the sum of WM and GM; intracranial volume (ICV), the sum of BPV and CSF; BPF, the ratio of BPV to ICV; and MYF, the ratio of myelin to ICV were also automatically calculated. The repeated measurements error within the same subject was predicted with the repeatability, which is 2.77 * sw.2-3, 8 Sw, or within-subject standard deviation was estimated as the square root of the mean within-subject variance. This repeatability was based on the assumption that the difference between any two measurements of the same subject is expected to be less that this for 95% of pairs of observations. The repeatability of each tissue type was related to ICV. The within-subject coefficient of variation (CoV) was also calculated.2-3, 8 Finally, the relative percentage error between lower in-plane resolutions and the standard protocol were also recorded.Results
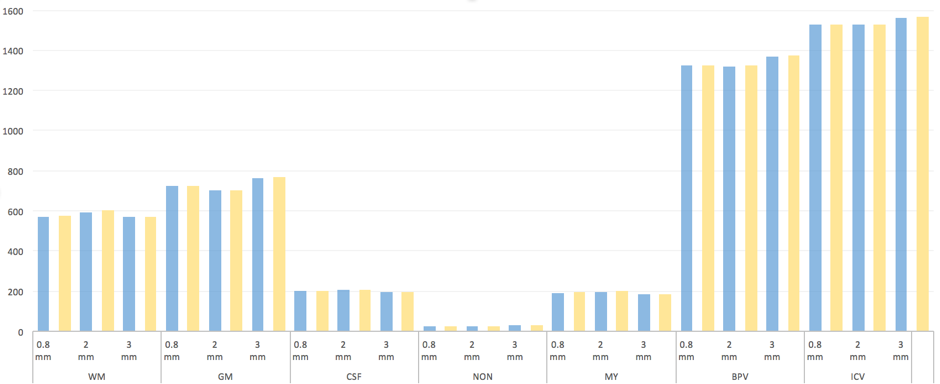
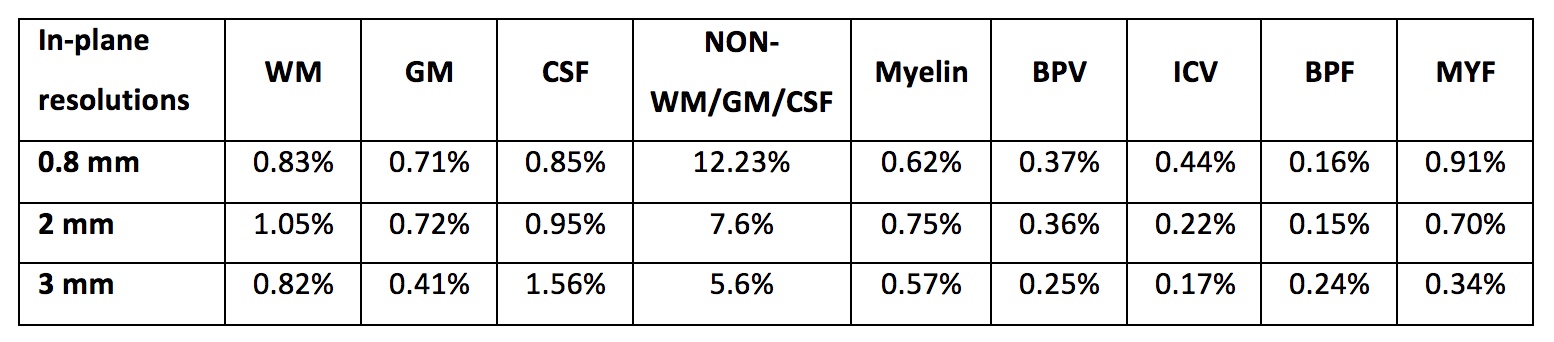
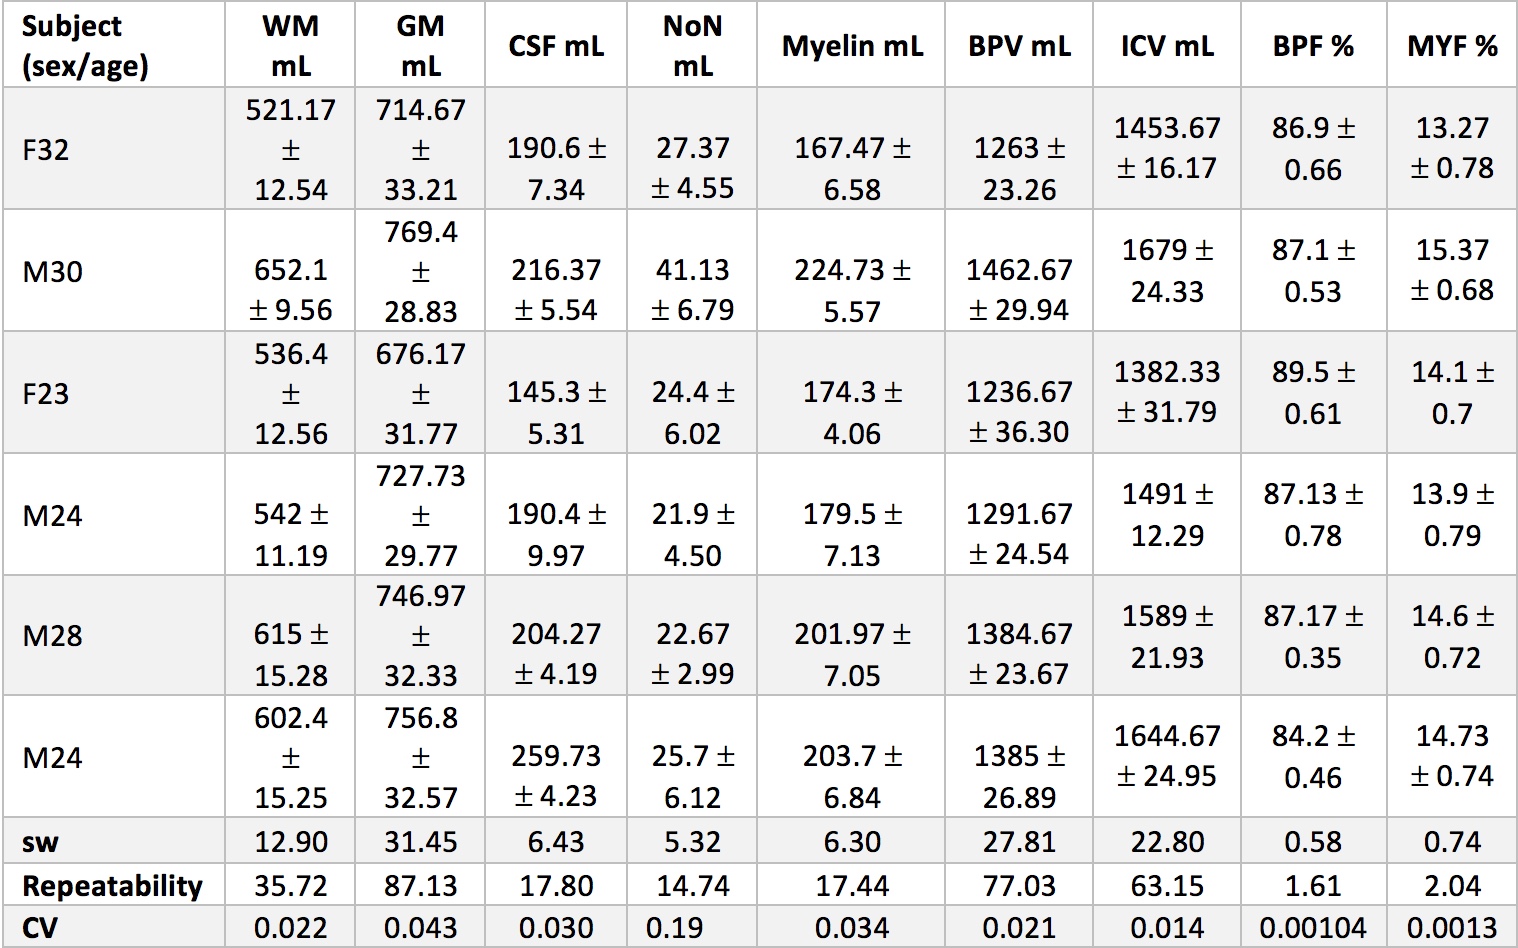
The scan time for 0.8 mm, 2mm, and 3 mm in-plane resolutions were 7'24", 3'9", and 1'56", respectively. Results of CoV of repeated scans for each in-plane resolution are reported in Table 1. Comparisons of measured volumes of repeated scans of each segmented area and each in-plane resolution are shown in Figure 2. The repeatability of each tissue type (WM, GM, CSF, Non-WM/GM/CSF, Myelin, BPV) related to ICV was; 1.00%, 0.98%, 0.40%, 0.87%, 0.26%, 1.18% in 0.8 mm; 1.42%, 1,01%, 0.48%, 0.38%, 0.33%, 1.22% in 2 mm; and 1.22%, 0.80%, 0.75%, 0.43%, 0.29%, 1.19% in 3 mm in-plane resolutions. Results of each subject for the comparison of three in-plane resolutions are reported in Table 2. The repeatability of each tissue type related to ICV was 2.32%, 5.66%, 1.16%, 0.96%, 1.13%, and 5% for WM, GM, CSF, Non-WM/GM/CF, myelin, and BPV, respectively. Relative percentage errors between 0.8 mm and 2mm, and 0.8 and 3 mm were as follows: 3.54% for WM, 2.76% for GM, 2.67% for CSF, 6.77% for Non-WM/GM/CSF, 2.18% for myelin, 0.1% for BPV, 0.043% for ICV; 0.32% for WM, 8.06% for GM, 3.14% for CSF, 27.95% for Non-WM/GM/CSF, 4.08% for myelin, 3.49% for BPV, and 2.32% for ICV.Discussion
Brain volumetry based on quantitative MRI with in-plane resolutions 0.5-1 mm had shown a good agreement to the reference method4-6, so in this study we compared lower in-plane resolutions with standard protocol in our institution with the aim to get the shorter acquisition time. Lower in-plane resolutions (2 mm and 3 mm) resulted in poorer image quality compared to 0.8 mm in-plane resolution as shown on synthetic T1-weighted images in Figure 1a., which may not be appropriate for diagnostic purpose. Each in-plane resolution showed good test-retest reproducibility, except for the Non-WM/GM/CSF. Similar to the previous study2, some differences was found between the multiple acquisition resolutions. This difference may have been caused by the partial volume effect.2Conclusion
Automated brain tissue and myelin volumetry based on quantitative MR imaging with lower in-plane resolutions have a good repeatability and can be obtained in short acquisition times, which is beneficial for follow-up study.Acknowledgements
The authors declare no conflict of interestReferences
1. Giorgio A, De Stefano N. Clinical Use of Brain Volumetry. J. Magn. Respn. Imaging 2013;37:1-14.
2. West J, Warntjes JBM, Lunberg P. Novel Whole Brain Segmentation and Volume Estimation Using Quantitative MRI. Eur radiol 2012;22:998-1007.
3. West J, Blystad I, Engström M, Warnjtes JBM, Lunberg P. Application of Quantitative MRI for Brain Tissue Segmentation at 1.5 T and 3.0T Field Strengths. PLOS ONE 2013;8:9.
4. Ambarki K, Lindqvist T, Wåhlin A, Petterson E, Warntjes JBM, Birgander R, et al. Evaluation of Automatic Measurement of the Intracranial Volume Based on Quantitative MR Imaging. AJNR Am J Neuroradiol 2012;33:1951-56.
5. Vågberg M, Lindqvist T, Ambarki K, Warntjes JBM, Sundström P, Birgander R, et al. Automated Determination of Brain Parenchymal Fraction in Multiple Sclerosis. AJNR Am J Neuroradiol 2013;34:498-504.
6. Granberg T, Uppman M, Hashim F, Cananau C, Nordin LE, Shams S, et al. Clinical Feasibility of Synthetic MRI in Multiple Sclerosis: A Diagnostic and Volumetric Validation Study. AJNR Am J Neuroradiol 2016.
7. Warntjes M, Engström M, Tisell A, Lunberg P. Modeling the Presence of Myelin and Edema in the Brain Based on Multi-Parametric Quantitative MRI. Front. Neurol. 2016;7:16.
8. Bland JM, Altman DG. Measurement error. BMJ 1996;312:744.
Figures