2438
Fully automated morphometric brain volume extraction vs FreeSurfer1University of Newcastle, Callaghan, Australia, 2Princess Alexandra Hospital, Woolongabba, Australia, 3Siemens Healthcare, Macquarie Park, Australia, 4Siemens Healthcare, Lausanne, Switzerland
Synopsis
Brain architecture has been shown to change with different disease processes and this can be quantitatively measured using automated brain segmentation methods. FreeSurfer is a validated automated brain morphometry analysis method but requires time-consuming post-processing and is computationally complex. Fully automated prototype brain morphometry post-processing is available on our scanner, which generates brain morphology data at the end of the sequence acquisition and doesn’t require manual post-processing. This study confirms that this prototype software yields brain morphology data that is highly correlated to FreeSurfer for major brain regions. Therefore, it can be used to investigate biomarkers of brain atrophy in research and clinical research arenas.
Introduction
Computer-aided and quantitative analysis of structural MRI show increasing promise for guiding clinicians in diagnosis or follow-up assessment in a wide range of neurological disorders1. Consequently, a number of automated brain segmentation methods have been developed and increasingly used as cloud-based analyses are progressively becoming available. Clearly targeted for research purposes, FreeSurfer (Martinos Centre for Biomedical Imaging, Harvard-MIT, Boston USA) is probably the most widely used and established brain segmentation technique2. This software has a high computational complexity which is acceptable in an academic setting but may restrict its use in routine clinical practice. Therefore, we investigate the potential of a fast inline (on scanner) brain morphometry tool, referred to as the MorphoBox prototype [2] to provide volumes comparable with those estimated from Freesurfer. This software is fully integrated into the MR image reconstruction pipeline hence providing an optimal dataflow with no manual post-processing required.Purpose
This study will compare the morphometric data of the prototype inline software to that of FreeSurfer to investigate the validity of the results from the prototype software.Method
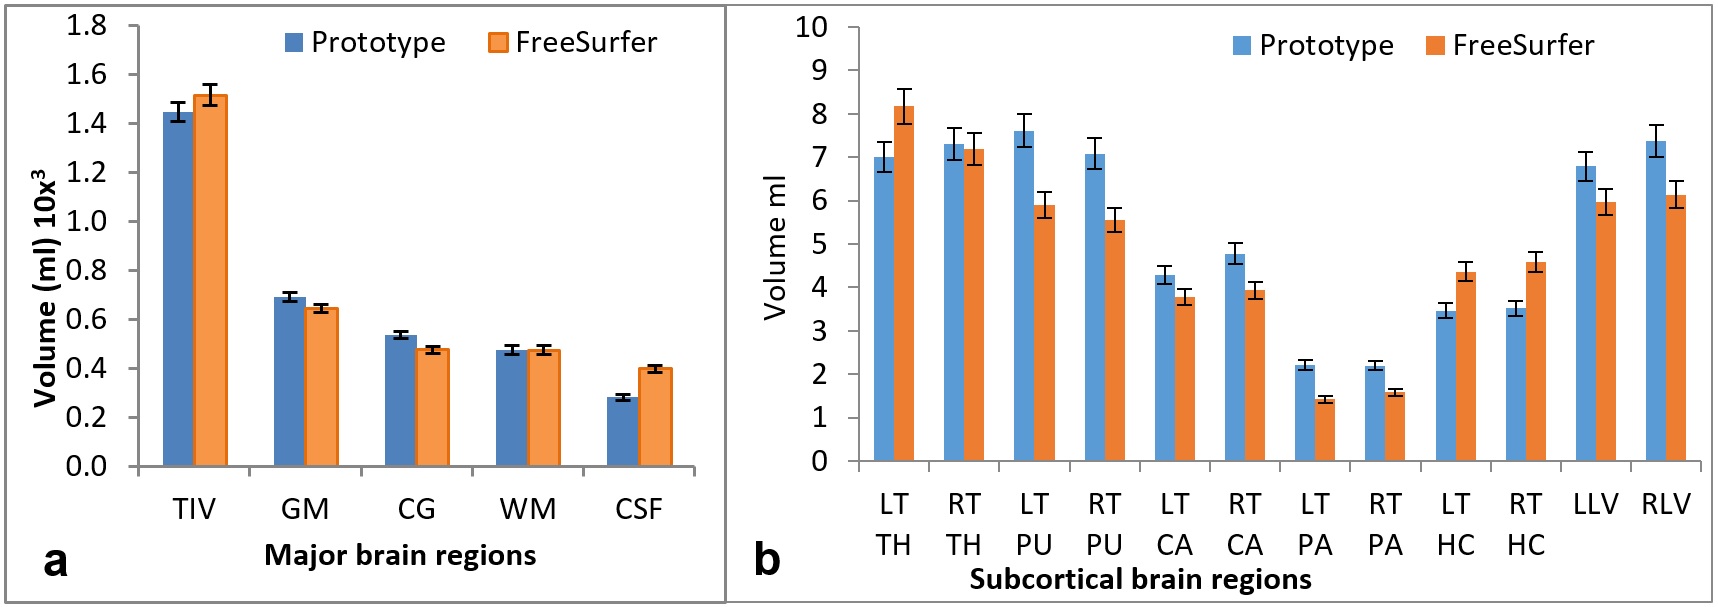
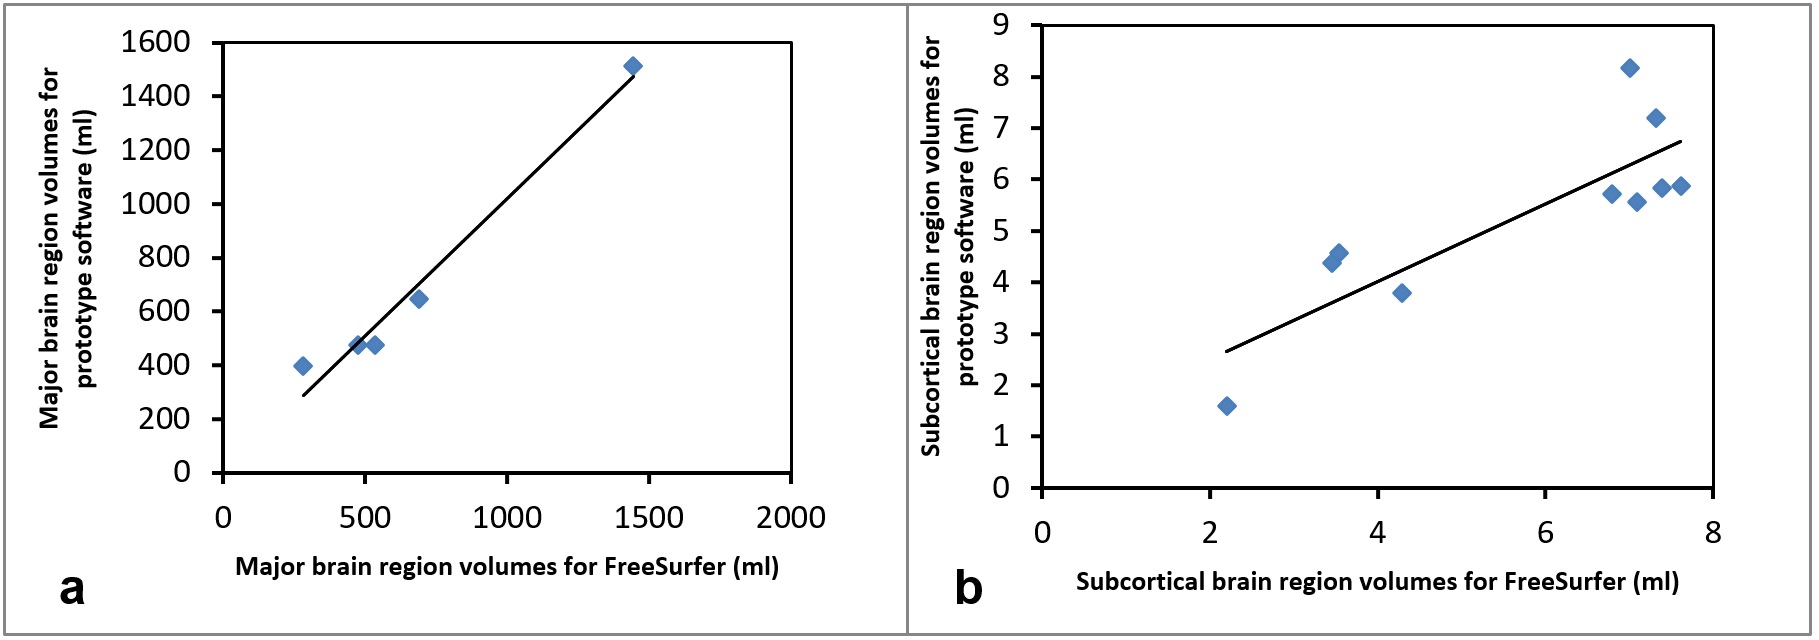
This study was approved by the local ethics review board, and all subjects were consented in writing. In vivo measurements were performed on a 3T MR system (MAGNETOM Prisma, VD13D, Siemens Healthcare, Erlangen, Germany) with a standard 64-channel Head/Neck coil. Ten healthy volunteers (5 males, 5 females) with mean age of 36.1±7.7 years were scanned once at the same time in the morning. The standard 3D T1-weighted 1mm isotropic MPRAGE3 sequence was acquired on each subject at each time point, with the automated morphometry post-processing prototype option selected. A brain morphometry report was generated immediately after the sequence acquisition with volumes for total brain and segmented sub-areas. The T1 MPRAGE datasets were analyzed using FreeSurfer software (version 5.3.0), and the stats folder containing text files with volume summary information was used for this study (aseg.stats). Total intracranial volume (TIV), grey matter (GM), cortical grey matter (CG), white matter (WM), cerebrospinal fluid (CSF) and a list of subcortical regions including left(LT) and right (RT) thalamus (TH), putamen (PU), caudate (CA), pallidum (PA), hippocampus (HC), left lateral ventricle (LLV) and right lateral ventricle (RLV) were chosen for analysis. The above regions are commonly referred to in literature and correspond to different disease processes. Statistical analysis software (IBM SPSS statistics 24) was used to analyze the data, and Pearson correlation coefficient was assessed to compare the results from the prototype software to that of FreeSurfer data.Results and discussion
FreeSurfer and MorphoBox yielded significantly high positive correlation (r= 0.94, p= 0.0001) in major brain regions such as TIV, GM, CG and WM (Fig 1(a) and 2(a)) but moderate positive correlation in all subcortical regions (r=0.7, p=0.1) (Fig 1(b) and 2(b)). CSF showed moderate correlation, but was higher in FreeSurfer in spite of the fact that the latter does not include sulcal CSF4. Total CSF volume may not be comparable due to the different techniques both methods use to segment CSF. However, there was high correlation (r=0.9) of the CSF-filled total ventricular volume. Few of the basal ganglia structures on the left hemisphere had moderate to low correlation(r=0.34). These same structures on the right had higher correlation(r=0.8). While FreeSurfer uses prior knowledge by means of an atlas for structure segmentation, the MorphBox uses performs atlas-free and probability maps to label brain tissue voxels which accounts to some extent for partial volume5. This may cause discrepancy due to the very small volumes of the subcortical regions.Conclusion
The prototype morphometric analysis software can be confidently used to measure brain volume of major brain regions such as TIV, GM, CG and WM and has potential to be used to measure atrophy as a biomarker for different disease processors and for monitoring treatment effects. Immediate availability and the ease of use of this method will assist in more efficient and easy data analysis for research studies. The volumetric data can also be used clinically to quantitate brain atrophy accurately rather than the current qualitative methods performed by the radiologist which is subjective. Subcortical brain regions did not correlate as well and need further investigation. Comparison with a voxel-based morphometry method such as FSL may be helpful, which is the current step in this study. This prototype technique has the potential to be a powerful tool in MR imaging to be used as a brain morphometric method for major brain regions.Acknowledgements
NAReferences
1. Morey RA, Petty CM, Xu Y, et al. A comparison of automated segmentation and manual tracing for quantifying hippocampal and amygdala volumes. Neuroimage. 2009; 45(3): 855-866.
2. Dale, A.M., B. Fischl, and M.I. Sereno, Cortical surface-based analysis. I. Segmentation and surface reconstruction. Neuroimage, 1999. 9(2): p. 179-94.
3. Mugler, J.P., 3rd and J.R. Brookeman, Three-dimensional magnetization-prepared rapid gradient-echo imaging (3D MP RAGE). Magn Reson Med, 1990. 15(1): p. 152-7.
4. Quadrelli S, Mountford C, and Ramadan S. Hitchhiker's Guide to Voxel Segmentation for Partial Volume Correction of In Vivo Magnetic Resonance Spectroscopy. Magnetic Resonance Insights. 2016; 9:1-8.
5. Schmitter D, Roche A, Marechal B, et al. An evaluation of volume-based morphometry for prediction of mild cognitive impairment and Alzheimer's disease. Neuroimage Clin. 2015; 7:7-17.
Figures