2437
Selecting parcellation schemes for regional cortical thickness estimations using a machine learning approach1Department of Electrical Engineering, National Taiwan University of Science and Technology, Taipei, Taiwan, 2Department of Electrical Engineering, National Sun Yat-sen University, Taiwan
Synopsis
In this study, we present a systematic approach to derive effective MR biomarkers of cerebral cortical thickness using machine learning methods and a large-scale database. Three neuroanatomical parcellation schemes for assessing region cortical thickness were compared. The results supported using the Desikan–Killiany atlas1 of FreeSurfer produced robust results of age and gender predictions in normal subjects.
Purpose
Cerebral cortical thickness estimated MR T1 images have been shown a biomarker for investigating cortical morphology and disease states. Amount the publicly available tools, Freesurfer is widely used. The software tool automatically calculates CTs and provides several neuroanatomical parcellation schemes1-4 for regional CT measurements. For the clinical applications, a scheme that derives reliable CT measurements and disease classifications is highly desirable. In this study, we used machine-learning approaches and cross-validated the predicted results of large-scale data sets to select an appropriate parcellation scheme.Methods and materials
We used the publicly available IXI data set (566 T1-weighted volumes, 254 males and 312 females, average age is 48.40 ± 16.48, age range is 19.98~86.32 yr). The high resolution 3D T1 volumes were processed using FreeSurfer with three parcellation schemes: Desikan–Killiany (Aparc) protocol1 for 68 labels, Destrieux (A2009s) protocol2,3 for 148 labels and the Desikan–Killiany–Tourville (DKT) protocol4 for 62 labels. The average CT values of the cortical labels were stored in a spreadsheet for machine-learning analysis in the Python environment.
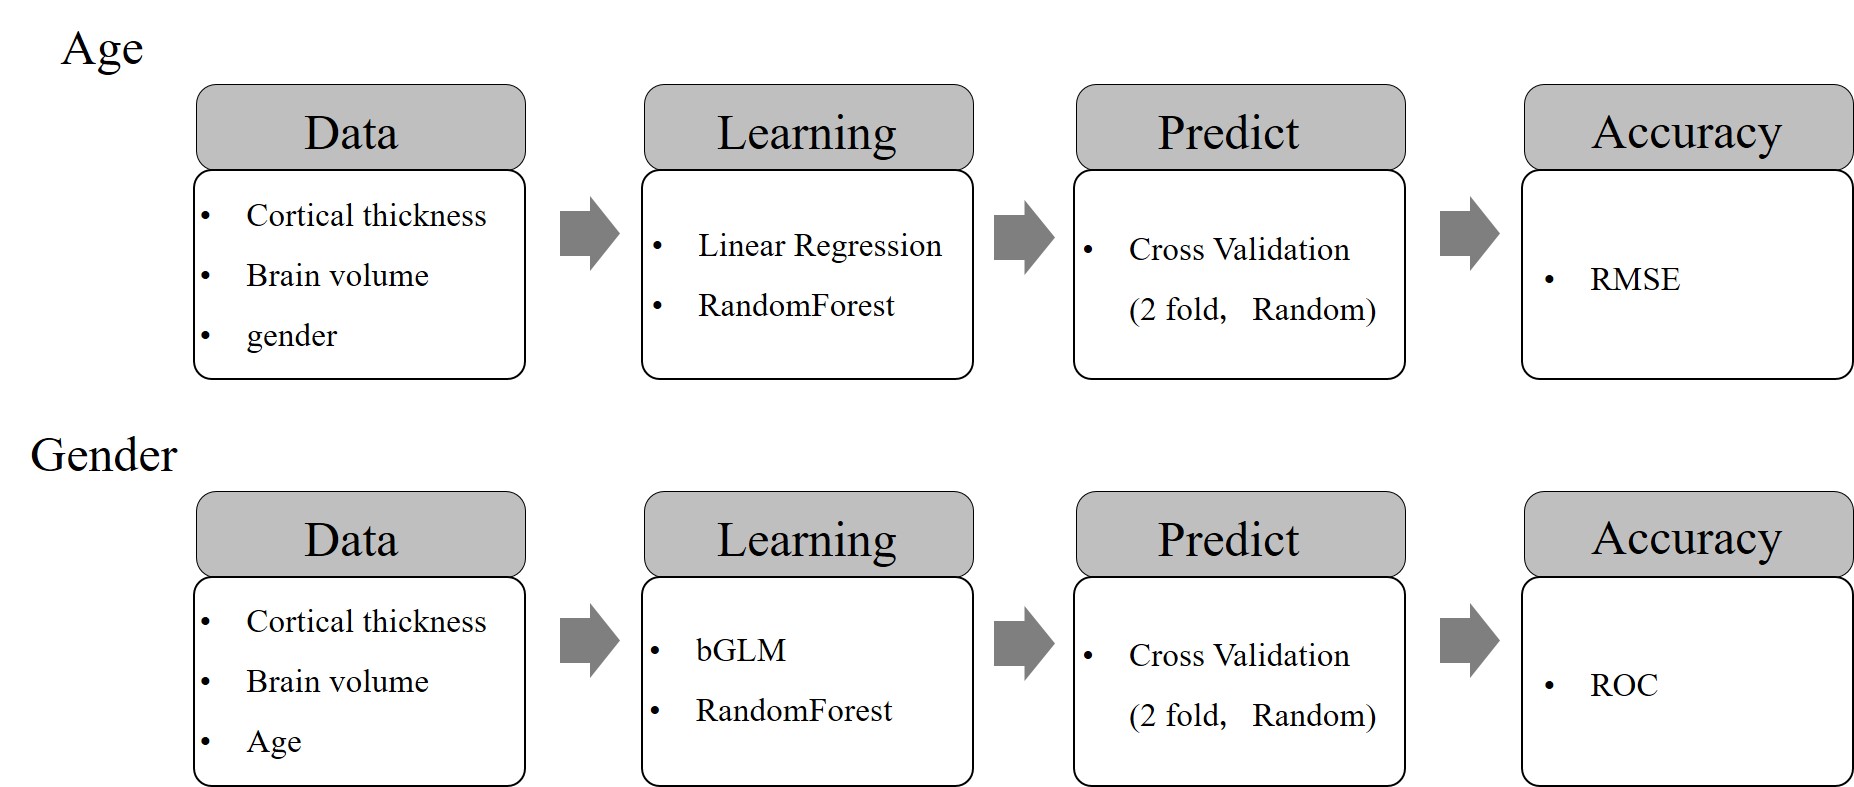
We assessed the accuracies of two predictive models, age versus CT and gender versus CT5, to identify the optimal parcellation schemes. Figure 1 displays the block diagrams of the data analysis. For age versus CT, we obtained results using linear regression and random forest regression (200 trees) with the linear model: $$AGE \sim VOLUME + GENDER + \sum_iT(labels_{i})$$
where T(labelsi) is the average thickness in each labels, and VOLUME is the intracranial volume. We used two-fold cross-validation with 1000 times randomly shuffles in training and testing data sets and measured the root mean square error of the predicted ages to evaluate the performance of predictions.
$$RMSE = \sqrt{\frac{\sum (AGE_{true}-AGE_{predicted} )^{2}}{N}}$$
For gender versus CT, we classified the genders of the subjects using the binomial generalized linear model (bGLM) with the model formula: $$GENDER \sim VOLUME + AGE + \sum_i T(labels_{i})$$ We used two-fold cross-validation with 1000 times of randomly shuffles in training and testing data sets. We compared the predicted genders obtained from the testing data sets with the ground truth and varied the threshold of gender classification to calculate the average area under curve (AUC) of the receiver operation curve (ROC) of the 1000 cross-validations.
Result
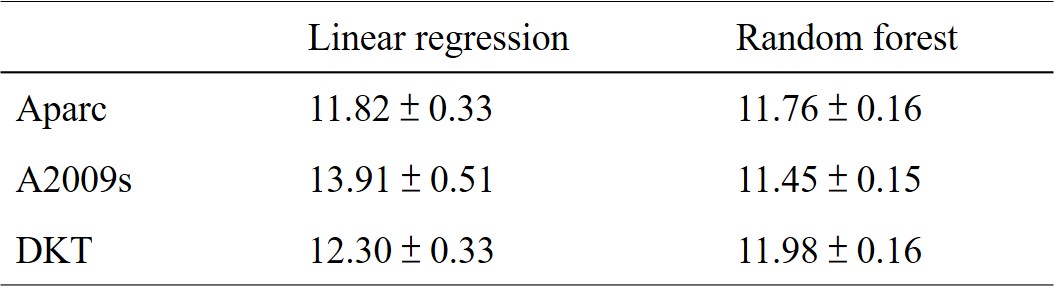
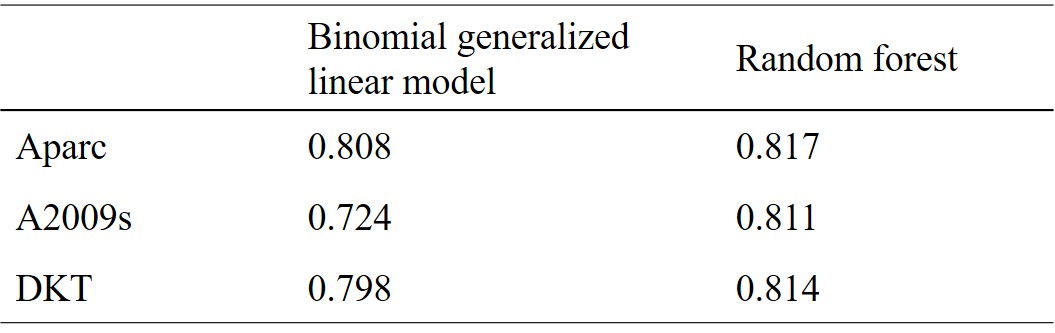
Figure 2 displays the distributions of the RMSEs of the age predicted by the six combinations of the three parcellation schemes and the two prediction methods in cross-validations. The mean RMSEs are listed in Table 1. Using linear regression, the mean RMSE of Aparc data sets was prominently lower than those of A2009s and DKT data sets. When the random forest was used, the RMSEs of A2009s and DKT were significantly reduced and the distributions of the RMSEs of the three data sets were more concentrated. Figure 3 shows the ROC curves of the gender classifications of the 6 combinations. Table 2 listed the corresponding mean AUC values. Notice that the AUCs of the Aparc data sets are higher than those of A2009s and DKT using both classification algorithms. The random forest algorithm prominently increased the AUCs of A2009s data sets.Discussion and Conclusions
In this study, we attempted to identify a suitable parcellation scheme of cortical thickness measurements for machine learning. We used a large-scale database and a cross-validation approach to systematically evaluate the prediction efficacy using three schemes. Amount all comparisons, the Aparc parcellation scheme mostly outperformed the other two schemes. The A2009s scheme in cooperated with the random forest algorithm provided the best age prediction. Notice that the A2009s data sets analyzed with the linear regression and bGLM produced the highest RMSE of the age prediction and the lowest AUC of the gender classification, respectively. The huge differences of A2009s data sets could be due to the amount of labels in the data sets (Aparc: 68, A2009s: 128, DKT: 62). The large number of CT features in A2009s may hamper the solutions of the linear models. The random forest algorithm inherently ranks the feature importances and thus may avoid the above problem. In summary, the overall comparison supports that the Aparc scheme provides stable and greater prediction accuracies. When A2009 is selected, a machine learning algorithm including a feature selection procedure should be used.Acknowledgements
Supported by the Ministry of Science and Technology under grants 104-2221-E-011 -064 -MY3References
[1] Desikan, R. S., Segonne, F., Fischl, B., Quinn, B. T., Dickerson, B. C., Blacker, D., et al. An automated labeling system for subdividing the human cerebral cortex on MRI scans into gyral based regions of interest. Neuroimage. 2006; 3, 968–980.
[2] Destrieux, C., Fischl, B., Dale, A., and Halgren, E. Automatic parcellation of human cortical gyri and sulci using standard anatomical nomenclature. Neuroimage. 2010;53, 1–15.
[3] Destrieux, C., Halgren, E.,Fischl, B., M.I. Sereno Variability of the human brain studied on the flattened cortical surface. Soc. Neurosci. 1998;p. 1164 Los Angeles, CA.
[4] Klein, A., Tourville, J. 101 labeled brain images and a consistent human cortical la-beling protocol. Front. Neurosci. 6, 171.
[5] Tustison, NJ, Cook, PA, Klein, A,Song, G, Das, SR, Duda, JT, Kandel, BM, van Strien, N, Stone, JR, Gee, JC, Avants, BB Large-scale evaluation of ANTs and FreeSurfer cortical thickness measurements. NeuroImage99. 2014;166–179.
[6] Breiman, L. Random forests. Machine Learning, 2001; pp. 5–32.
Figures