2435
COMPARISON OF BRAIN ATROPHY MEASURES FOR CLINICAL USE IN MULTIPLE SCLEROSIS1Neuroimaging Research Unit, San Raffaele Scientific Institute, Vita-Salute San Raffaele University, Milan, Italy, 2R&D icometrix Leuven Belgium, Leuven, Belgium, 3Department of Medicine, Surgery and Neuroscience, University of Siena, Siena, Italy, 4Department of Radiology, Hospital Universitari Vall d'Hebron, Barcelona, Spain, 5Centre d'Esclerosi Múltiple de Catalunya (Cemcat), Department of Neurology/Neuroimmunology, Hospital Universitari Vall d'Hebron, Universitat Autònoma de Barcelona, Barcelona, Spain, 6Nuffield Department of Clinical Neurosciences, University of Oxford, Oxford, United Kingdom
Synopsis
Aim of this study was to test two available methods (FSL-SIENAx/SIENA and Icometrix-MSmetrix) used for brain atrophy estimation on MR images of multiple sclerosis (MS) patients for a future clinical use. The accuracy and precision of these methods, as well as their main steps, were evaluated on 3D-T1 and 3DT2-FLAIR sequences of a simulated dataset, MRI of MS patients acquired at different scanners, field strengths, and on longitudinal dataset. From the comparison, SIENAx/SIENA showed a worst image registration, brain extraction and higher dependence on image acquisition quality than MSmetrix software. FSL pipelines showed better accuracy for cross-sectional and longitudinal analysis.
Purpose
Neurodegeneration, in particular of the grey matter (GM), is one of the pathological hallmarks of multiple sclerosis (MS) and it represents one of the target outcomes of current therapeutic strategies for these patients. Several software tools for GM and brain atrophy measurement on MRI are currently available.1-4 However, the situation on these methods is fragmentary, since there is no validated technique that can be used in a clinical setting.5 The aim of this study is to test the validity and variability of two available methods (FSL-SIENAx/SIENA 5.0.1 version and Icometrix-MSmetrix 1.3 version) used to estimate GM and brain atrophy in MS, through the evaluation of each critical step that comprises the pipeline, as well as its final result.Methods
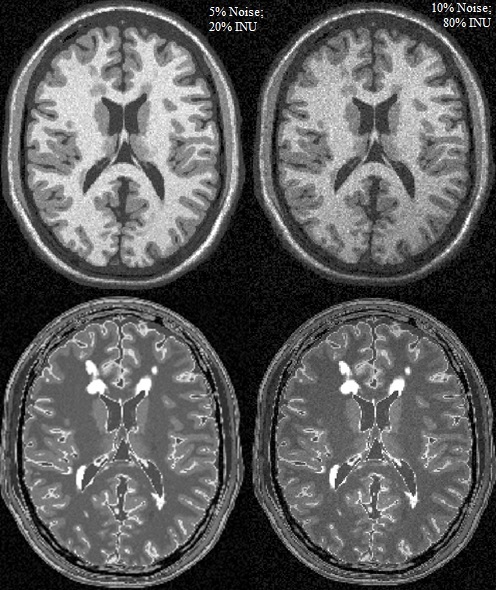
A wide dataset composed by 3DT2-FLAIR and 3DT1-weighted MRI sequences was arranged. It consisted of 1) simulated data with different levels of noise, intensities non-uniformities and mild and severe lesion loads; 2) 10 MS patients with a scan/rescan MRI, acquired within the same day on a 3T Siemens, 3T Philips, and 3T GE scanners (all patients were acquired on all MR scanners); 3) 16 MS patients with two scans acquired on the same day on both a 1.5T Philips and a 3T Philips scanner; 4) MRI scans of 24 patients acquired in a multicenter (2 centers) context at baseline and 1 year follow-up. A MRI simulator was developed for the creation of the simulated data. The digital brain phantoms with mild and severe lesion load (respectively 0.42 and 10.1 ml), tissue MR parameters and Intensity non-uniformity (INU) fields available from BrainWeb6 were used. Standard 1.5T parameters were included into the Steady-state Bloch equation to obtain T1-weighted and FLAIR sequences (Figure 1):
$$S(x,y,z)=ρ(x,y,z)|1-2exp(-TI/T_1(x,y,z))|*[1-exp(-TR/T_1(x,y,z))]*exp(-TE/T_2(x,y,z))$$
For this study, the free available FSL-SIENAx/SIENA1 and the commercial IcoMetrix-MSmetrix,7 for both the cross-sectional and the longitudinal atrophy assessment, were selected. Both software were run on the dataset provided. In particular, for FSL-Brain Extraction Tool the optimized parameters according to a validation work were used.8 The main steps that compose each atrophy pipeline were identified and quantitative measures were formulated to assess each step: image registrations were evaluated using the percentage of normalized mutual information (NMI%) between the registered image and the reference one; brain extraction and lesion segmentation were assessed using the Dice similarity coefficient (DSC) against manual segmentation (gold standard). Lesion segmentation was evaluated only for MSmetrix software, since FSL does not include this step into the pipeline. Moreover, for both pipelines the accuracy in brain and GM volume calculation on simulated dataset was estimated considering the dependency on image noise, INU and lesion load.
$$ACCURACY(percentage)={1-[(VOLUME(measured) - VOLUME(real))/(VOLUME(real))]}*100$$
Finally, the precision in the estimation of the output (brain and GM volume) and the accuracy in longitudinal atrophy assessment were evaluated on repeated scan of MS patients.
Results
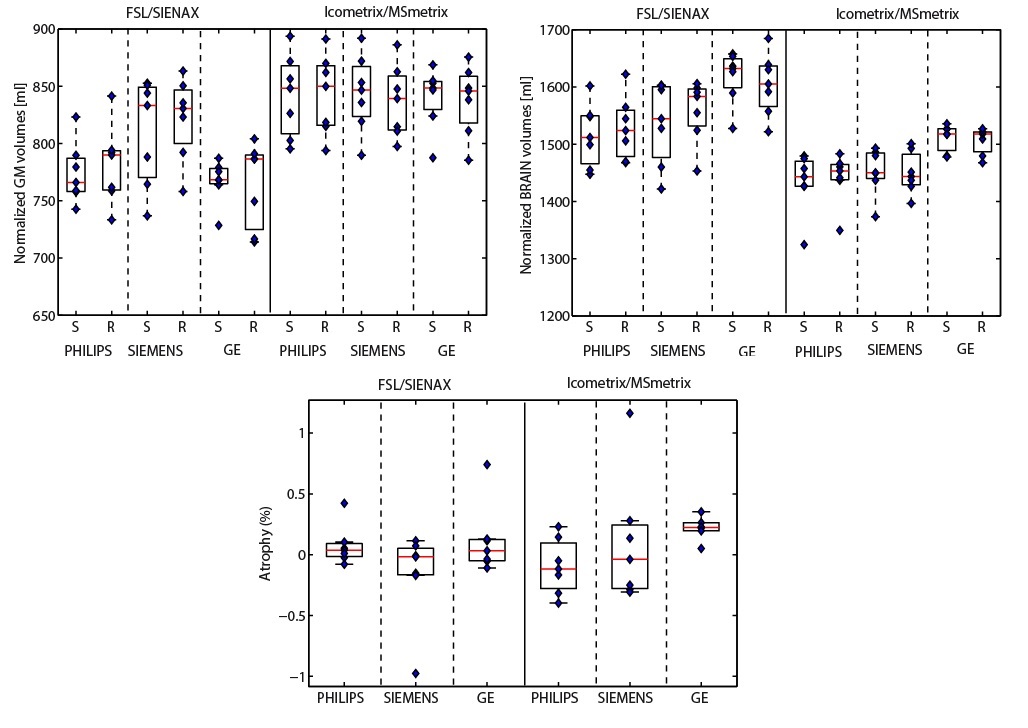
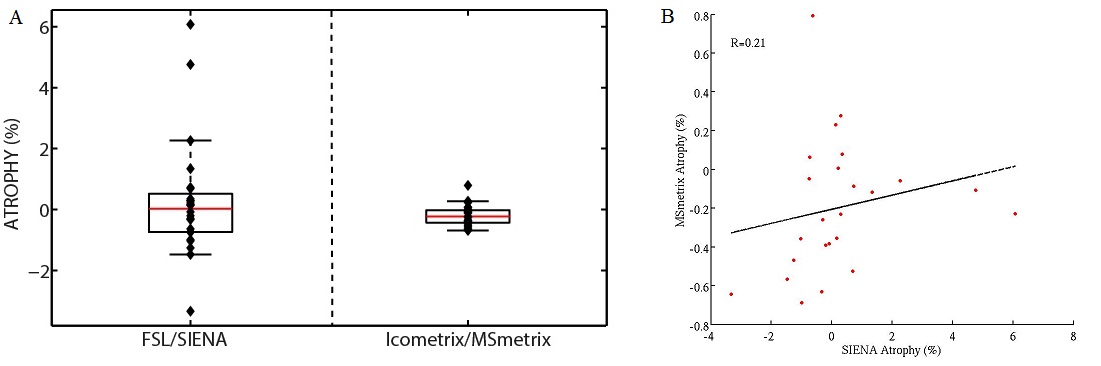
Mean NMI% values for the image registration performance between the two time-points MRI scans were respectively 71.2% and 59.8% for Icometrix and FSL. The mean DSC for Icometrix lesion segmentation was 0.2 for the 24 patients from the two centers, while mean DSCs values for brain extraction were respectively 0.96 and 0.93 for Icometrix and FSL. The accuracy values were obtained for both pipelines: for SIENAx was in the range 97.6%÷99.1%; while MSmetrix showed a range of 91.2%÷95.2% of accuracy. The results for the precision in GM and brain atrophy estimation are shown in Figure 2 and Figure 3 for the dataset of patients acquired on different MR scanners. The distributions of atrophy changes over a period of 1 year estimated for both pipelines are shown in Figure 4.Discussion
Both pipelines showed good results when run on this dataset. In particular, MSmetrix showed a slightly better image registration and brain extraction performance than the SIENAx/SIENA. MSmetrix showed not very high performance for lesion segmentation. Moreover, SIENAx showed a slightly better accuracy both for GM and brain volumes estimation and for longitudinal analysis than MSmetrix. Both software presented high reliability. FSL-SIENAx/SIENA showed higher dependence on image acquisition quality (MR field strength, scanner manufacturer, image movement artefacts) than Icometrix pipeline. The independence to image acquisition quality could not be necessarily considered as a positive remark if this implies less sensitivity to real brain structural changes. To better evaluate accuracy for cross-sectional atrophy assessment an introduction of others confounding factors on simulated images may be necessary.Acknowledgements
No acknowledgement found.References
[1] Smith S.M., De Stefano N., Jenkinson M,.et al. Normalised accurate measurement of longitudinal brain change. J Comput Assist Tomogr, 2001; 25(3):466-475.
[2] Jain S., Sima D. M., Ribbens A., Cambron M., et al. Automatic segmentation and volumetry of multiple sclerosis brain lesions from MR images. NeuroImage Clinical, 2015; 8, 367–375.
[3] Avants B.B., Tustison N.J., Wu J., et al. An Open Source Multivariate Framework for n-Tissue Segmentation with Evaluation on Public Data. Neuroinformatics. 2011; 9(4): 381–400.
[4] Chards D.T., Griffin C.M., Parker G.J.M., et al. Brain atrophy in clinically early relapsing-remitting multiple sclerosis. Brain, 2002; 125, 327–337.
[5] Derakhshan M., Caramanos Z., Giacomini P.S., et al. Evaluation of automated techniques for the quantification of grey matter atrophy in patients with multiple sclerosis. NeuroImage, 2010; 52(4), 1261-1267.
[6] BrainWeb: Simulated Brain Database. www.bic.mni.mcgill.ca/brainweb/.
[7] Smeets D., Ribbens A., Sima D.M., et al. Reliable measurements of brain atrophy in individual patients with multiple sclerosis. Brain and Behavior. 2016.
[8] Popescu V, Battaglini M, Hoogstrate WS, et al. Optimizing parameter choice for FSL-Brain Extraction Tool (BET) on 3D T1 images in multiple sclerosis. Neuroimage. 2012; 61(4):1484-94.
Figures