2431
Microstructural alterations in patients after liver transplantation and treated with calcineurin inhibitors – a quantitative MRI study1Institute for Neuroradiology, Hannover Medical School, Hannover, Germany, 2Department of Neurology, Hannover Medical School, Hannover, Germany, 3Clinic for Visceral and Transplant Surgery, Hannover Medical School, Hannover, Germany
Synopsis
With the aim to evaluate possible brain microstructural alterations associated with calcineurin inhibitor (CNI) therapy, ninety patients after liver transplantation (OLT) treated with different doses of CNI and 32 gender- and age-adjusted healthy volunteers were studied with quantitative MRI (qMRI). T1, T2, T2*, Proton density (PD) and phase changes (derived from susceptibility-weighted imaging, SWI) were measured in 18 brain regions (regions of interest, ROIs). The values were compared between the groups of patients and the controls, which showed significant differences between the groups, indicating alterations of brain microstructure in patients after OLT.
Purpose
Quantitative MRI (qMRI) could be used to detect microstructural alterations in human brain, e.g. by measuring the values of relaxation parameters T1, T2, T2*, and Proton density (PD), or phase changes (with susceptibility-weighted imaging, SWI) of the brain tissue. Considering possible neurotoxic side effects of calcineurin inhibitors (CNI) we carried out this qMRI study, with the aim to evaluate possible brain microstructural alterations associated with calcineurin inhibitor (CNI) therapy in patients after OLT.Methods
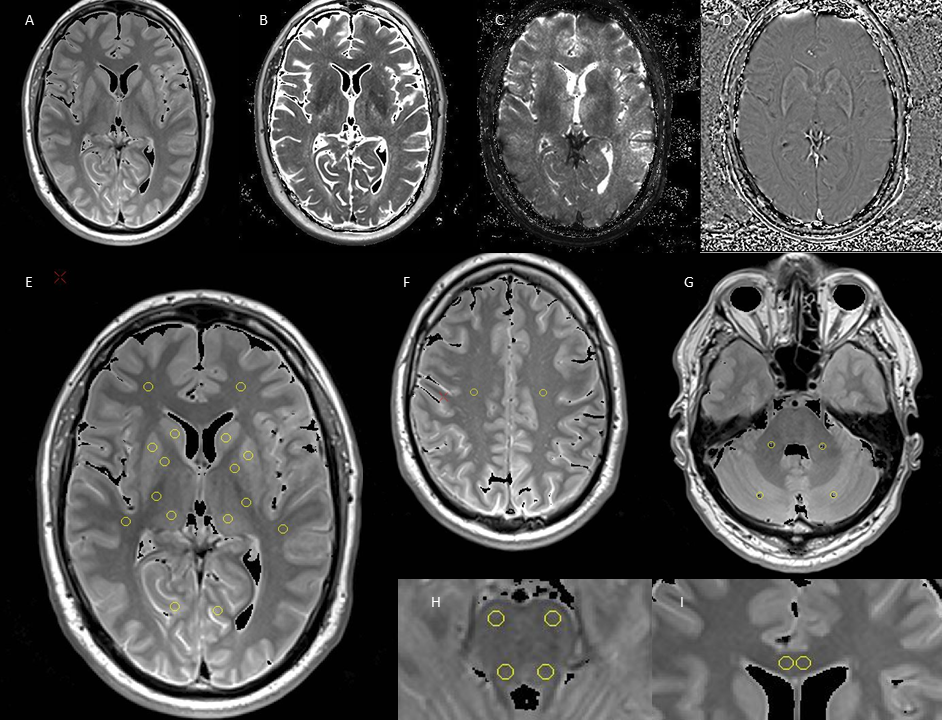
Ninety patients (mean age: 58±8 years) with a history of at least 3 years after OLT and 32 gender- and age-adjusted healthy volunteers were studied, who were divided into three patients groups according to their medication of the last two years: without CNI (n=23), with reduced dose of CNI (n =36, stable tacrolimus blood trough levels below 5µg/l or stable cyclosporine A blood trough levels below 50µg/l) and with standard dose of CNI (n=31, stable tacrolimus trough levels above 5µg/l or stable cyclosporine A trough levels above 50µg/l). Four patients were excluded due to incomplete examinations or artefacts. All subjects underwent the Repeatable Battery for the Assessment of Neuropsychological Status (RBANS) and MR examinations at 3T (Verio, Siemens, Erlangen). The MRI protocol included a transverse T2 weighted turbo spin echo (TSE) sequence with three echoes (triple TE) (TR/TE = 6640/8.7/70/131 ms; 150° flip angle; 256 x 208 matrix), a transverse T2* weighted gradient (GRE) echo sequence with triple TE (TR/TE = 1410/6.42/18.42/30.42 ms; 20°flip angle; 256 x 208 matrix; acceleration factor 2), a 3D T1 weighted GRE (TR/TE = 1500/1.63 ms, flip angle 5/26), and a 3D SWI weighted sequence (TR/TE = 28/20 ms). For scans a 256 x 208 mm FOV and a 3 mm slice thickness were used. Relative proton density (PD, in ratio to that of water phantom), T2, T2* and phase maps were obtained on-the-fly on the MR system with an extended image reconstruction provided by the manufacturer, and used for region of interest (ROI) measurements. Eighteen ROIs were selected located in cerebellum, brainstem, cerebral gray and white matter, respectively. One-way ANOVA with Bonferroni corrected post hoc analysis (α=0.05) were used to compare the qMRI data between groups.Results
qMRI measurements revealed significant (p<0.05) differences between the groups (for details on values and abbreviations see Table 1): In comparison to controls, 1) PD were higher in 6 ROIs (BSv, CSO, fWM, GCC, Pallidum, Putamen), T2 relaxation times were higher in fWM and GCC, and lower in iCapP, T2* values were higher in fWM and phase values were higher in GCC in patients without CNI therapy; 2) T2* but not T2 were higher in fWM and GCC in patients with low dose CNI. Within the patients, in comparison to patients without CNI therapy, PD were lower in BSd, BSv, CbWM, CSO, NC, Pallidum, Putamen and Thalamus, T2 were lower in GCC and higher in iCapP, phase were lower in GCC in patients with standard dose CNI and T2 was higher in iCapP in patients with low dose CNI. Additional, phase was lower in standard dose compared to low dose CNI therapy in GCC. Not negligible, little changes have been found in patients with standard CNI dose. In parallel, RBANS scores revealed that patients receiving CNI showed a significantly worse visuospatial/constructional ability, and patients with low dose CNI an overall impaired cognitive function compared to controls.Discussion
Altered PD, T2 and phase values were seen in patients with neurodegenerative changes1,3, altered T2* but not T2 in white matter was explained as reduced metabolism2. Therefore, although the detailed are not yet clear presently observed changes of PD, T2* and phase of brain tissue in the patients indicate that there are significant brain microstructural changes associated with CNI therapy. For example, in frontal white matter the higher PD and T2 (CNI free) and higher T2* (CNI free and low dose) compared to controls may indicate increased free water (PD and T2) within brain tissue of these patients. These alterations might explain the cognitive impairment of the patients. Further, the reason for little changes found in patients with standard CNI dose might be that the CNI dose was applied depending on patients’ tolerability to CNI medication, which might point out different phenotypes of these patients.Conclusion
qMRI method is obviously able to show differences in different groups of CNI treatment in patients after OLT. Further it can detect different manifestations of alterations in the microstructure. These preliminary results showed that long term medication with CNI affects tissue microstructure in human brain and the brain function after liver transplantation.Acknowledgements
No acknowledgement found.References
1. Ding XQ, Kollewe K, Blum K., et al. Value of quantitative analysis of routine clinical MRI sequences in ALS. Amyotrophic Lateral Sclerosis. 2011;12:6,406-413.
2. Holst B, Siemonsen S, Finsterbusch J, et al. T2’ imaging indicates decreased tissue metabolism in frontal white matter of MS patients. Multiple Sclerosis. 2009;15:701–707
3.
Haacke
E, Muhammad A, Asadullah K, et al. Establishing a baseline phase behavior
in magnetic resonance imaging to determine normal vs. abnormal iron
content in the brain. J Magn Reson Imaging. 2007;26(2):256-64.
Figures
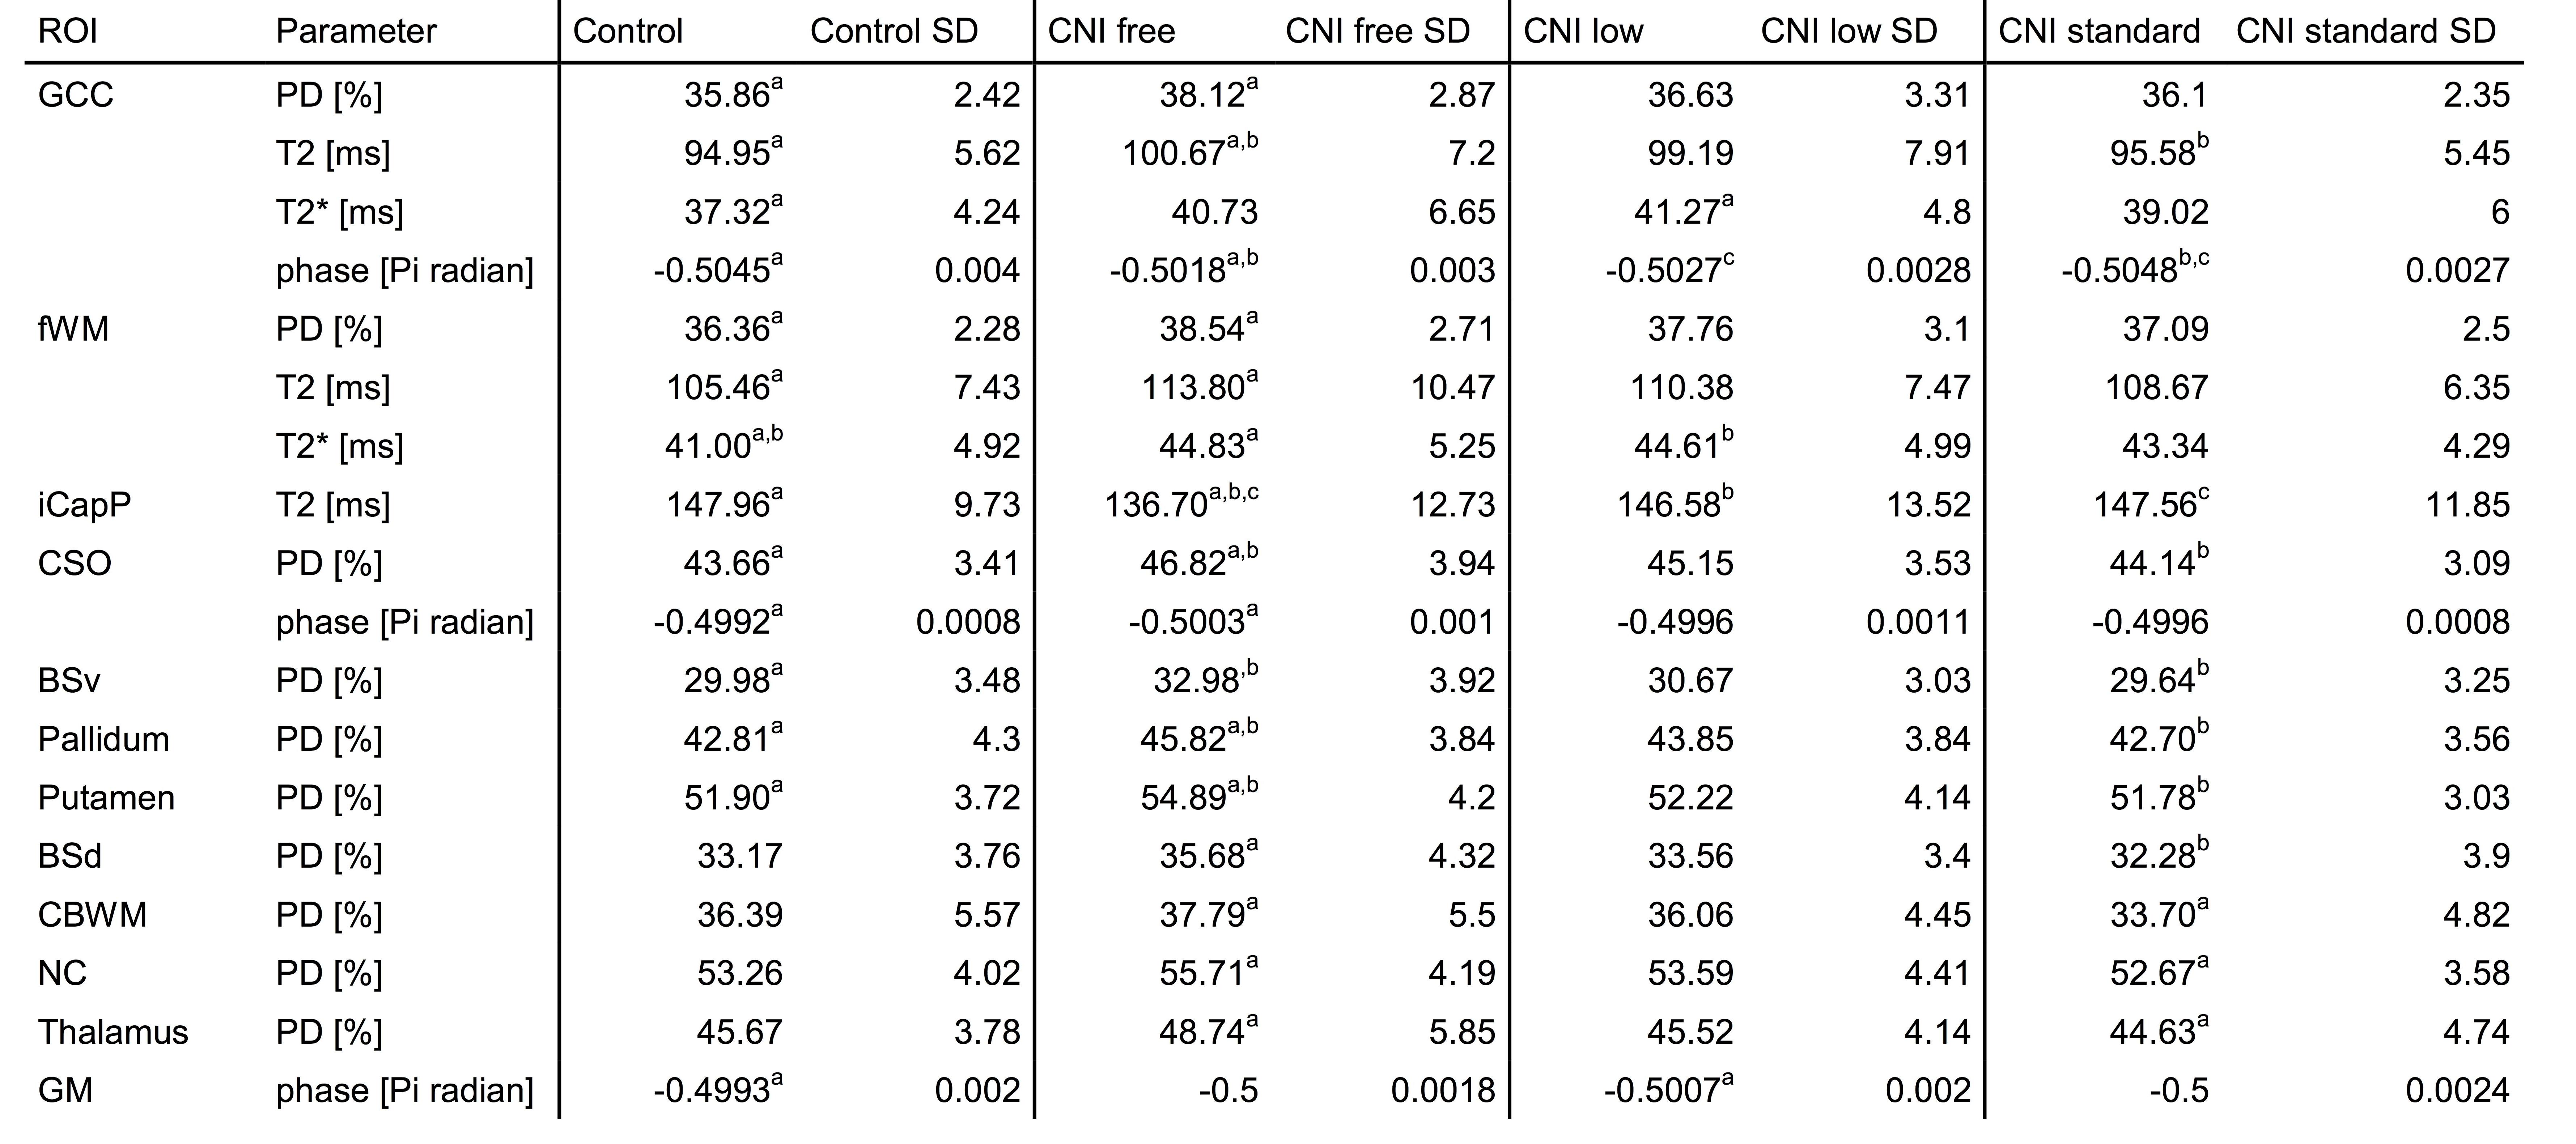
Table 1. a,b,c indicate the paired mean values where Bonferroni post hoc analysis showed significant differences (p<0.05).
GCC=genu corpus callosum; fWM=frontal white matter; iCapP=internal capsule (posterior limb); CSO=centrum semiovale; BSv=ventral brain stem; BSd=dorsal brain stem; CbWM=cerebellum white matter; NC=caudate nucleus; GM=occipital gray matter