2430
Robust and automatic spinal cord detection on multiple MRI contrasts using machine learning1NeuroPoly Lab, Institute of Biomedical Engineering, Polytechnique Montreal, Montréal, QC, Canada, 2Division of Neurosurgery, Department of Surgery, University of Toronto, Toronto, ON, Canada, 3Aix Marseille Univ, CNRS, CRMBM, Marseille, France, 4APHM, Hôpital de la Timone, Hôpital de la Timone, Pôle d’imagerie médicale, Marseille, France, 5Montreal Heart Institute, Montréal, QC, Canada, 6Functional Neuroimaging Unit, CRIUGM, Université de Montréal, Montreal, QC, Canada
Synopsis
Detecting the spinal cord on a large variety of MRI data is challenging but essential for the automation of quantitative analysis pipelines. For the past few years, machine learning algorithms have outperformed most unsupervised image processing methods. The present study investigates the performance of two different machine learning algorithms, Convolutional Neural Networks (CNN) and Support Vector Machine (SVM), on MRI data from different vendors, with a variety of pathology, contrast, resolution and FOV. Results suggest strong performance of the CNN approach, opening the door to application in multi-center analysis pipelines.
Purpose
To detect spinal cord (SC) automatically on a large variety of 3D MRI volumes by using state-of-the-art machine learning algorithms.Introduction
Automated analysis pipelines of SC MRI data require fully automatic SC detection methods. While several recent algorithms have shown good robustness1, these are often limited to specific contrasts and resolution. Here, we introduce and compare two SC detection methods, based on state-of-the-art machine learning algorithms, that are designed to work for a broad range of MRI contrasts.Methods
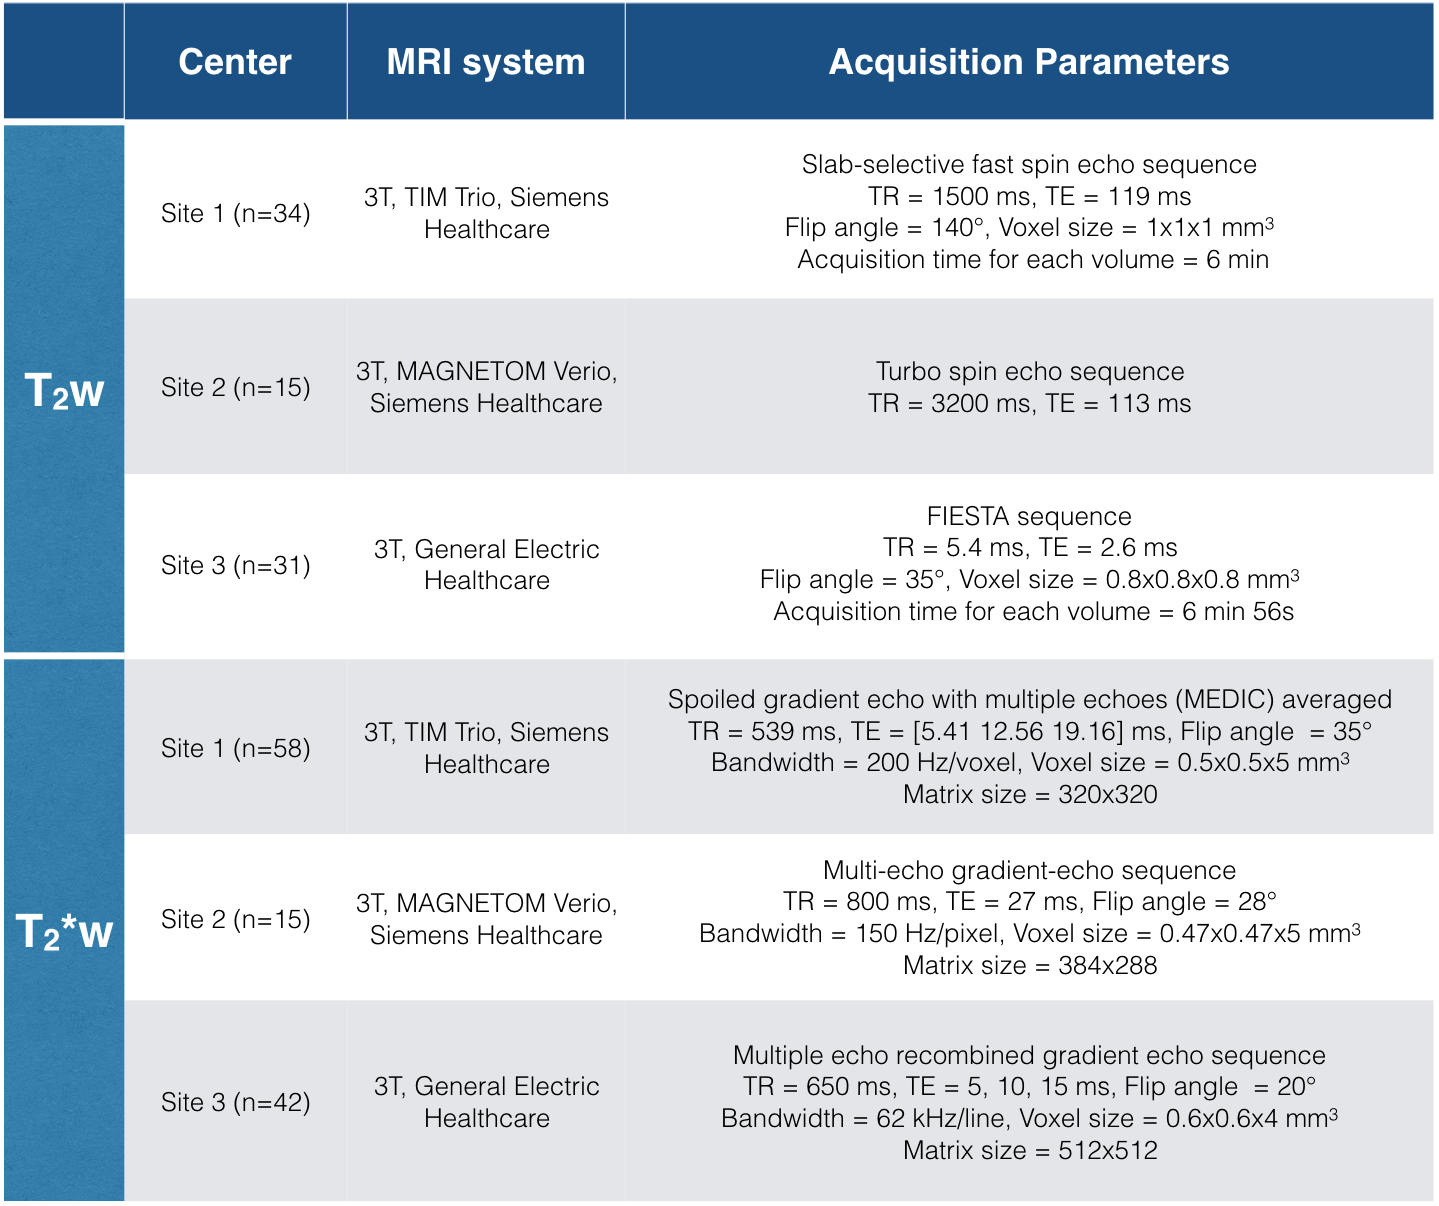
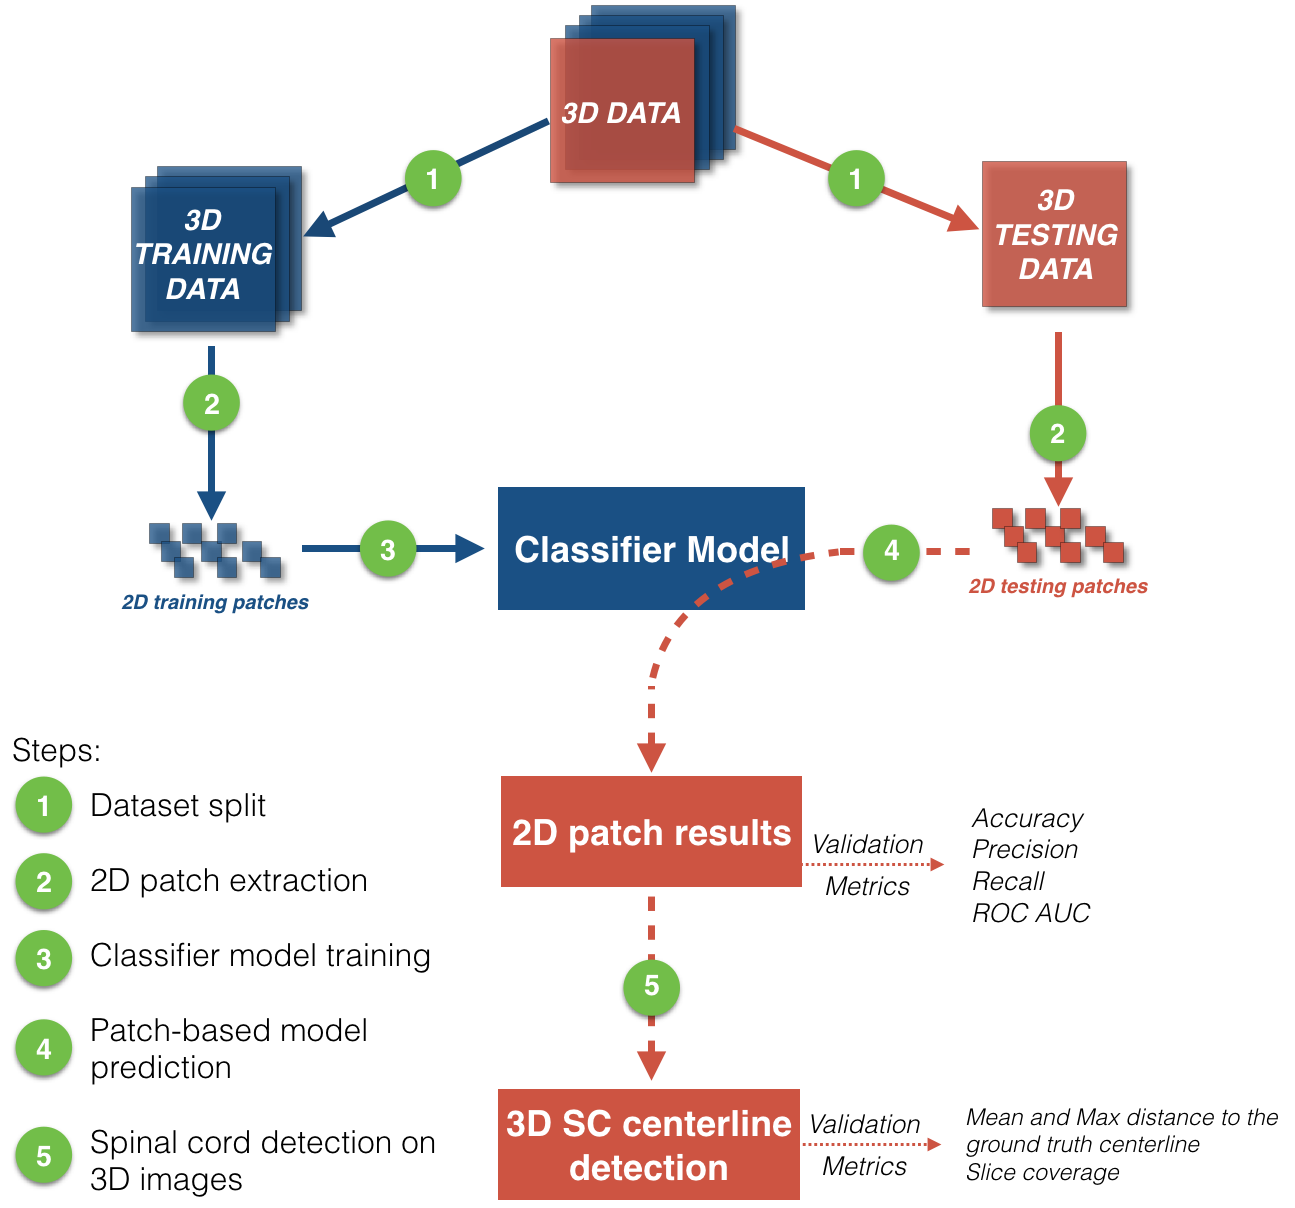
The dataset is composed of 80 T2-weighted (T2w) and 115 T2*-weighted (T2*w) images from three different centers and two MRI manufacturers (Siemens and General Electric Healthcare). Acquisition parameters are listed in Figure 1. 80% of images were used for creating a classification model during the training step, while the 20% remaining were used for validation (Figure 2, step 1). Note that testing images contain ten Degenerative Cervical Myelopathy (DCM) and one Spinal Cord Injury (SCI) patients.
Method 1: Support Vector Machine (SVM)2:
Classification was based on Histogram of Oriented Gradients (HOG) features that demonstrated to perform well in the field of pattern detection3. To train the model, HOG features were extracted from 2D axial patches of training images on 30,000 patches for T2w images and 22,000 for T2*w images (Figure 2, step 2).
Method 2: Convolutional Neural Networks (CNN)4:
CNN architecture was composed of two depths, two layers per depth with 32 and 64 3x3 convolutional features for each layer and depth, respectively. Rectified Linear Units were used as activation layers. Multi-resolution classification was achieved adding 2x2 max-pooling between depths. Cross-categorial entropy was used as an optimization score function. 35,000,000 and 5,000,000 2D patches (1.5 epochs) from T2w and T2*w training images respectively were used to train the classification model using a GPU NVIDIA Tesla C2050 device (Figure 2, step 2).
Training:
Models were trained with labeled 2D patches of 32x32 voxels, 1mm isotropic resolution (Figure 2, step 3). A patch is labeled as inside SC if its center is located within the SC.
Validation:
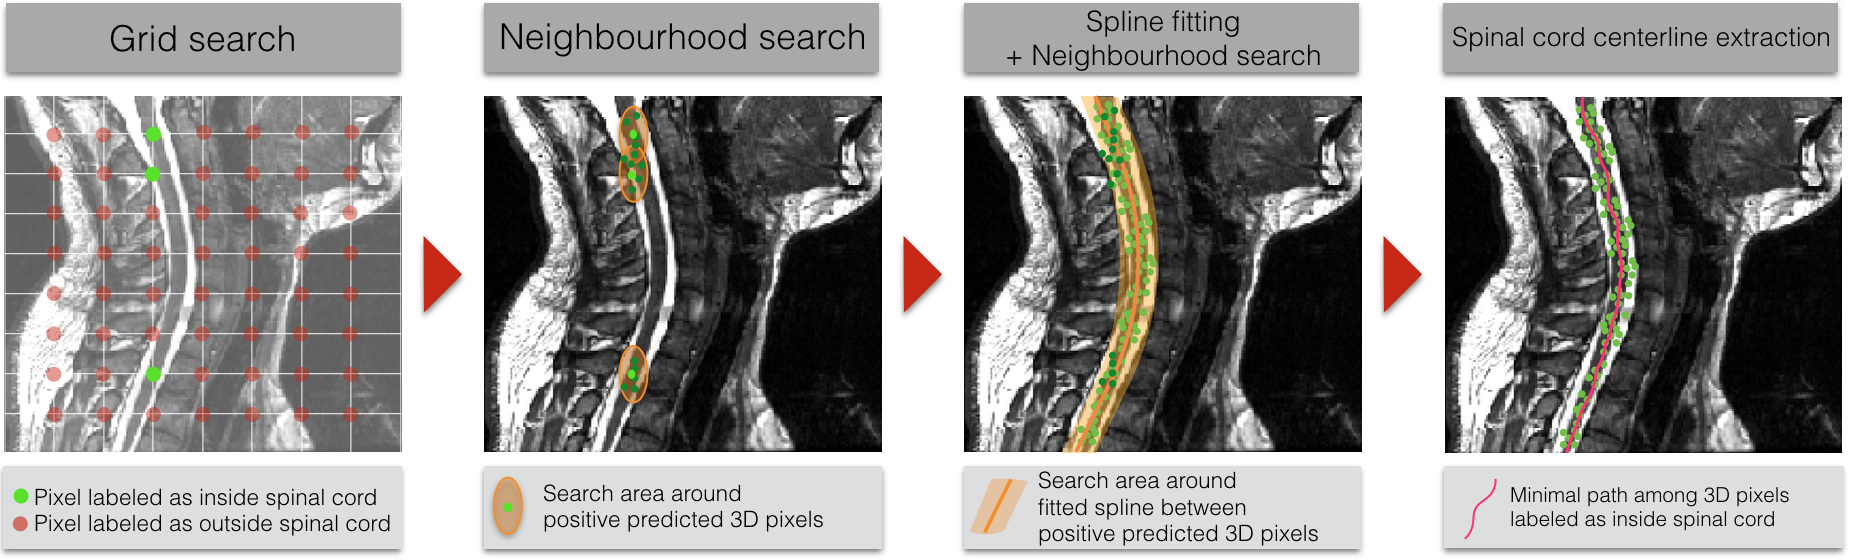
Both methods were validated on 2D patches extracted from testing images, by predicting if the SC is inside or outside the patch (Figure 2, step 4). Results of the 2D patch-based classification were used to detect the SC on 3D testing images (Figure 2, step 5) using a post-processing pipeline detailed in Figure 3. From grid search predictions, neighborhoods around 3D pixels labeled as inside SC were investigated. Results of this neighborhood search were used to fit the positive labeled 3D pixels distribution, around which a novel SC detection was performed. The extracted SC centerline is the minimal path among 3D pixels labeled as inside the SC. Mean squared error (MSE), maximal distance from the ground truth SC centerline and the slice detection coverage were computed to assess SC detection.
Results
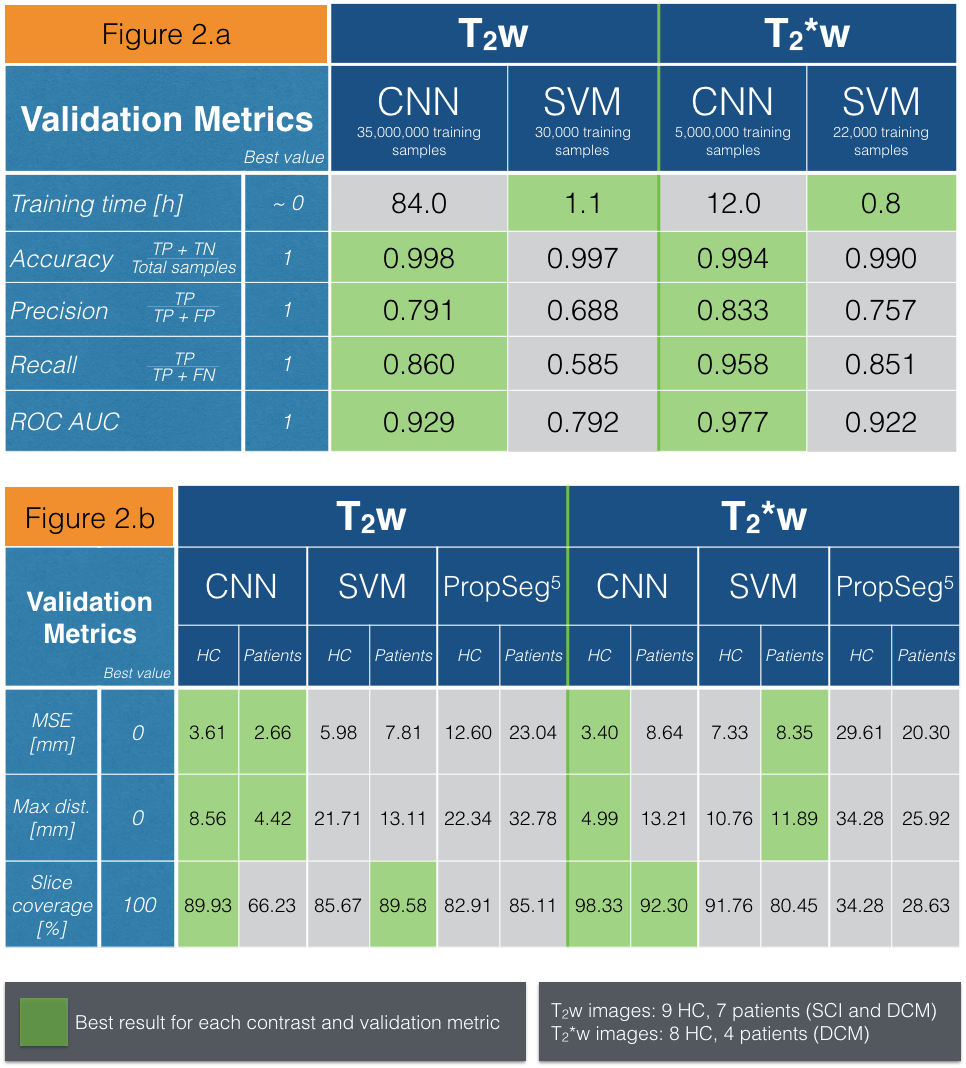
Figure4.a presents results of the classification on 7,194,000 and 2,209,000 patches extracted from respectively T2w and T2*w testing images. Training time, accuracy, precision, recall, area under ROC curve (ROC AUC) were used as validation metrics. Due to its higher complexity, CNN training required a very high number of training samples and training time compared to SVM. However, once both classifier models were trained, CNN appeared more sensitive and specific to SC detection than SVM, as suggested by the area under ROC curve metric for T2w and T2*w images.
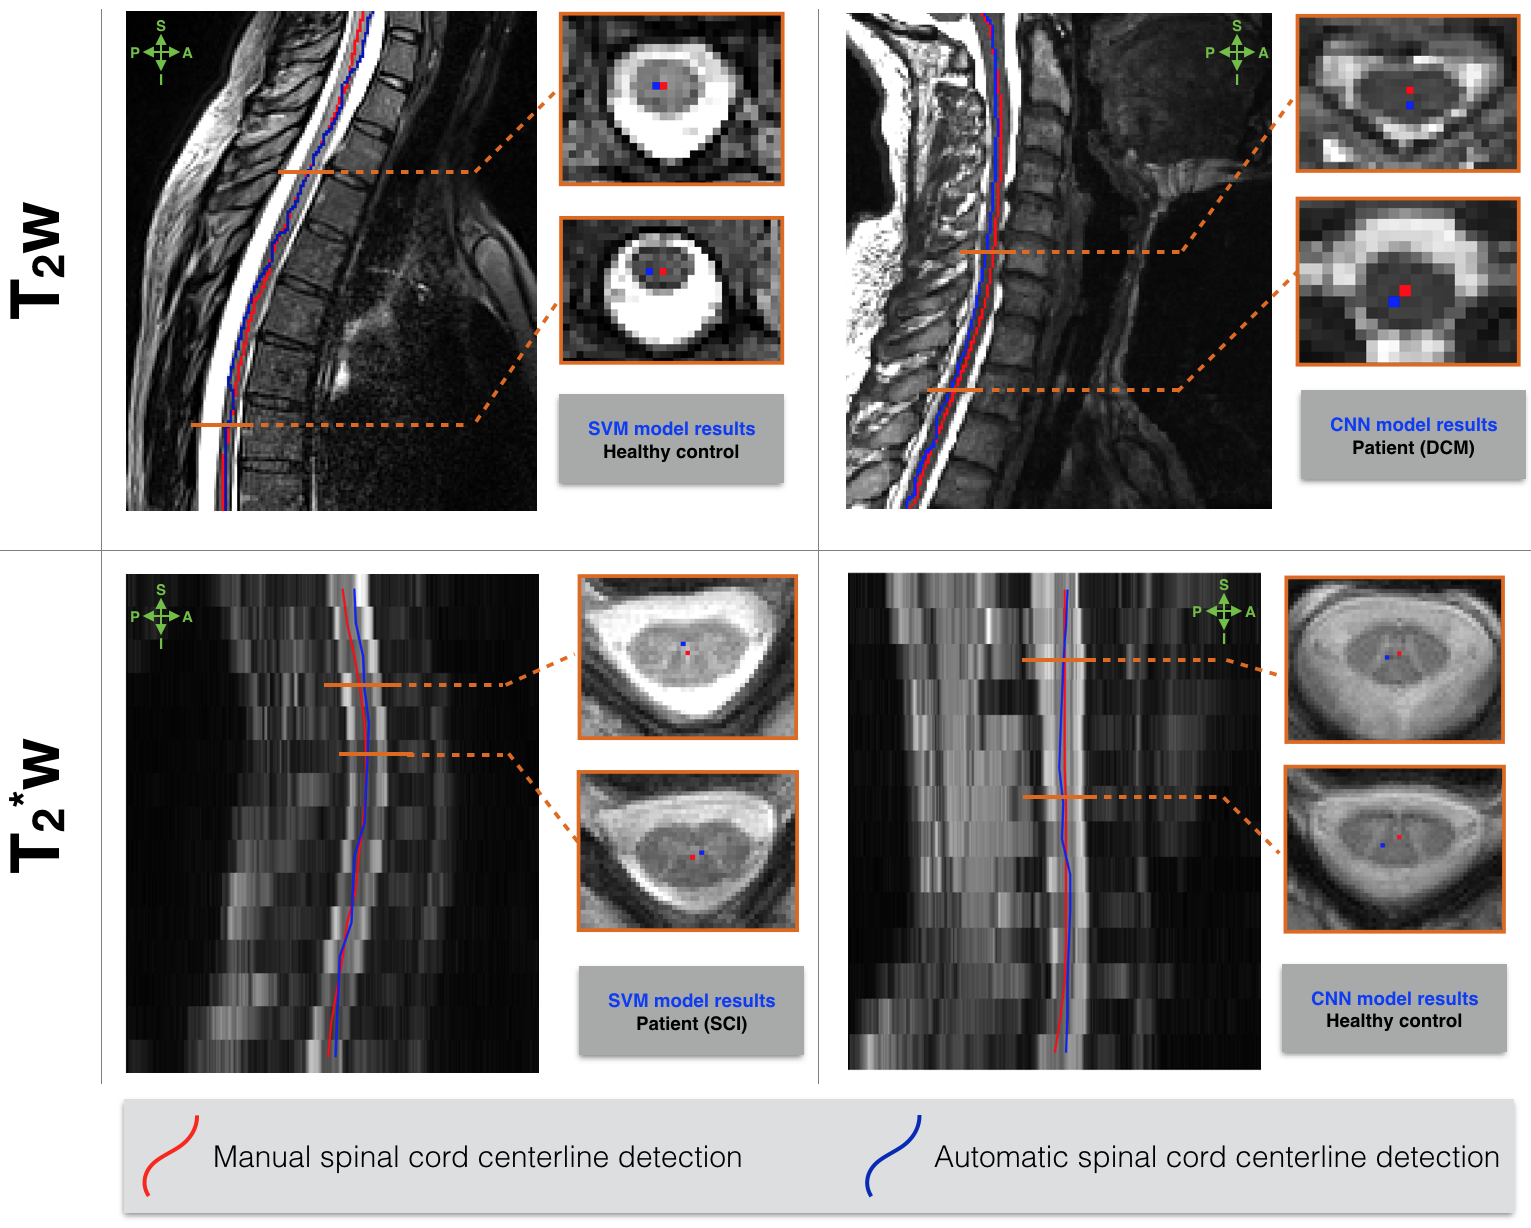
Figure4.b shows the results of 3D SC detection averaged across testing images from healthy controls and patients on T2w and T2*w contrasts. The proposed supervised machine learning algorithms are compared to a current unsupervised SC detection algorithm5. Manual SC centerlines are considered as ground truth. Machine learning algorithms, especially CNN, provided a strong enhancement for SC detection on T2w and T2*w images compared to the unsupervised method5. Qualitative examples of 3D SC detection are illustrated in Figure 5.
The average testing time is 10min and 5min on a 3D T2w (50x250x250 voxels) and T2*w (350x350x15 voxels) image.
Discussion and conclusion
Two machine learning-based algorithms were introduced, that can detect automatically the SC in MRI data and that are robust to the MRI hardware brand, pathology, FOV, contrast and resolution. The proposed machine learning algorithms outperform current SC detection algorithm5 in both accuracy and robustness.
CNN appears to be more sensitive and specific to SC detection compared to SVM, probably due to its model complexity and its automatic feature selection.
Future work includes computation time optimization, validation with a broader MRI dataset that features other image contrasts, pathologies, MRI vendors and multiple centers.
Acknowledgements
We would like to acknowledge all members of the NeuroPoly Lab, especially Sara Dupont for the useful discussions.
We would like to thank NVIDIA Corporation.
Funded by the Canada Research Chair in Quantitative Magnetic Resonance Imaging (JCA), the Canadian Institute of Health Research [CIHR FDN-143263], the Canada Foundation for Innovation [32454], the Fonds de Recherche du Québec - Santé [28826], the Fonds de Recherche du Québec - Nature et Technologies [2015-PR-182754], the Natural Sciences and Engineering Research Council of Canada [435897-2013] and the Quebec BioImaging Network.
References
1. De Leener B, Taso M, Cohen-Adad J, Callot V. Segmentation of the human spinal cord. MAGMA 2016;Available from: http://dx.doi.org/10.1007/s10334-015-0507-2
2. Cortes C, Vapnik V. Support-vector networks. Mach. Learn. 1995;20(3):273–297.
3. Dalal N, Triggs B. Histograms of oriented gradients for human detection. In: 2005 IEEE Computer Society Conference on Computer Vision and Pattern Recognition (CVPR’05). 2005 p. 886–893 vol. 1.
4. Lecun Y, Bottou L, Bengio Y, Haffner P. Gradient-based learning applied to document recognition. Proc. IEEE 1998;86(11):2278–2324.
5. De Leener B, Kadoury S, Cohen-Adad J. Robust, accurate and fast automatic segmentation of the spinal cord. Neuroimage 2014;98:528–536.
Figures