2428
A Method for Quantification of T1 in Multiple Sclerosis Lesions1Northwestern University, Evanston, IL, United States, 2University of Chicago
Synopsis
The development of multiple sclerosis lesions appear as different contrast mechanisms on the different MR imaging scans. In T1 weighted images, these evolve into hypointense lesions and representative of demyelination. In this study, we propose a method of quantifying T1 values using retrospective data of T1 weighted images, and apply this method to investigate potential trends of T1 changes in multiple sclerosis patients across time. We look at four patients imaged at three time points across 12 months, and find that an increase in T1 of lesions may be a trend.
Introduction
The development of new Multiple Sclerosis (MS) lesions appear as hyperintense on T2-weighted MRI and bright on post gadolinium T1 weighted scans. As the disease progresses roughly 40% of the new MS lesions evolve into persistent hypointense lesions on post contrast T1-weighted images (known as “black holes”) it is hypothesized that black holes reflect loss of myelin and ultimately death of the neuron. The goal of many of the newer MS drug is to delay the progression of MS lesion1. As lesion load in MS is a poor predictor of symptomology, we sought to develop a means of quantifying T1 changes within a new MS lesion for the purposes of tracking local response to therapies2. Standard T1 (before and after gadolinium enhancement) and T2 weighted pulse sequences are the mainstay of clinical evaluation of lesion load in MRI. As MS is a chronic disease, it would be advantageous to track T1 hypointensities over time and in response to drug therapy. We have developed a means of quantifying T1 values within an MS lesion to allow for more accurate measurement of lesional T1 change.Methods
MR images of patients with MS were obtained retrospectively and we applied fitting methods to normalize the T1 weighted images into estimated T1 values. The MRI physics of the pulse sequence used to acquire the MR image, and different signal equations determined the fitting parameters used to estimate T1 values from T1 weighted images. A spin-echo signal regrowth for a T1 weighted scan is defined by $$$S = k(1-e^{-TR/T1})$$$. For a gredient-recalled-echo, the signal regrowth is defined by $$$S = \frac{k(1-e^{(-TR/T1)})\sin\theta}{1-\cos\theta e^{-TR/T1}}$$$. TR is the repetition time, S is the signal intensity, θ is the flip angle, and k is a scanner-specific constant. All variables were known except for k. In order to determine k, the pixel signal intensities for normal white matter, gray matter and cerebral spinal fluid were obtained, and were fitted against corresponding known T1 values (700 ms, 900 ms and 1500 ms). We then were able to calculate T1 values of each pixel based on its signal intensity. A calibrated T1 phantom was developed to validate results
Four cases of MS patients that were imaged three times over the course of 12 months were used for this study. The T1 weighted images of each patient and time point were quantified to fitted T1 values using the aforementioned method. Lesions appearing on the images were drawn and analyzed across time.
Results
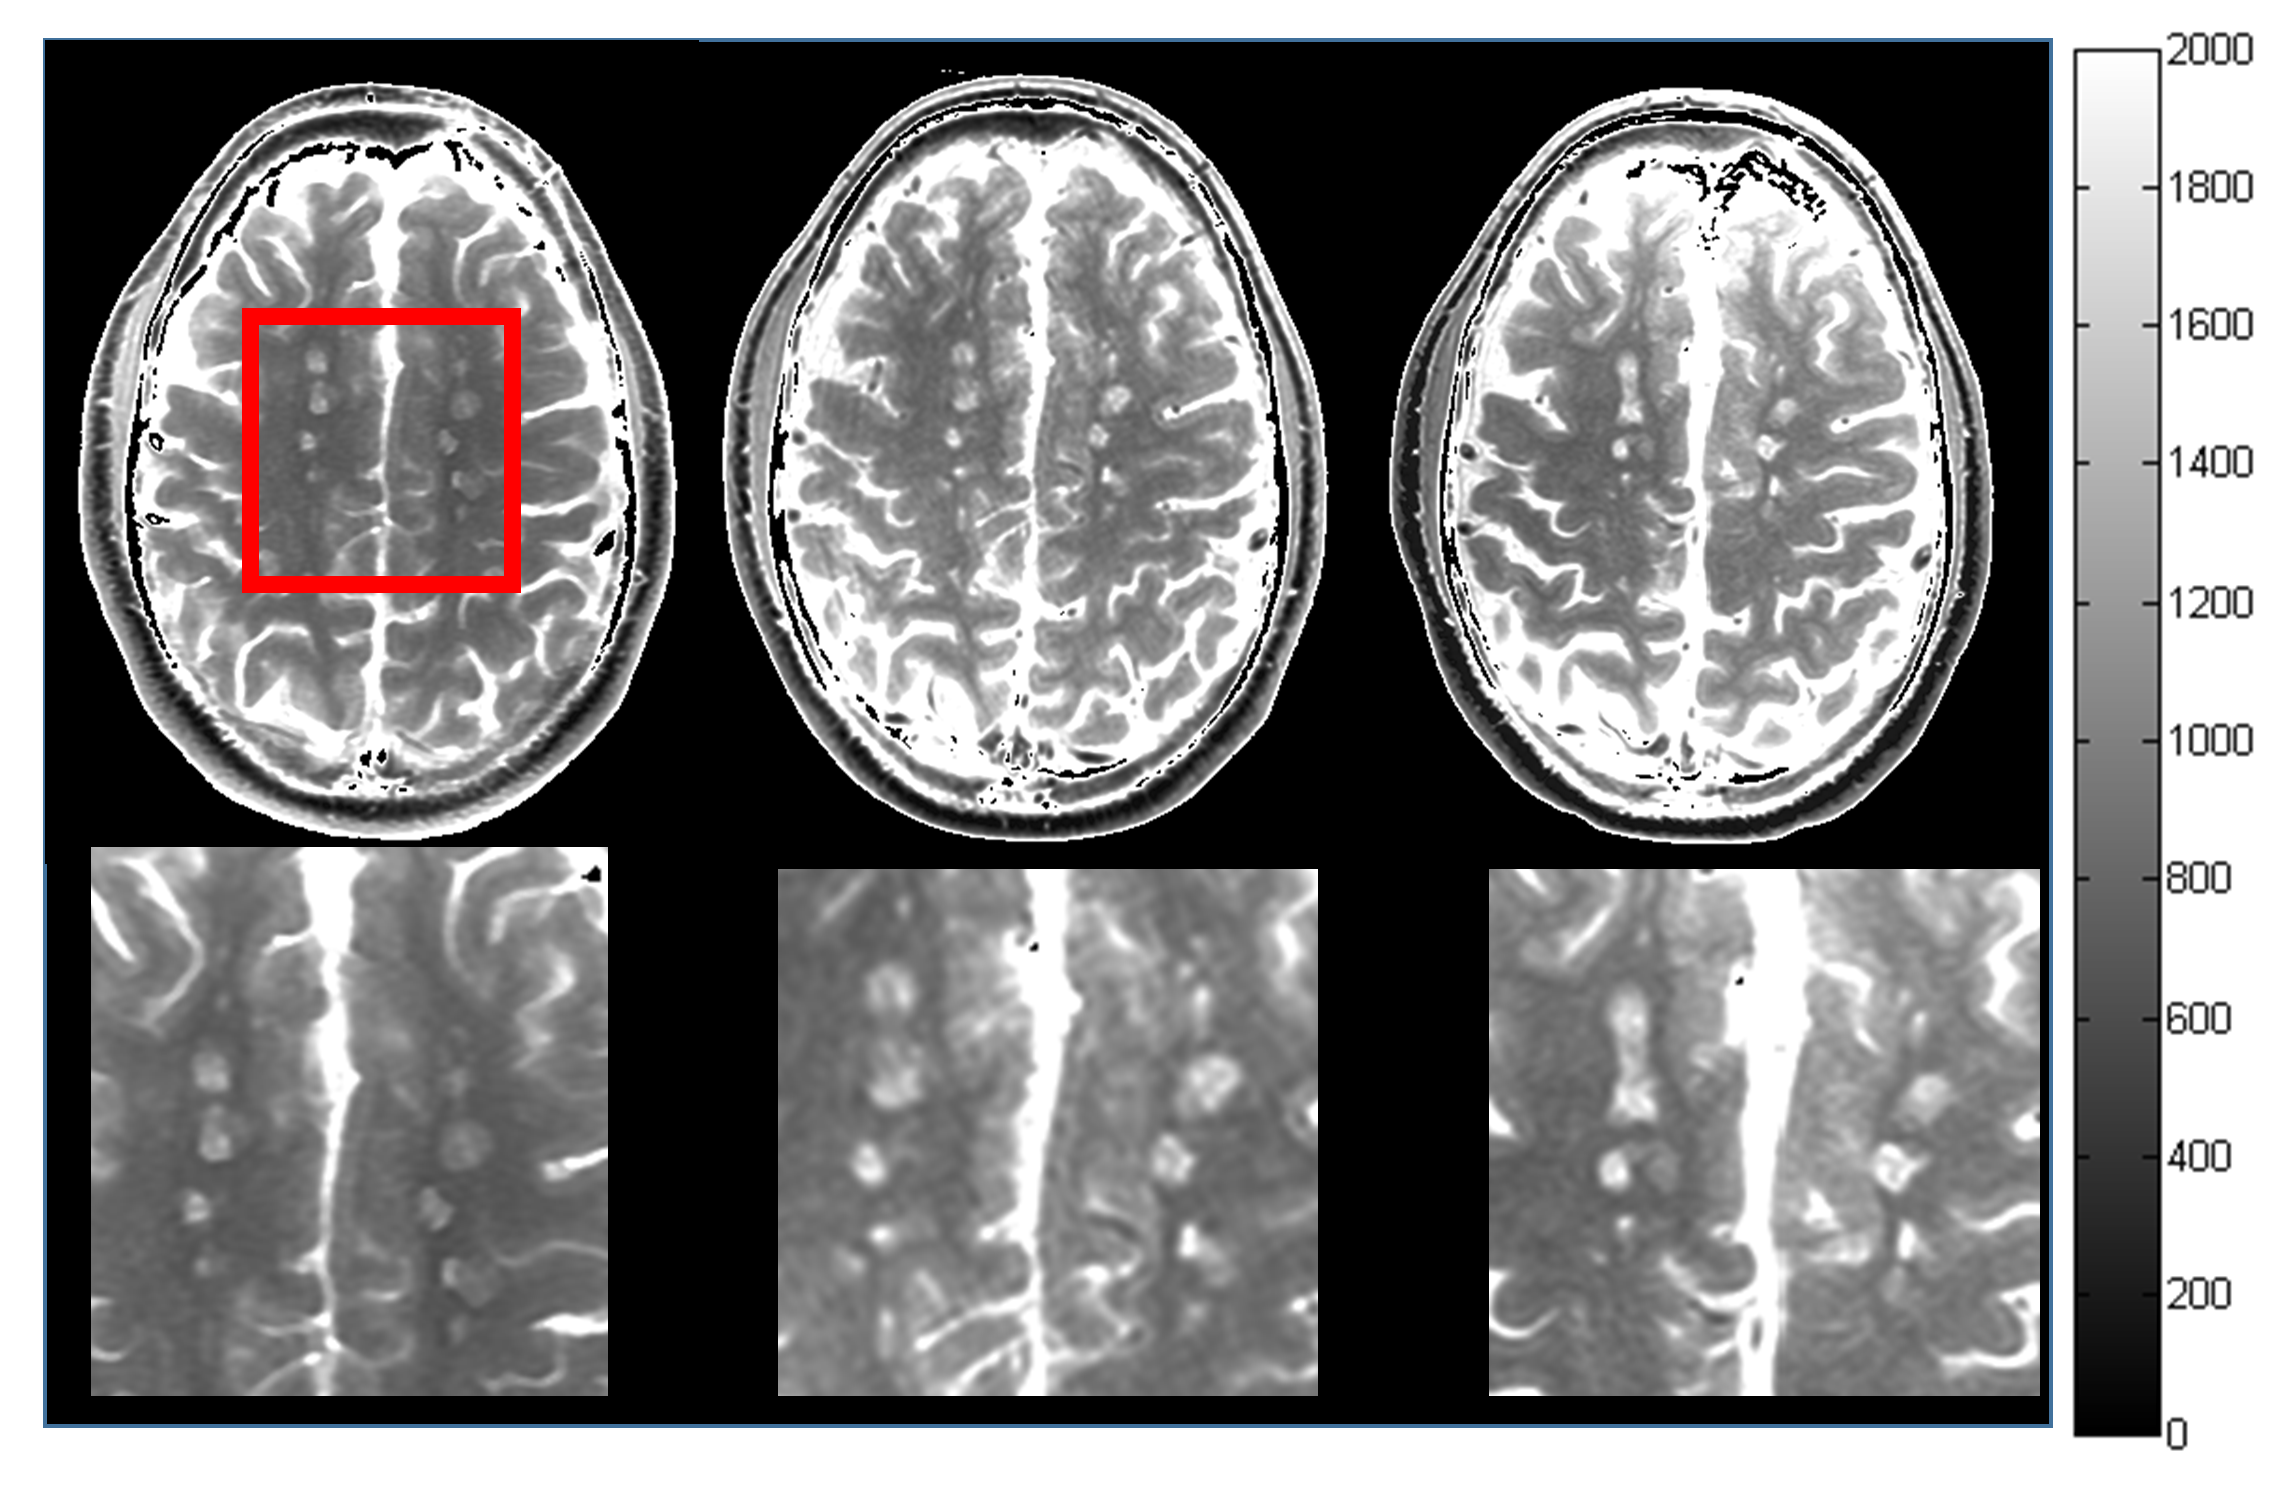
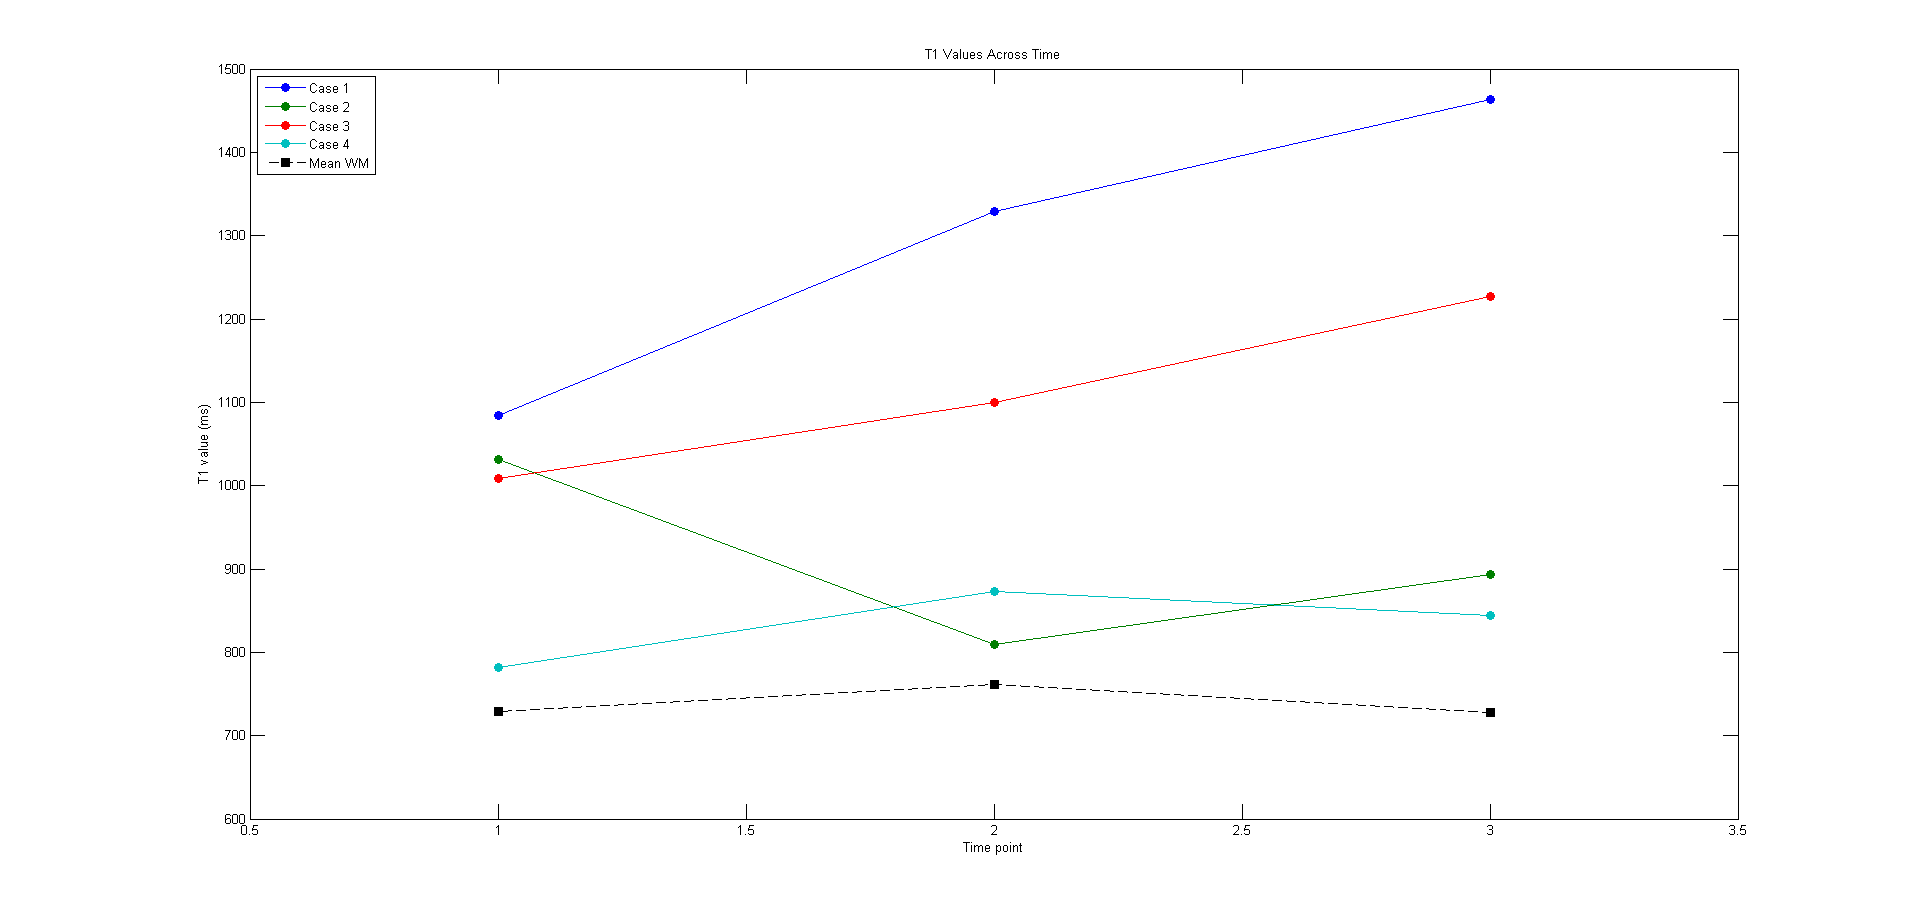
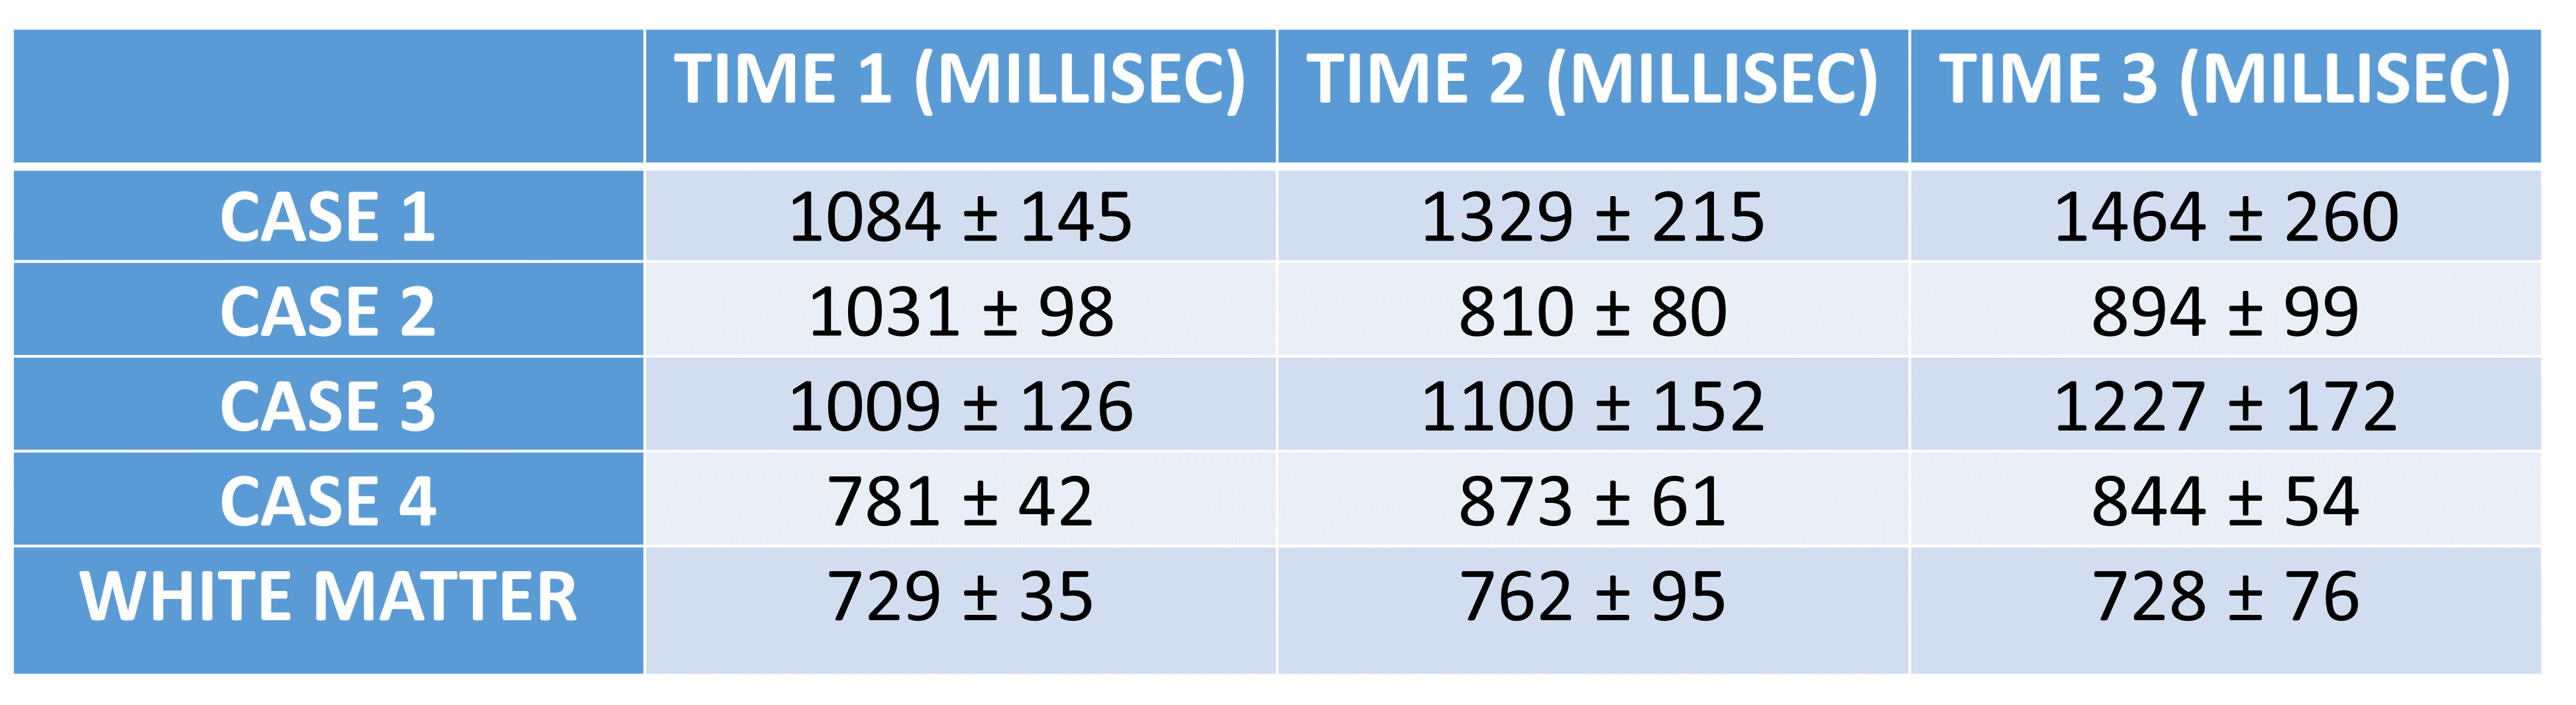
Representative images from one MS patient after T1 quantification is shown in Figure 1. Demyelination of with the pre-gadolinium lesion is evident as a gradual increase in T1 (roughly 500 ms) over time. Preliminary analysis shows that T1 values are highly dynamic in MS. The average T1 in the lesions of each patient across the three time plots are plotted with the average white matter T1 of all patients serving as reference (Figure 2). The mean and standard deviation of these values are reported in Table 1. Except for Case 2, the T1 of lesions showed to increase across time.Conclusion
Retrospective analysis of clinical data is possible and T1 estimation could be a potential biomarker of MS progression. The short T1 values of myelin2 indicates serial pre-contrast T1 of new MS lesions may serve as a marker of the demyelination rate, and consequently provide a new MRI marker of disease progression improving the management of MS. However, this study was only a preliminary analysis of estimating T1 changes in MS lesions. A deeper analysis of the patient demographic, treatments received, and validation of the proposed method in patients will be investigated.Acknowledgements
No acknowledgement found.References
1. Filippi M, Rovaris M, Rocca MA, Sormani MP, Wolinsky JS, Comi G. Glatiramer acetate reduces the proportion of new MS lesions evolving into “black holes”. Neurology. 2001 Aug 28;57(4):731-3.
2. Deoni SC, Rutt BK, Arun T, Pierpaoli C, Jones DK. Gleaning multicomponent T1 and T2 information from steady-state imaging data. Magnetic Resonance in Medicine. 2008 Dec 1;60(6):1372-87.
Figures