2426
Evaluating White Matter Changes in Amyotrophic Lateral Sclerosis from T1-weighted MRI using 3-D Texture Analysis1Neuroscience and Mental Health Institute, University of Alberta, Edmonton, AB, Canada, 2Department of Computing Science, University of Alberta, 3Division of Neurology, University of Alberta
Synopsis
Amyotrophic lateral sclerosis is a fatal neurodegenerative disease of the motor system with substantial disease burden in white matter. Clinical MRI studies are used only to exclude diagnoses of symptom-mimicking neurological disorders. We propose that texture analysis performed on structural MRI can provide a surrogate marker for subtle white matter changes that are observed in ALS. This study shows significant correlations between texture features from T1-weighted imaging and diffusion measures such as fractional anisotropy and mean diffusivity. These texture features also demonstrated significant differences between ALS and controls and can potentially be used clinically for diagnosis and disease monitoring.
Introduction
Amyotrophic lateral sclerosis (ALS) is a neurodegenerative disease of the human motor system. ALS patients suffer from paralysis of the limbs, speech dysfunction, swallowing difficulties, and cognitive and behavioural changes due to frontotemporal lobar degeneration. There are no established neuroimaging biomarkers and clinical MRI only serves to exclude symptom-mimicking disorders. Texture analysis is a computational method of image pattern characterization. Previously, we demonstrated that texture analysis could detect white and gray matter changes in ALS patients1. In this study, our aim was to investigate white matter changes in ALS using texture analysis and provide a biological basis for the observed changes using diffusion tensor imaging (DTI).Methods
We recruited 19 ALS patients (56.9 ± 11 years) and 23 healthy controls (57.5 ± 10 years) for this study. MRI scans were performed on a 4.7 T scanner using a T1-weighted 3D MPRAGE sequence with TR = 508.5ms, TE = 4.5ms, and voxel size = 1 x 1 x 1mm3 and a diffusion-weighted sequence using a 2D spin-echo EPI with TR = 6500ms, TE = 52.31ms, voxel size = 2 x 2 x 2mm3, 30 diffusion gradient directions, b-value = 1000s/mm2, and 5 non-DW images. T1-weighted images were bias corrected, segmented, and registered to MNI space using DARTEL in SPM8. 3D texture analysis was performed using an in-house developed SPM8 toolbox2. Twenty-two (f1, f2, …, f22) whole brain texture feature maps were generated for all subjects in native space from their bias-corrected images; the texture maps were registered to the MNI template using subjects’ respective transformation matrices. Diffusion-weighted images were corrected for eddy current, motion, and B0 inhomogeneity distortions in ExploreDTI. Subjects’ DTI data was registered and resampled to their respective T1-weighted images for analysis and for EPI distortion correction. DTI data was brought to the MNI space by applying the subjects’ transformation matrices from the previous step. Visual assessment was done to ensure accurate registration of DTI and T1-weighted images to the MNI template. Three-dimensional masks for corticospinal tract and corpus callosum were created using white matter histological atlases and exported to SPM8 in the MNI template space. Twenty-two texture feature values and DTI metrics including FA, MD, and RD were extracted from the masks for analysis for all subjects. To find texture features that are sensitive to white matter, FA, MD, and RD were correlated with the 22 texture features from the corpus callosum from all subjects. Texture features that showed significant correlations were then correlated amongst each other to eliminate redundancies and produce a set of unique white matter sensitive texture features from T1-weighted images. This set of texture features was compared between ALS and controls within the corticospinal tract and corpus callosum.Results
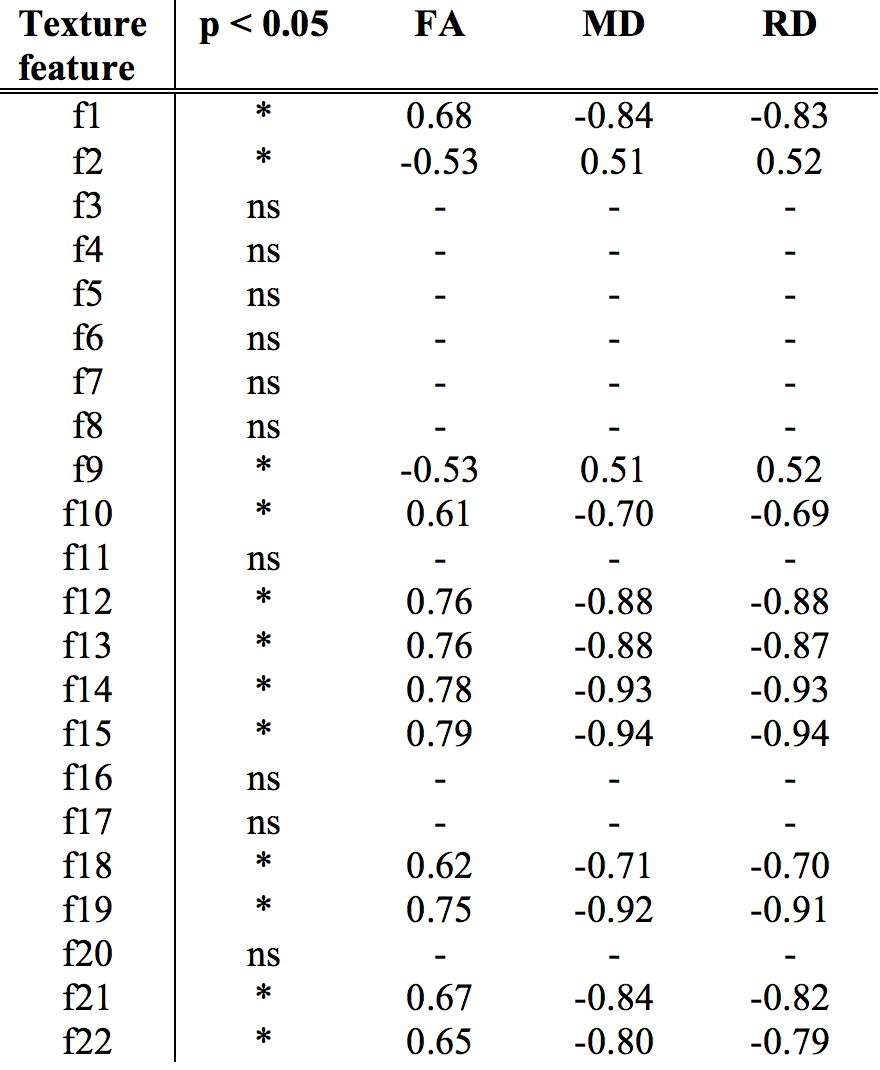
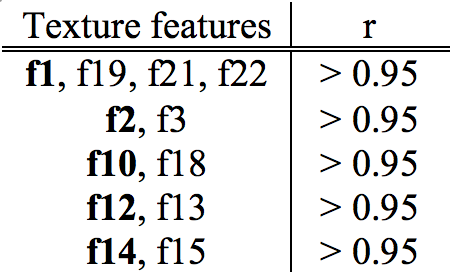
Of the 22 extracted texture features, 12 showed significant (p < 0.05, Bonferroni corrected) correlations with FA, MD, and RD (Table 1). These 12 features were correlated amongst each other to detect redundancies. Strong correlations (r > 0.95, Pearson’s correlation) were found for texture features within five unique groups. One representative feature was selected from each group to produce a set of five white matter sensitive texture features (Table 2). The selected white matter sensitive texture features – f1, f2, f10, f12, f14 – were compared between ALS and controls while controlling for age within the corticospinal tract and corpus callosum. Significant differences (p < 0.05) were found with f12 and f14 within the corticospinal tract and corpus callosum.Discussion
This study demonstrates that texture features show strong correlations with DTI metrics indicating a sensitivity to white matter changes. Several studies have established a biological basis for DTI measures. Anisotropy in neural tissue has been shown to be associated with changes in myelin and axonal membranes3,4. T1-weighted images cannot provide a detailed white matter assessment that is comparable to DTI and is limited in its clinical utility. We showed that texture features sensitive to white matter changes in T1-weighted images can detect changes in the corticospinal tract and the corpus callosum of ALS patients. These structures have been widely reported as being affected in ALS and are a primary target for disease pathogenesis.Conclusion
This study provides support for the use of texture analysis of T1-weighted images as a surrogate for white matter change observed in ALS. Whereas routine clinical MRI is used to rule out other neurological conditions, texture analysis may provide a biomarker for subtle white matter change in ALS that is supported by advanced DTI and can potentially be used clinically for diagnostic and monitoring purposes.Acknowledgements
No acknowledgement found.References
1. Maani R, Yang YH, Emery D, Kalra S. Cerebral degeneration in amyotrophic lateral sclerosis revealed by 3-dimensional texture analysis. Frontiers in neuroscience. 2016;10.
2. Maani R, Yang YH, Kalra S. Voxel-based texture analysis of the brain. PloS one. 2015 Mar 10;10(3):e0117759.
3. Beaulieu C. The basis of anisotropic water diffusion in the nervous system–a technical review. NMR in Biomedicine. 2002 Nov 1;15(7-8):435-55.
4. Beaulieu C. The biological basis of diffusion anisotropy. Diffusion MRI: From quantitative measurement to in vivo neuroanatomy. 2009 Apr 28:105-26.
Figures