2425
Gradient non-linearity effects on upper cervical cord area measurement from MPRAGE brain MRI acquisitions1Department of Neurology, University of California San Francisco, San Francisco, CA, United States, 2Department of Neurology, Brigham and Women’s Hospital, United States, 3Department of Neurology, The Johns Hopkins University, United States, 4Department of Brain and Behavioral Science, Univeristy of Pavia, Italy, 5Yale University, School of Medicine, United States, 6Translational Neuroradiology Section, National Institute of Neurological Disorders and Stroke, United States, 7Department of Neurology, University of Toronto, Canada, 8Department of Neurology, University of Southern California, United States, 9Center for Neuroscience and Regenerative Medicine, Henry M. Jackson Foundation, United States, 10Advanced Imaging Research Center, Oregon Health & Science University, United States, 11Department of Biostatistics and Epidemiology, Perelman School of Medicine, University of Pennsylvania, United States, 12Department of Neurology, Cedars-Sinai Medical Center, United States, 13Department of Radiology, University of California San Francisco, United States
Synopsis
Upper cervical cord area (UCCA) is strongly associated with physical disability in patients with multiple sclerosis, particularly in progressive stages of disease. Standard brain high-resolution 3D T1-weighted acquisitions that include the upper cervical cord can be used to provide estimates of UCCA. Depending on subject positioning in the scanner, gradient non-linearity can introduce up to 10% variability in UCCA measurements from volumetric brain MPRAGE scans. In planning a study, use of 3D correction methods provided by the scanner vendors seems optimal. Alternatively, to retrospectively correct data, we propose methods based on a phantom acquisition or normalization with vertebral body diameters.
PURPOSE
Upper cervical cord area (UCCA) is strongly associated with physical disability in patients with multiple sclerosis (MS), particularly in progressive stages of disease1-5. Many sites do not routinely acquire specific spinal cord MRI that can provide reliable measures of UCCA, but standard brain high-resolution 3D T1-weighted acquisitions that include the upper cervical cord can be used to provide estimates of UCCA6,7. We explored the variability of the UCCA measurements from volumetric brain MPRAGE scans related to gradient non-linearity and positioning of the subject in the scanner. We also explored simple methods to correct for this variability.METHODS
1) MS patient acquisition: A single subject with relapsing-remitting MS was scanned at 7 sites from the North American Imaging in Multiple Sclerosis (NAIMS) cooperative using Siemens 3T MRI scanners (4 Skyra, 2 Trio, 1 Verio) with the same brain 3D MPRAGE protocol extended to the upper cervical spinal cord. The acquisition was repeated twice with repositioning, without distortion correction.
Acquisition parameters: sagittal acquisition, voxel size 1x1x1mm3, 256x256x176mm3 coverage, TR/TE/TI=1900/2.52/900ms, flip angle=9 deg, iPAT=2, acquisition time=4:17min.
2) Table position variation/distortion correction test: Two healthy controls (HC) and a phantom were scanned at one site (Skyra) with varying table positions using the described MPRAGE protocol. Uncorrected and distortion-corrected (using Siemens’s 2D and 3D methods) data were exported.
3) UCCA measurements on the MS patient and the two HC: To measure the UCCA, five 1x1x1mm3 axial slices perpendicular to the long axis of the cord at the C2-C3 disc level were extracted from all the acquisitions, and the average area of the cord measured7 using the software JIM8. The C2-C3 disc distance from the scanner isocenter (C2I) was measured for all the acquisitions.
4)
Correction method/1: On the uncorrected acquisitions, axial areas of the
phantom as a function of C2I were measured (A(C2I)), normalized to the area
measured at the scanner isocenter position (A0), and fitted to a
quadratic model: A(C2I)/A0=1+
a*C2I+b*C2I2+ε(C2I).
The parameters of the fit (a,b) were used to extrapolate to the scanner isocenter position the UCCA measured from the uncorrected images of the two HC (obtaining UCCA0 for each (UCCA(C2I)).
5) Correction method/2: For all the uncorrected acquisitions of the two HC and the MS patient, the anterior-posterior and right-left diameters of the C2 vertebral body were measured. UCCA(C2I) were divided by the product of the two diameters (Vert(C2I)).
RESULTS
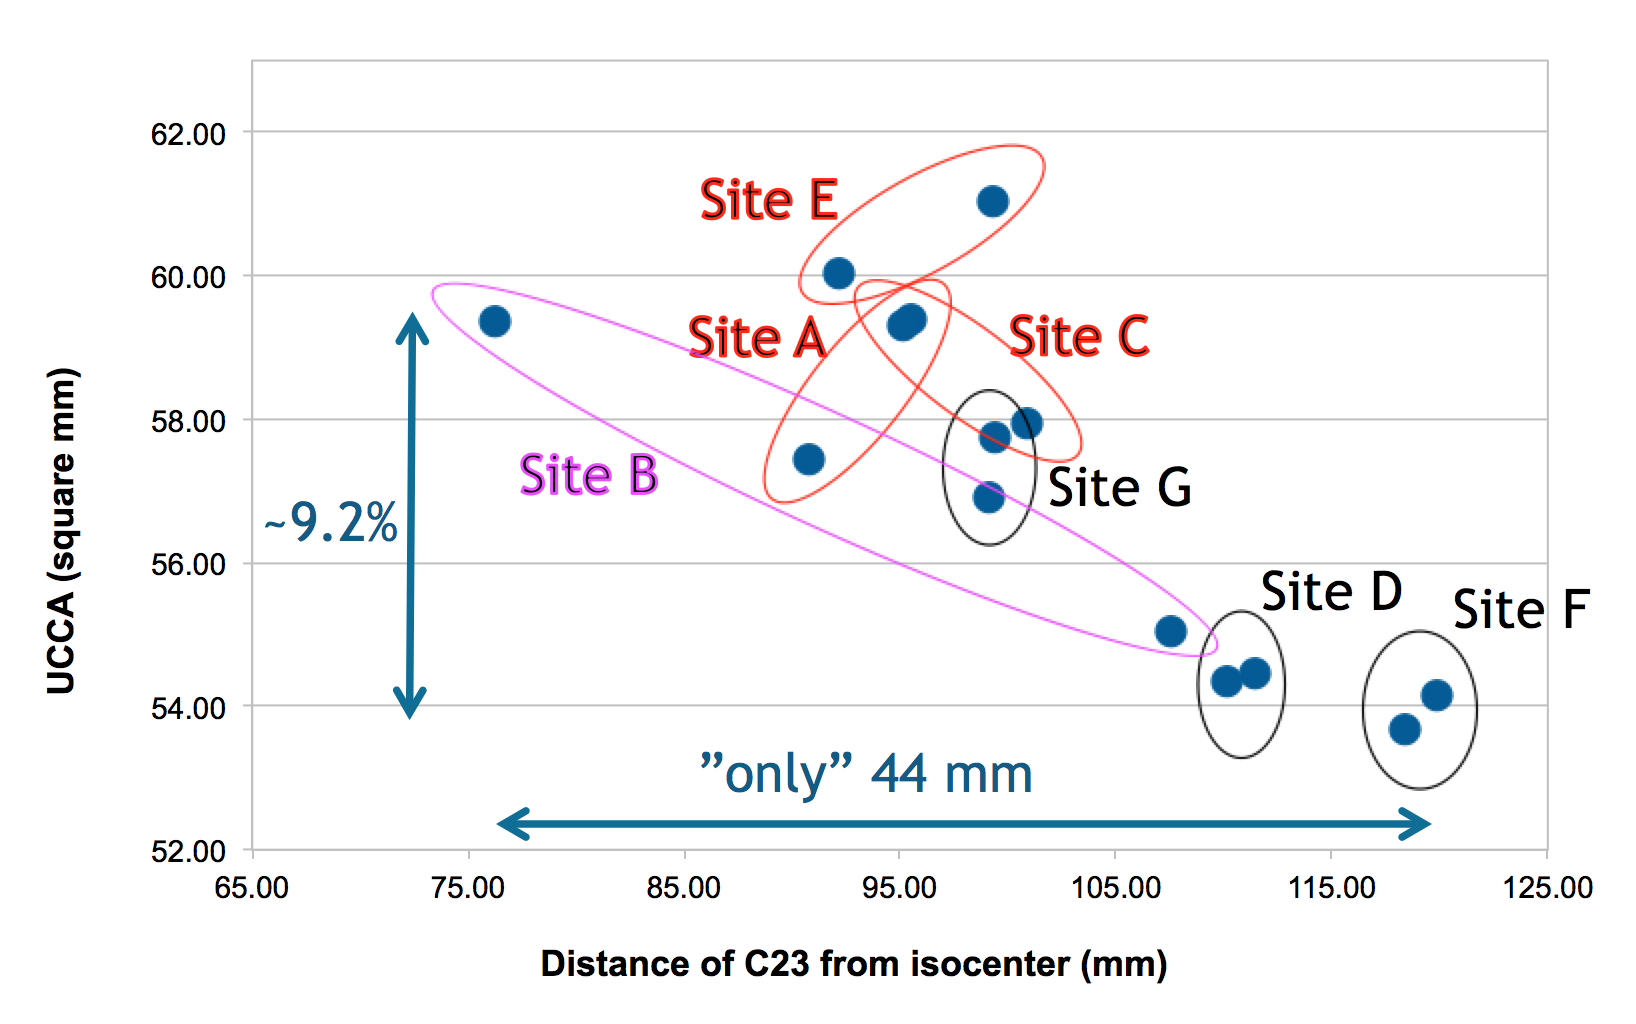
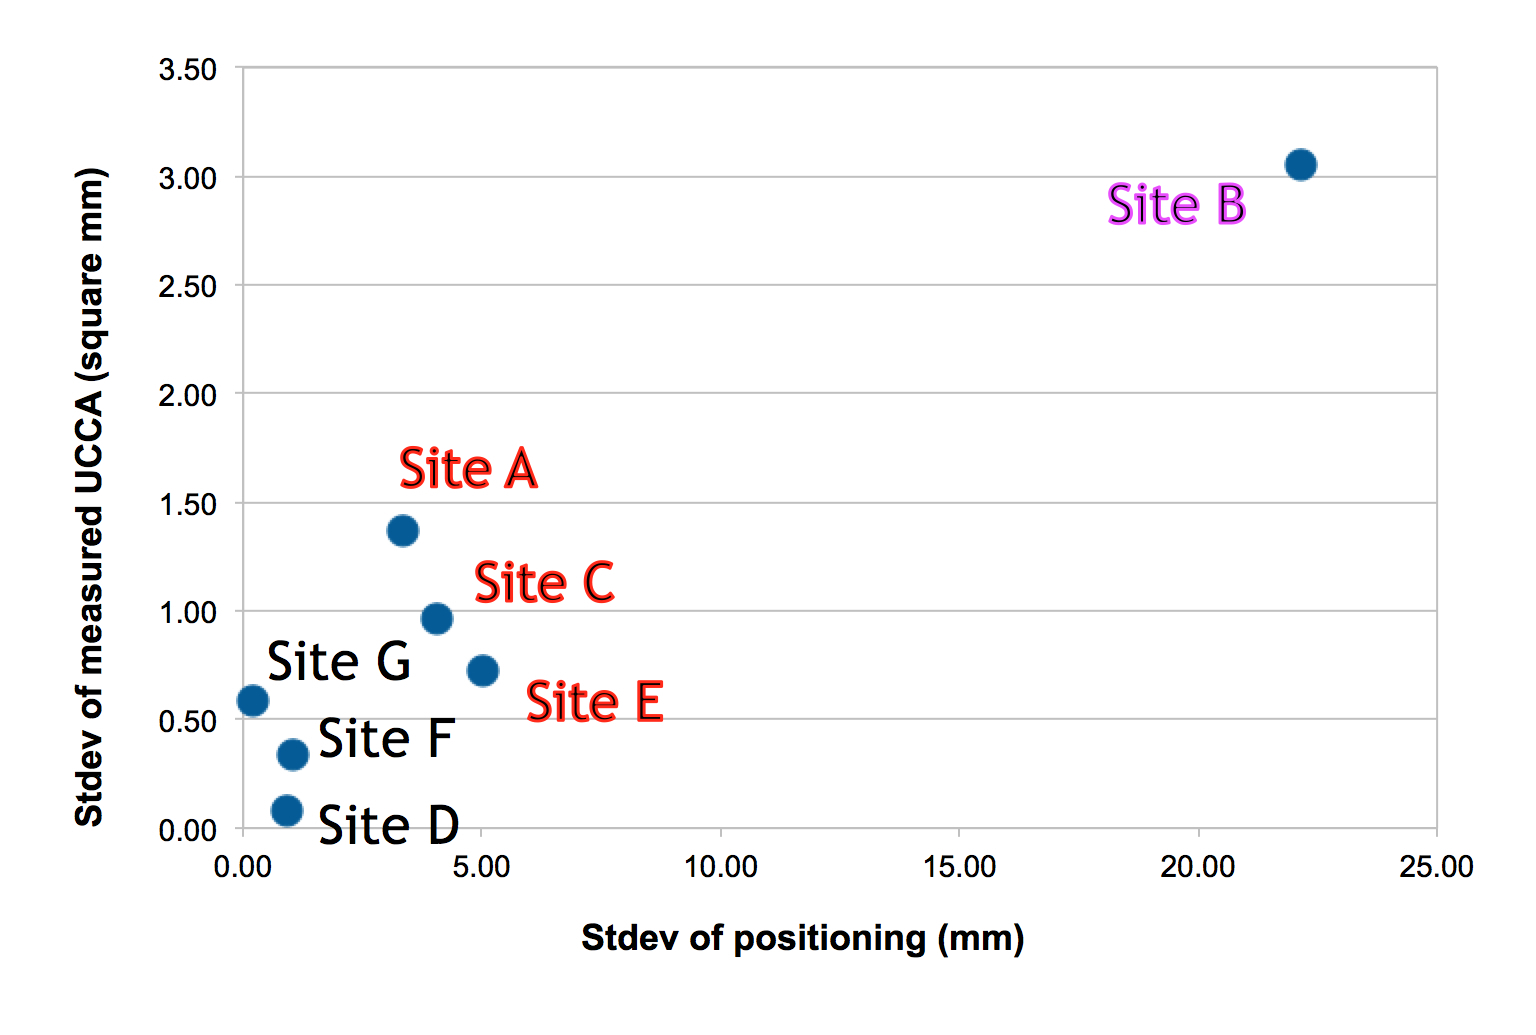
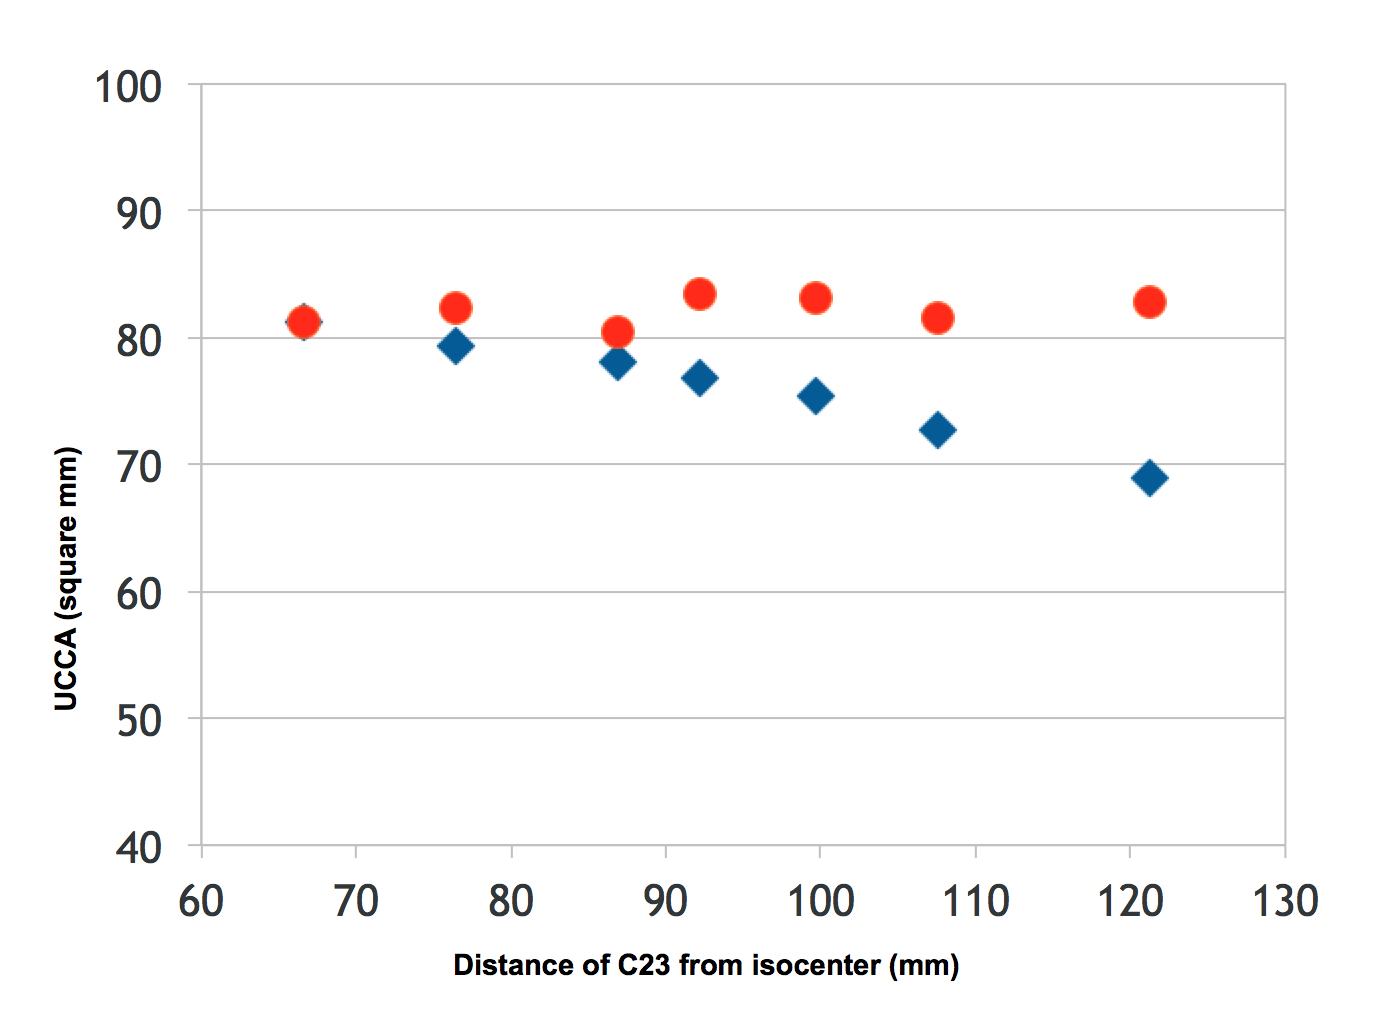
1) Across sites, the relative C2I ranged from 76 to 120mm, which corresponded to a 9.6% change in UCCA (59.4 to 53.7mm2) (Figure 1). Within sites, variability in C2I with repositioning resulted in poorer rescan reproducibility (Figure 2).
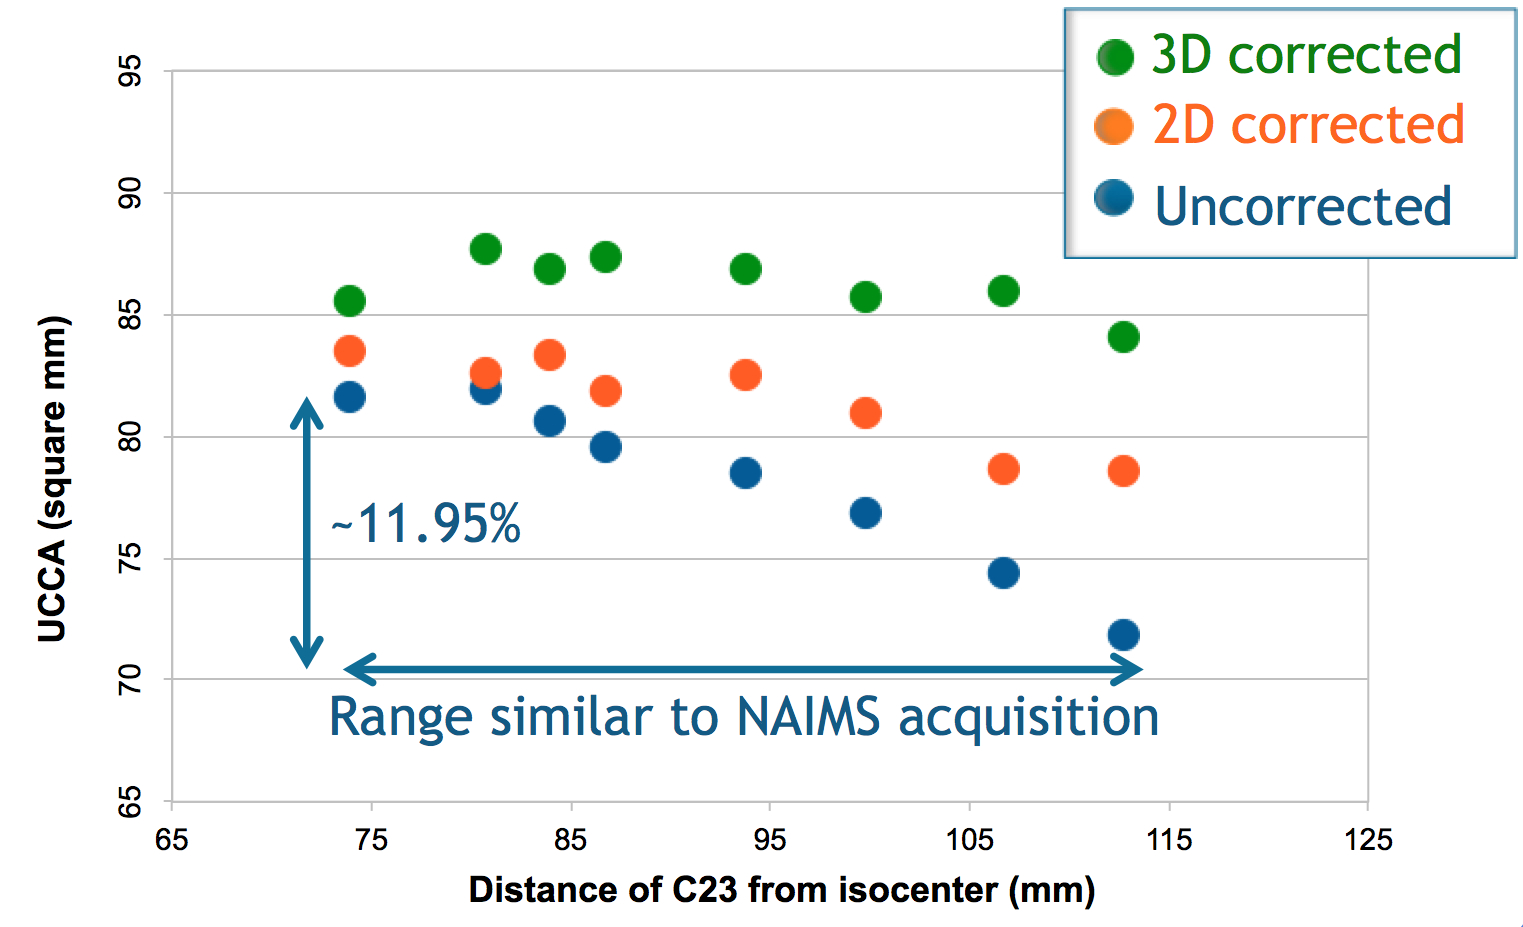
2) A site-specific quadratic decrease in UCCA as a function of C2I was found in the two HC scanned without distortion correction. 2D correction was suboptimal, while 3D improved correction (Figure 3). The decrease in UCCA with C2I observed on the MS patient scanned at the 7 sites presumably reflected the combination of site-specific quadratic dependencies.
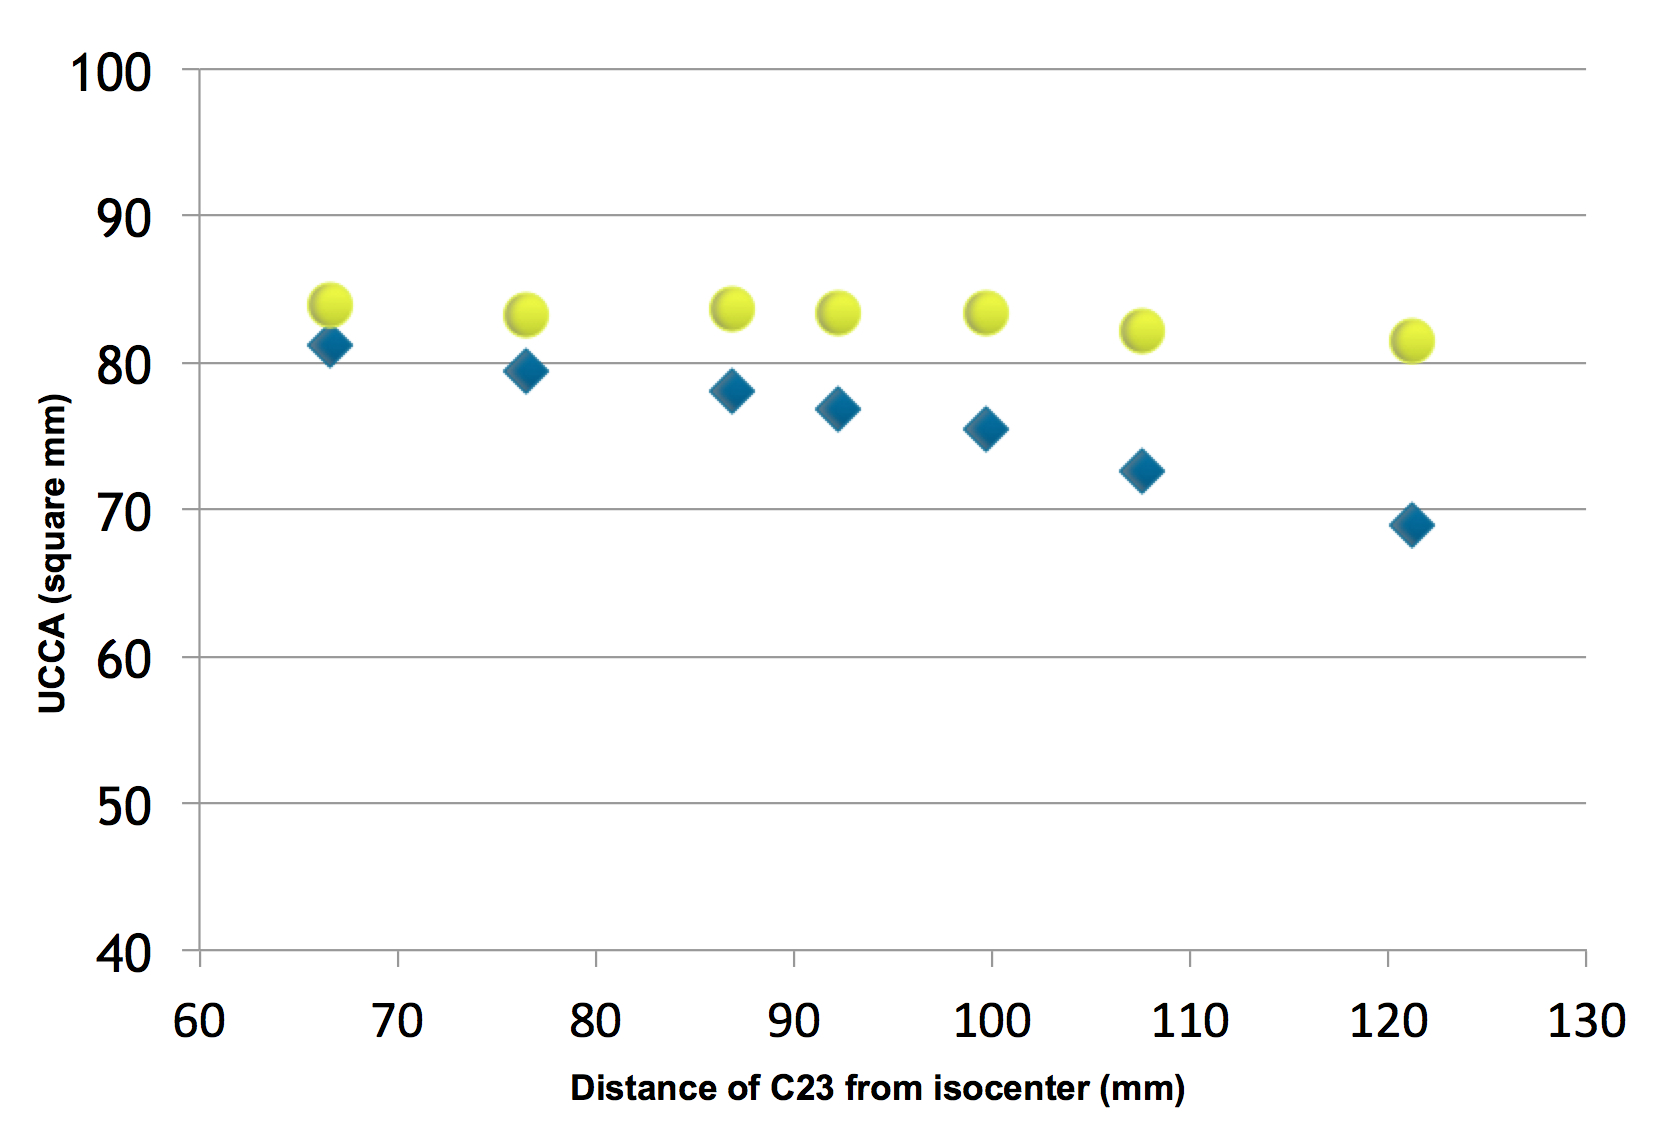
3) The fit of the phantom data was used to retrospectively correct the two HC data. The maximum difference between UCCA measurements was reduced from about 12% to less than 4% (Figure 4).
4) Dividing the UCCA measurements for Vert(C2I) substantially reduced the variability in function of C2I, for both the HC (from about 12% to less than 4%, Figure 5) and the MS patient (9.6% to less than 2% for the extreme table positions).
DISCUSSION AND CONCLUSION
These data show that distance from the scanner isocenter is potentially a major source of variability for UCCA estimation in brain MPRAGE acquisitions if distortion correction is not used. Such variability dwarfs typical clinical changes in UCCA over relevant time spans (1-2 years). Defining a consistent positioning with respect to the isocenter seems warranted. Our data suggest that when planning new acquisitions to measure UCCA from standard brain high-resolution 3D T1-weighted acquisitions, the use of a 3D correction is optimal.
When working on data acquired with no (or with suboptimal) distortion correction, methods based on spherical harmonics description of the gradients should be ideally used9. These methods are however difficult to be implemented in clinical environments.
Phantom scans and a quadratic fit can also be used to reduce the variability introduced by gradient non-linearity on UCCA measurements.
Normalization with diameters of a structure that is expected to be relatively stable with time and pathology (the C2 vertebral body) is also proposed to correct data. Such measurement can be difficult and not very precise in some experimental conditions, therefore this method needs to be further explored in larger datasets.
Acknowledgements
No acknowledgement found.References
1. Bakshi R, Dandamudi VS, Neema M, et al. Measurement of brain and spinal cord atrophy by magnetic resonance imaging as a tool to monitor multiple sclerosis. J Neuroimaging 2005;15:30S-45S.
2. Lin X, Tench CR, Evangelou N, et al. Measurement of spinal cord atrophy in multiple sclerosis. J Neuroimaging 2004;14:20S-6S.
3. Kearney H, Miller DH, Ciccarelli O. Spinal cord MRI in multiple sclerosis--diagnostic, prognostic and clinical value. Nat Rev Neurol 2015; 11:327-38.
4. Lukas C, Knol DL, Sombekke MH, et al. Cervical spinal cord volume loss is related to clinical disability progression in multiple sclerosis. J Neurol Neurosurg Psychiatry 2015; 86:410-8.
5. Gass A, Rocca MA, Agosta F, et al. MRI monitoring of pathological changes in the spinal cord in patients with multiple sclerosis. Lancet Neurol 2015;14:443-54.
6. Liu Y, Lukas C, Steenwijk MD, et al. Multicenter Validation of Mean Upper Cervical Cord Area Measurements from Head 3D T1-Weighted MR Imaging in Patients with Multiple Sclerosis. AJNR Am J Neuroradiol. 2015 Dec 10. [Epub ahead of print]
7. Liu Z, Yaldizli Ö, Pardini M, et al. Cervical cord area measurement using volumetric brain magnetic resonance imaging in multiple sclerosis. Mult Scler Relat Disord 2015; 4:52-7.
8. Horsfield MA, Sala S, Neema M, et al. Rapid semi-automatic segmentation of the spinal cord from magnetic resonance images: application in multiple sclerosis. Neuroimage. 2010 Apr 1;50(2):446-55.
9. Jovicich J, Czanner S, Greve D, et al. Reliability in multi-site structural MRI studies: effects of gradient non-linearity correction on phantom and human data. Neuroimage. 2006 Apr 1;30(2):436-43.
Figures