2424
A Novel Expectation Maximization based Multi Voxel Spatial Regularization Algorithm with Stimulated Echo Contribution (MVSR-STE) for Multi Component Analysis of the Quantitative T2 Relaxometry1Radiology, University of Pennsylvania, Philadelphia, PA, United States, 2Klinik und Poliklinik für Neuroradiologische Diagnostik und Intervention, Universitätsklinikum Hamburg-Eppendorf, Hamburg, Germany
Synopsis
Problem: The quantification accuracy of myelin water fraction mapping based on multi echo spin echo (MESE) T2 relaxometry is compromised due to high SNR requirement, along with the need to account for contributions from stimulated echo pathways.
Methods: A novel expectation-maximization post-processing method, with convergence guaranty, is proposed, which accounts for stimulated contributions intrinsically, while simultaneously improving noise robustness by utilizing spatial correlation from 3D local neighborhood.
Results & Conclusions: Results demonstrate improved quantifications as a result of the proposed algorithm.
PURPOSE
Quantitative T2 relaxometry (QT2R) is commonly used to quantify tissue damages in white matter (WM) diseases such as multiple sclerosis1,2, stroke3 and even non-neurological diseases. The quantification accuracy is compromised due to stimulated echo contributions and noise instability4. To handle aforementioned issues, a novel expectation-maximization post-processing method is proposed with following improvement over previously proposed method5 : i) Iterative reconstruction with convergence guaranty. ii) Utilization of 3D filter being used to capture local spatial correlation.THEORY
T2-decay can be written as the linear function of underlying T2 distributions (x) using the linearized version of extended phase graph (EPG) model5: yEPG= AEPGx + ε, with AEPG(i,j)= intensity at echo time-point TE(i) due to unit water fraction at T2 value T2(j). We impose the spatial smoothness constraints to improve noise robustness of the reconstruction5:
$$\widehat{x} = arg min_x {||A_{MV}\overline{x}- \overline{y} ||}^2+M_T{||\overline{x}||}^2+\mu_s{||D_s \overline{x}||}^2$$
where column vectors are multivoxel equivalents of x, y and AMV is the block diagonal matrix, with AEPG as its block units. MT is the diagonal matrix with voxelwise temporal regularization √μT along its diagonal and µS is spatial regularization parameter. Matrix DS is a 2D/3D first difference operator. The underlying solver (sparse NNLS) of Eqn. [1], used by Kumar et al.5, is too computational-resource intensive to allow the implementation of 3D operator DS on a work desktop. Hence, L-BFGS-B solver6, a limited-memory variant of Broyden–Fletcher–Goldfarb–Shanno quasi-Newton method with bound, is used.
METHODS
32 echo QT2R data (4 volunteers) was acquired using 3D-nonselective multi-echo-spin-echo (3T scanner, Philips-Ingenia): matrix 128x96x16, receiver-bandwidth 355 kHz, resolution 2x2x2.5 mm3, TR 2000 ms, PAT-factor 2x1.5; echo-spacing 7.2 ms, averaging 2, acquisition time ~42 min.
Algorithm:
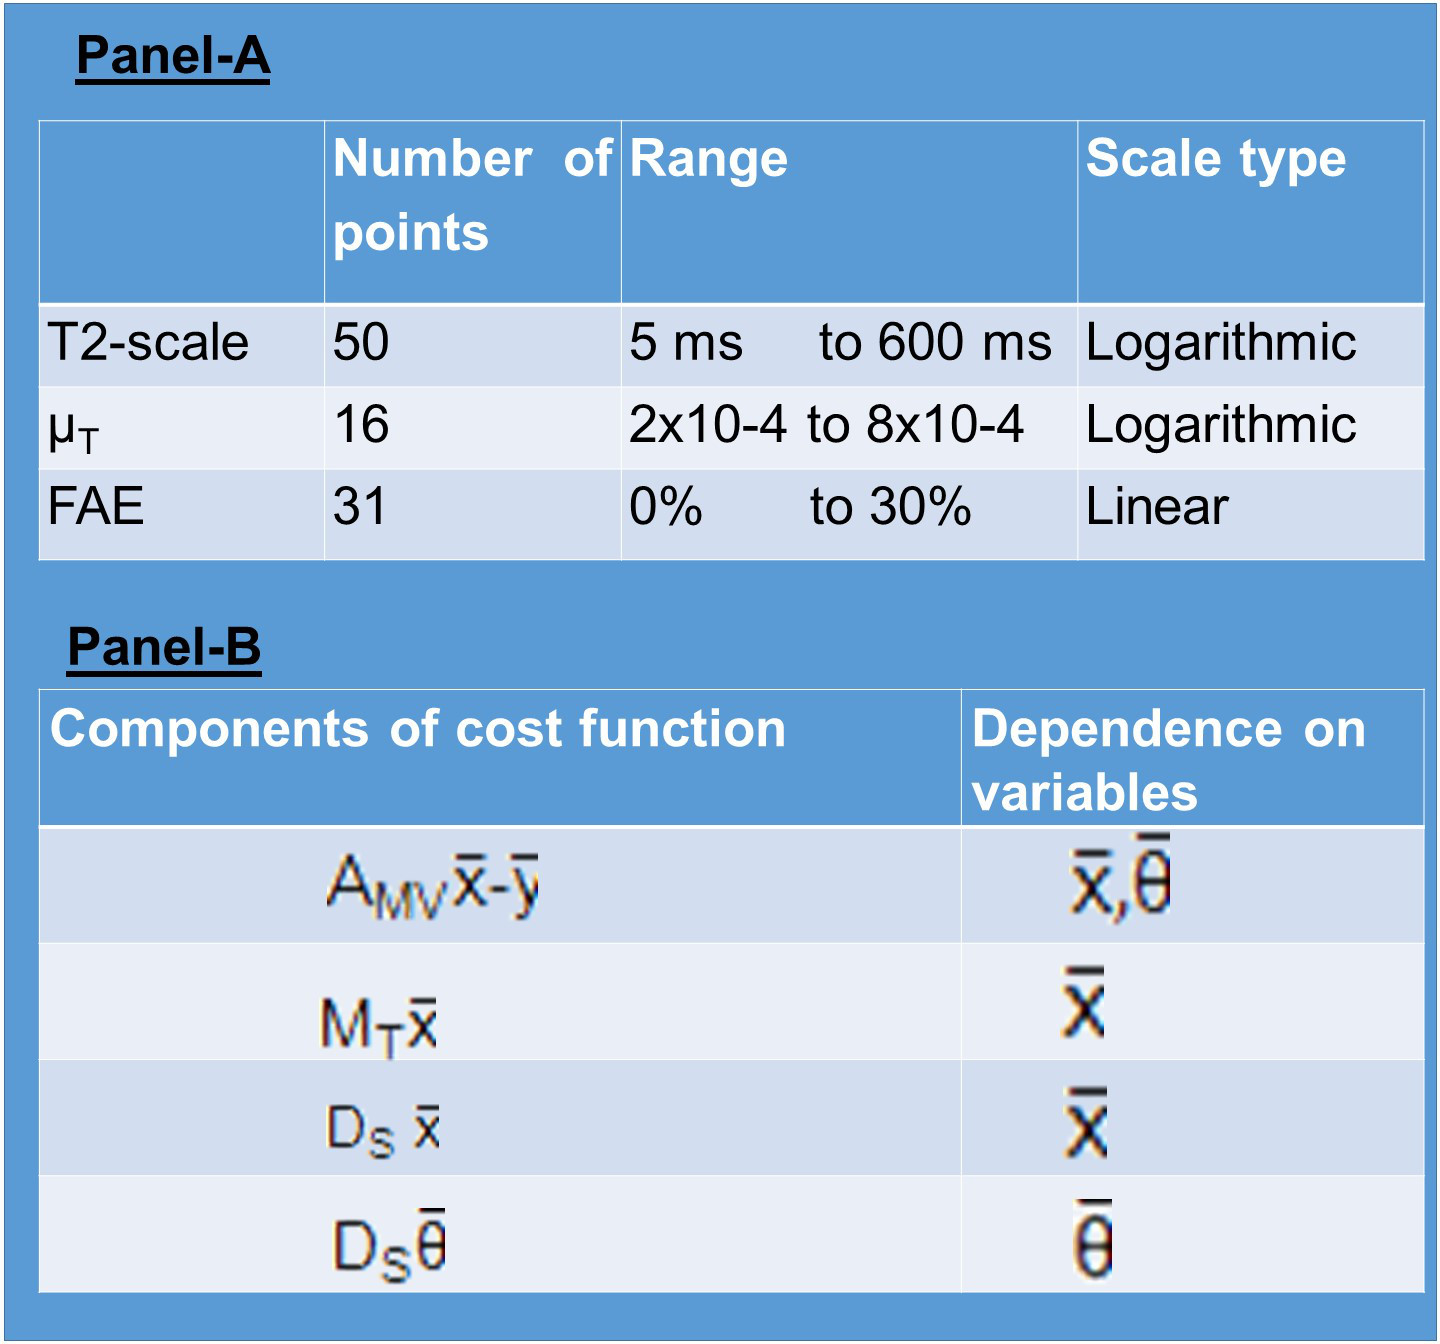
Step-0: Using predefined ranges for μT and FAE as shown in Table 1, Panel-A, μT-map and FAE-map are jointly estimated using the extension of L-curve approach5.
Step-1: For iteration=1, we jump to step-2. For iteration ≥ 2, we minimize a nonlinear expression involving temporally/spatially regularized T2-distribution from previous step/iteration:$$$ \widehat{\theta}=arg min_{\theta} {||A_{MV}(\overline{\theta}) \overline{x}- \overline{y} ||}^2+\mu_{\theta}{||D_{\theta}\overline{{\theta}}||}^2 $$$
Where $$$\overline{\theta}$$$ is the multi-voxel FAE-values; µθ= 0.01x norm(residuals). Using the linearized EPG model, it was possible to precalculcate AEPG as a function of FAEs to expedite calculations of objective.
Step-2: Matrix AMV is constructed based on FAE-map5. With µS= 3000x median(µT-map). Subsequently, Eqn [1] is minimized using L-BFGS-B solver6.
Step-3: Repeat step-1 and step-2 until convergence.
RESULTS
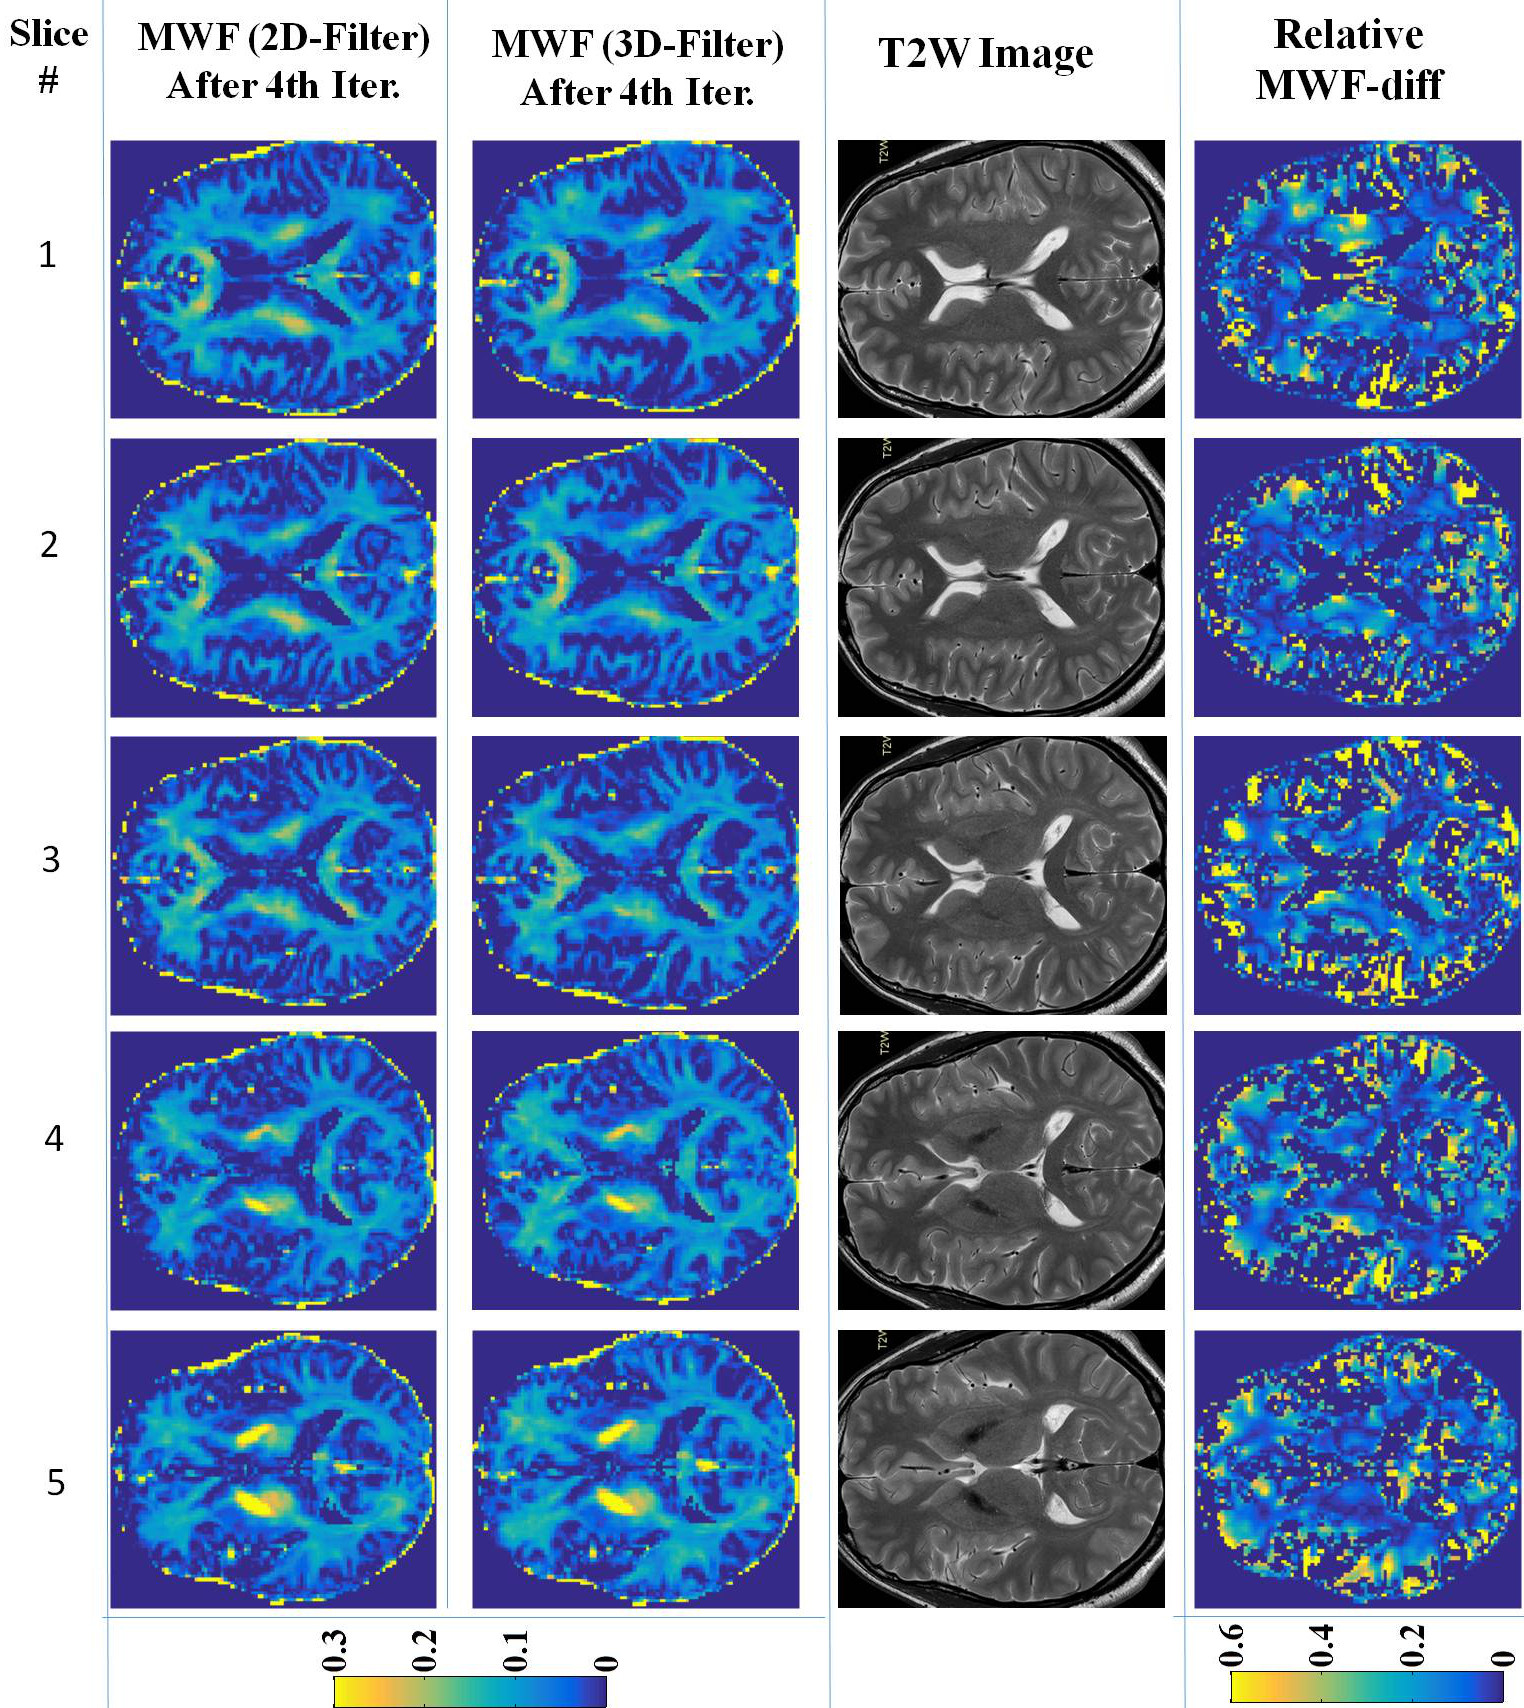
Two versions of our multi voxel spatial regularization (MVSR) algorithm are compared: MVSR-STE2D vs MVSR-STE3D, using 2D and 3D version of DS respectively. MVSR-STE2D with single iteration is equivalent to the method of Kumar et al.5.
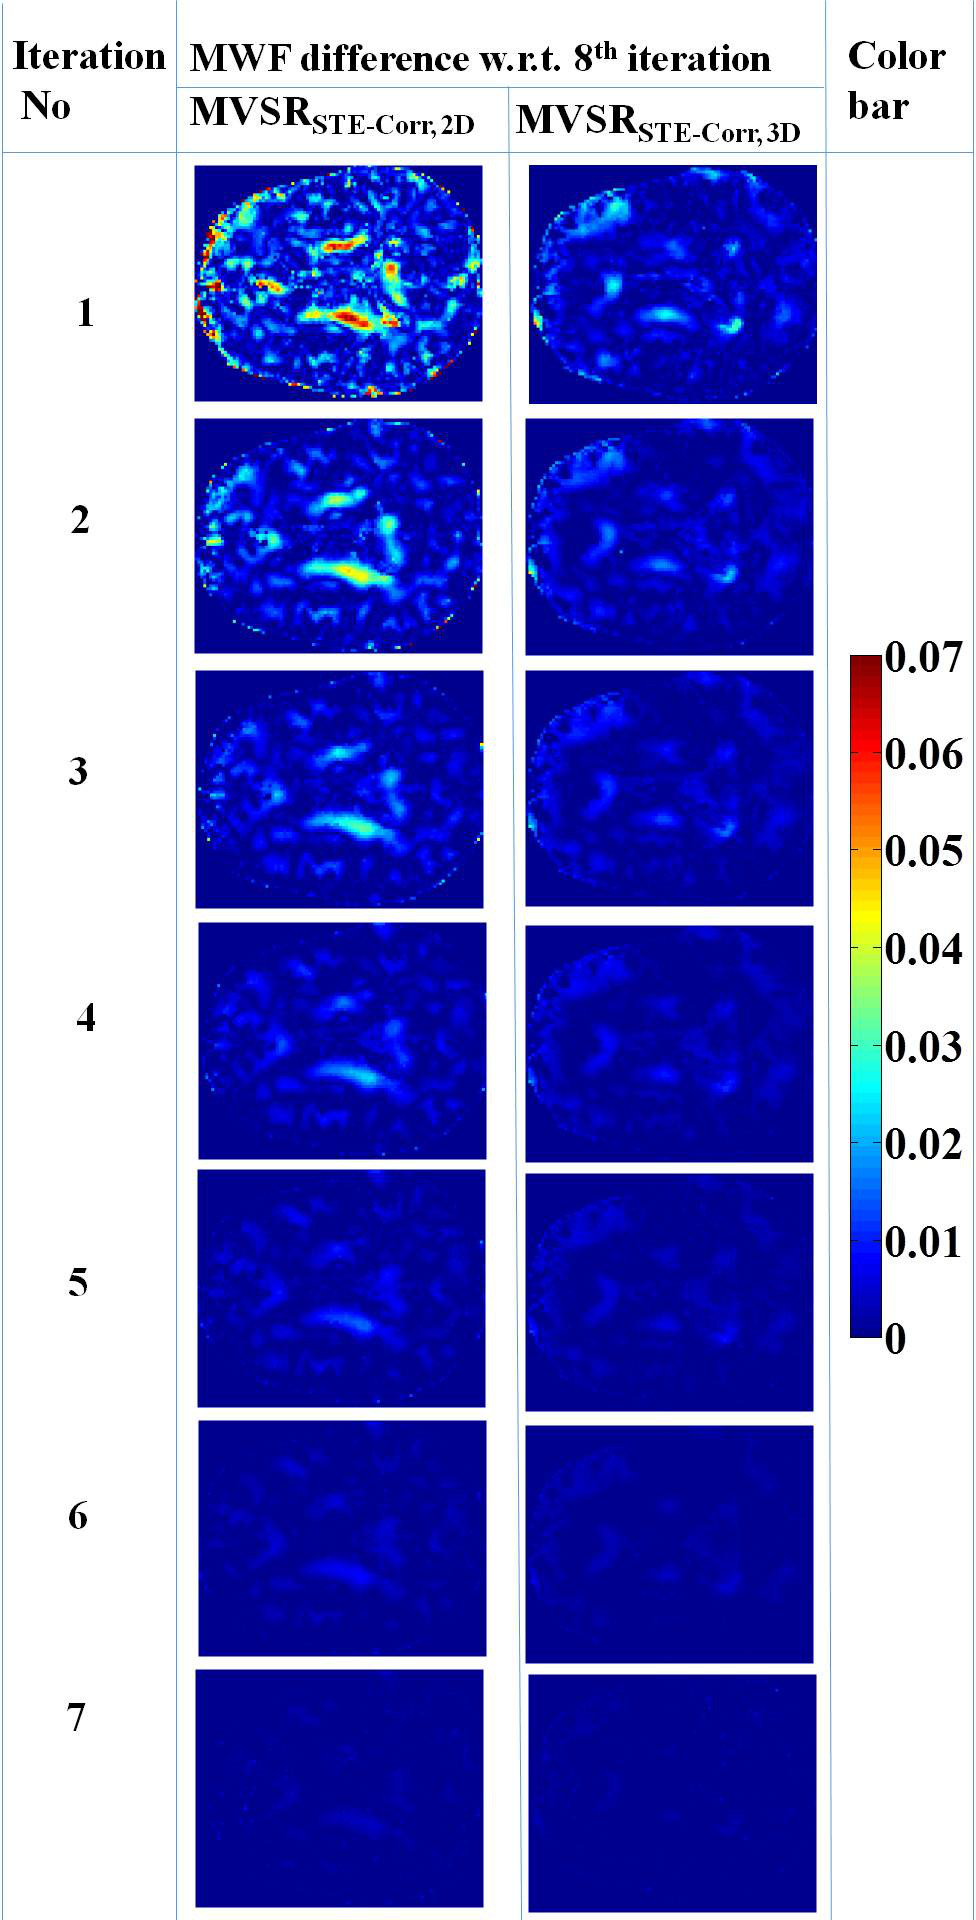
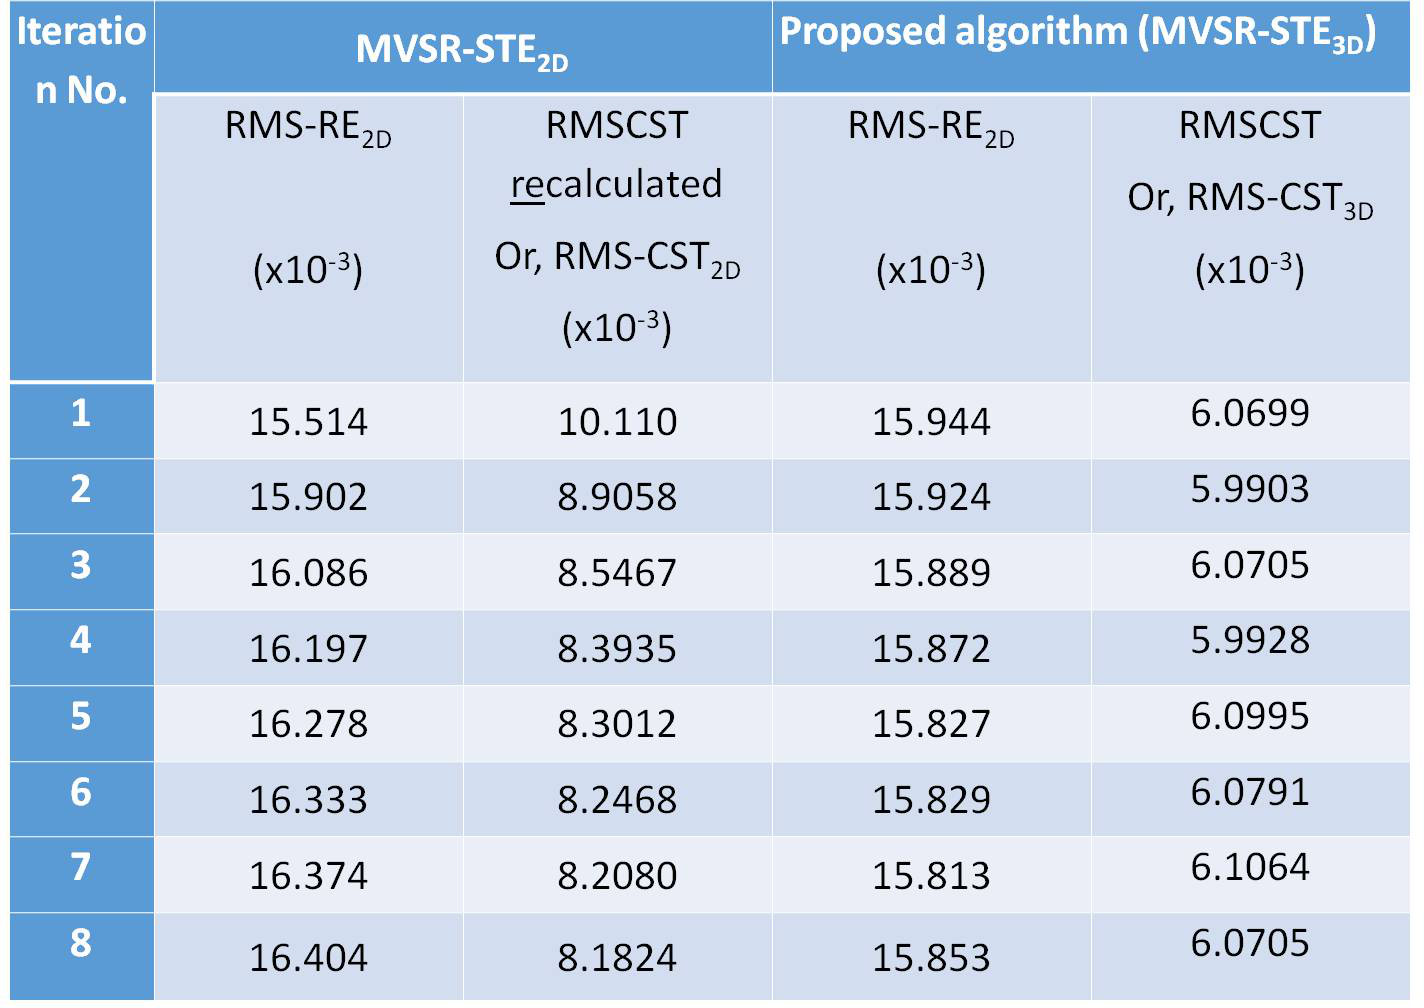
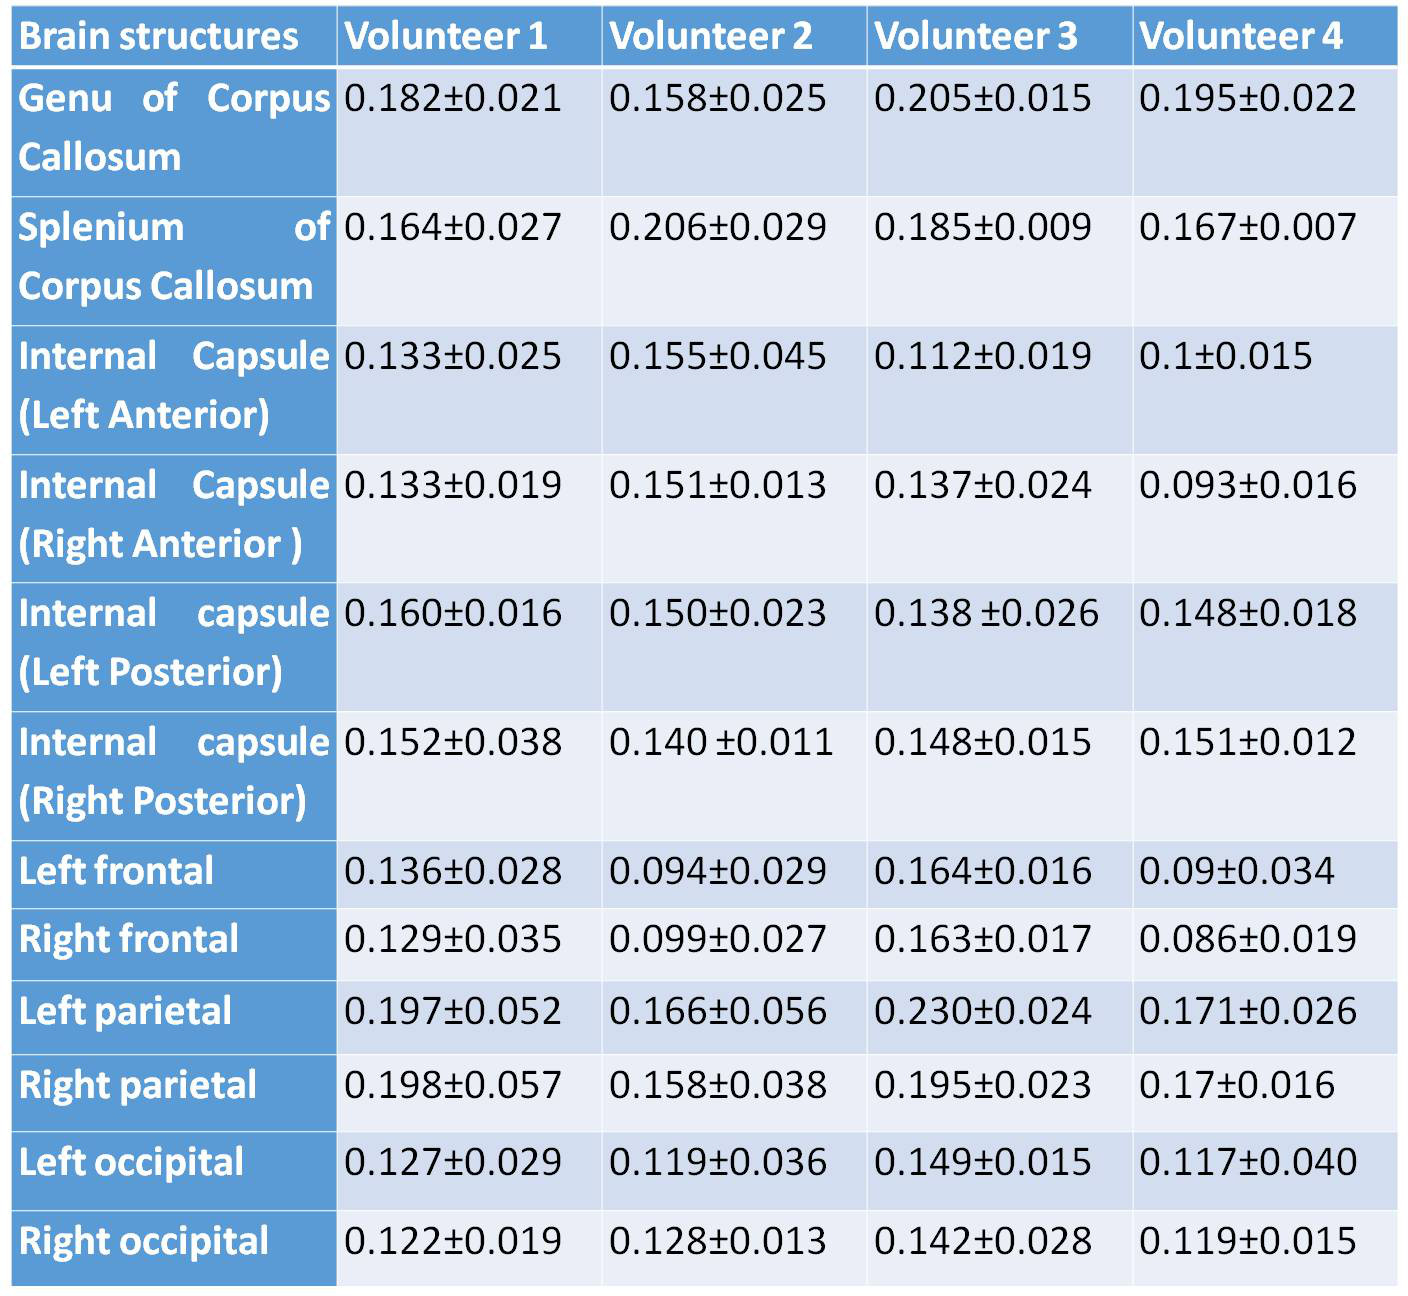
MWF-difference between both methods are appreciable in most of WM tracts (Fig 1). Consistent with corresponding darker contrast on T2W images, both methods show hyperintensities on MWF-maps of slices 4, 5. However, MVSR-STE2D also shows hypertensities in the central parts of WM of slice 1,2, which are inconsistent with corresponding T2W contrasts. Also, looking at the convergence pattern of slice 2 (Fig. 2), hyperintensities on MWF-map2D vanish after 6th iterations. Further, 4th iteration of MVSR-STE3D shows quantifications similar to 6th iteration for MVSR-STE2D (Fig.1), indicating the faster convergence for proposed algorithm. Further, the contribution of spatial prior term (CST), third term in Eqn. [1] after setting µS =1, was calculated along with root mean square of reconstruction error (Table 2). Across all iterations, RMS-CST2D values are appreciably larger than respective RMS-CST3D values, indicating that solutions of the proposed method are better correlated with its 3D neighbors. RMS-RE values for MVSR-STE3D are always lower than MVSR-STE2D, except 1st two iterations. None the less, even for these two iterations, RMS-CST3D values are appreciably smaller than RMS-CST2D values. These evidences along with better convergence rate demonstrate the superiority of our proposed algorithm over our old method5. Over 4 subjects, MWF values extracted using the proposed approach (MVSR-STE3D) and averaged over major WM structures are shown in Table 3.
DISCUSSION
Competing methods either requires explicit assumptions about number of pools and the shape of underlying T2-distributions7,8 as opposed to our minimal assumption of a continuous T2-distribution, or does not utilize correlation between nearest neighbors to improve on noise stability of reconstruction9.
For the cost function:, $$$C(\overline{x},\overline{\theta})={||A_{MV}(\overline{\theta})\overline{x}-\overline{y}||}^2+M_T{||\overline{x}||}^2+\mu_s{||D_s\overline{x}||}^2+\mu_{\theta}{||D_{\theta}\overline{{\theta}}||}^2$$$, our algorithm is equivalent to EM algorithm and hence, the convergence is guaranteed. Terms 2nd-4th only depend on either $$$\overline{x}$$$ or $$$\overline{\theta}$$$ alone (Table-1, Panel-B), hence, we only minimize relevant part of the cost function in Eqns [1] and [2].
CONCLUSION
Our algorithm shows a significant improvement in myelin quantification in most WM areas.
Acknowledgements
This project was partly supported by the National Institute of Biomedical Imaging and Bioengineering of the National Institutes of Health (Grant Number P41-EB015893) and the National Institute of Neurological Disorders and Stroke (Award Number R01NS087516).
All authors would like to thank Dr. Hendrik Kooijman, Philips Healthcare, Hamburg, Germany for providing valuable support and guidance regarding the optimization of sequence. We would also like to thank Prof. Stephen Becker, Applied Mathematics, University of Colorado at Boulder, USA for sharing his L-BFGS-B code. We would also like to thank Mr. Mohamad Nawab Alam, Dept. of Electric Engineering, Indian Institute of Technology, Roorkee, India for help in develop genetic algorithm for minimizing expression in Eqn [2], though it was not used in here as we were able to get better performance from “lsqnonlin” solver.
References
1. Laule C, Vavasour IM, Moore GR, Oger J, Li DK, Paty DW, MacKay AL. Water content and myelin water fraction in multiple sclerosis. A T2 relaxation study. J Neurol 2004;251(3):284-293.
2. Neema M, Goldberg-Zimring D, Guss ZD, Healy BC, Guttmann CR, Houtchens MK, Weiner HL, Horsfield MA, Hackney DB, Alsop DC, Bakshi R. 3 T MRI relaxometry detects T2 prolongation in the cerebral normal-appearing white matter in multiple sclerosis. Neuroimage 2009;46(3):633-641.
3. Kumar D, Ludewig P, Raj A, Magnus T, Fiehler J, Heesen C, Sedlacik J, Siemonsen S. Preclinical Study of Stroke using T2relaxometry and Diffusion Weighted Imaging. In: Proceedings of ISMRM, Salt Lake City, USA 2013:2923.
4. Graham SJ, Stanchev PL, Bronskill MJ. Criteria for analysis of multicomponent tissue T2 relaxation data. Magn Reson Med 1996;35(3):370-378.
5. Kumar D, Siemonsen S, Heesen C, Fiehler J, Sedlacik J. Noise robust spatially regularized myelin water fraction mapping with the intrinsic B1 -error correction based on the linearized version of the extended phase graph model. J Magn Reson Imaging 2016;43(4):800-817.
6. Zhu CY, Byrd RH, Lu PH, Nocedal J. Algorithm 778: L-BFGS-B: Fortran subroutines for large-scale bound-constrained optimization. Acm T Math Software 1997;23(4):550-560.
7. Akhondi-Asl A, Afacan O, Mulkern RV, Warfield SK. T2-relaxometry for myelin water fraction xtraction using wald distribution and extended phase graph. Med Image Comput Comput Assist Interv 2014;17(Pt 3):145-152.
8. Layton KJ, Morelande M, Wright D, Farrell PM, Moran B, Johnston LA. Modelling and estimation of multicomponent T(2) distributions. IEEE Trans Med Imaging 2013;32(8):1423-1434.
9. Prasloski T, Madler B, Xiang QS, MacKay A, Jones C. Applications of stimulated echo correction to multicomponent T2 analysis. Magn Reson Med 2012;67(6):1803-1814.
Figures