2422
Comparison of Susceptibility Weighted Imaging MRI implementations across vendors: Implications for multi-centre studiesMaryam Abaei1, Sjoerd B. Vos2,3, Derek L.G. Hill1, Robin Wolz1,4, Marios C Yiannakas5, Magdalena Sokolska6, Sebastien Ourselin2,7, John Duncan2,8, and David Thomas9,10
1IXICO PLC, London, United Kingdom, 2Translational Imaging Group, CMIC, University College London, London, United Kingdom, 3Epilepsy Society MRI Unit, Chalfont St Pete, United Kingdom, 4Department of Computing, Imperial College, London, United Kingdom, 5UCL Institute of Neurology, University College London, London, London, United Kingdom, 6Department of Medical Physics and Bioengineering, University College Hospital, London, United Kingdom, 7Dementia Research Centre, University College London, London, United Kingdom, 8Department of Clinical and Experimental Epilepsy, UCL Institute of Neurology, Chalfont St Peter, United Kingdom, 9Brain Repair & Rehabilitation, UCL Institute of Neurology, London, United Kingdom, 10Leonard Wolfson Experimental Neurology Centre, UCL Institute of Neurology, London, United Kingdom
Synopsis
Multi-centre, MRI, Susceptibility Weighted imaging, Brain, Clinical Studies
Introduction
Susceptibility Weighted Imaging (SWI) has reached a level that allows its application in multiple clinical and research applications for the visualization of small veins and quantification of iron/calcium deposits1. The strong contrast and non-invasive nature of SWI have made it an attractive alternative to less sensitive conventional sequences. Implementations of SWI are commercially available on all major MRI systems and the number of clinical applications is continuously growing in neurodegenerative disease such as Alzheimer’s disease. Previous studies showed that single-echo SWI is useful in the visualization, but not the quantification of perturbations to B02. Compared to single echo images, multi-echo images have increased SNR and CNR, and consequently improved visibility of small venous3. However, one obstacle that impedes longitudinal clinical and research applications of SWI is the differences in the commercial implementations of SWI from the major MRI vendors. One recently published study investigated the reproducibility and consistency of QSM within healthy adult subjects among multiple sites and reported regional dependency of QSM within and across sites4.Aim
The aim of this study was to evaluate and compare inter-vendor reproducibility of product SWI sequences as clinically implemented by Siemens, Philips and GE.Materials and Methods
Three healthy volunteers (1 Male and 2 Female,
mean age 36 (±8) years) were included. All subjects were scanned at
: (1) GE MR750 (software version DV24_R02);
(2) Philips Achieva (software version 5.1.0.2); (3) Siemens Prisma (software
version VE11C). Each scan session included the vendor’s product 3D SWI (Table 1),
a 3D T1-weighted MPRAGE scan for segmentation and registration purposes and a
3D multi-echo T2*-weighted scan.
For each subject, MPRAGE images were
segmented and regional labels estimated using a joint multi-atlas and Gaussian
mixture model method (GIF)5. SWIs were registered to the MPRAGE
images, and five ROIs (caudate nucleus, putamen, globus pallidus, thalamus and
white matter) were selected from the GIF parcellations (Figure 1). In order to enable a
cross-vendor comparison, the mean SWI signal intensity within each ROI was
normalised using the lateral ventricle ROI as a reference region. Statistical significances between vendors for ROI selections were calculated using repeated measure anova
(P<0.05).Results
Overall there was no significant difference between normalised SWI signal intensity in the caudate nucleus, putamen, globus pallidus, thalamus (Figure 2). Figure 3 shows representative Phase and susceptibility weighted images obtained by different SWI sequences. However there was a significant difference in mean SWI signal intensity in WM (Figure 2).Conclusion
In summary, susceptibility weighted imaging is a technique of high potential to measure changes in iron content and visualise microbleed and small veins in human brain. Based on mean SWI intensity for ROIs presented in Figure 2, the susceptibility weighted images are comparable through different vendors. Our results show that SWI values can be exchanged between vendors and encourage further standardization of SWI implementation among vendors. This is an ongoing study and there will be further assessment including quantitative susceptibility mapping with possibility of increasing number of subjects.Acknowledgements
"We are grateful to the Wolfson Foundation and the Epilepsy Society for supporting the Epilepsy Society MRI scanner."References
1-Haacke EM, Xu Y, Cheng YC, Reichenbach JR. Susceptibility weighted imaging (SWI). Magn Reson Med. 2004 Sep;52(3):612-8. 2-Quinn MP, Gati JS, Klass en LM, Lin AW, Bird JR, Leung SE, et al. Comparison of multiecho postprocessing schemes for SWI with use of linear and nonlinear mask functions. AJNR Am J Neuroradiol (2013) 34.10.3174/ajnr.A3584 3-Denk C, Rauscher A. Susceptibility weighted imaging with multiple echoes. J Magn Reson Imaging. 2010 Jan;31(1):185-91. doi: 10.1002/jmri.21995. 4-Lin PY, Chao TC, Wu ML. Quantitative susceptibility mapping of human brain at 3T: a multisite reproducibility study. AJNR Am J Neuroradiol. 2015 Mar;36(3):467-74. doi: 10.3174/ajnr.A4137 5-M. Jorge Cardoso, Marc Modat, Robin Wolz, Andrew Melbourne, David Cash, Daniel Rueckert, and Sebastien Ourselin.Geodesic Information Flows: Spatially-Variant Graphs and Their Application to Segmentation and Fusion. IEEE Transactions on Medical Imaging, 34(9), 1976-1988. (2015).Figures
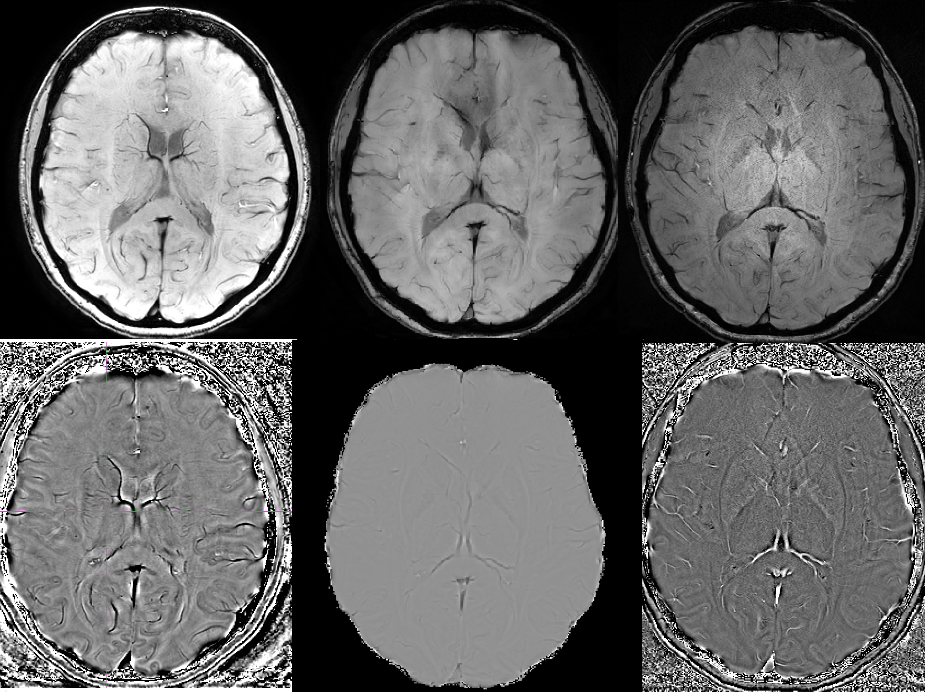
Figure 3: Top row is SWI images from GE
SWAN (top left), Philips SWIp (top middle) and Siemens SWI (Top Right). Botthom
row is Phase images from GE SWAN (bottom left), Philips SWIp (bottom middle)
and Siemens SWI (bottom Right)
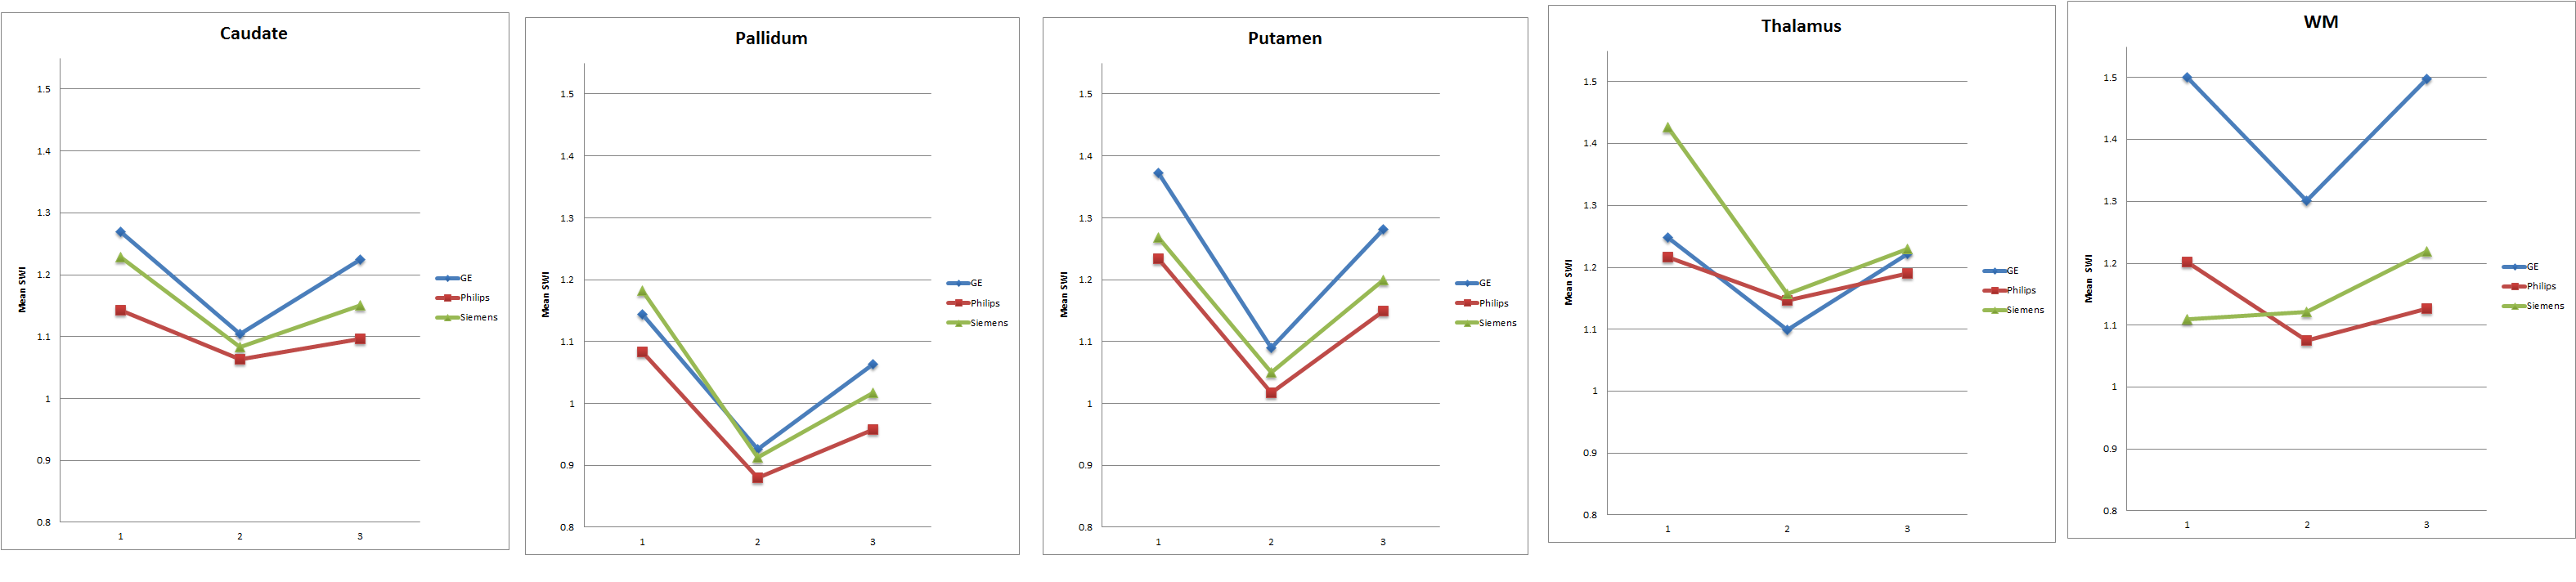
Figure 2: Showing Inter-Vendors
reproducibility for 5 ROIs. Y axis is mean SWI intensity and X axis is
the subject number.
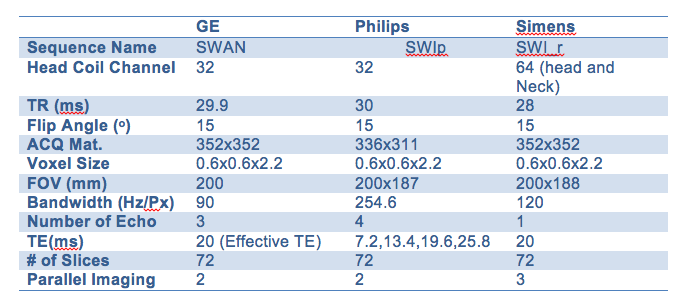
Table 1: Summary of parameters using
vendors latest SWI sequences.
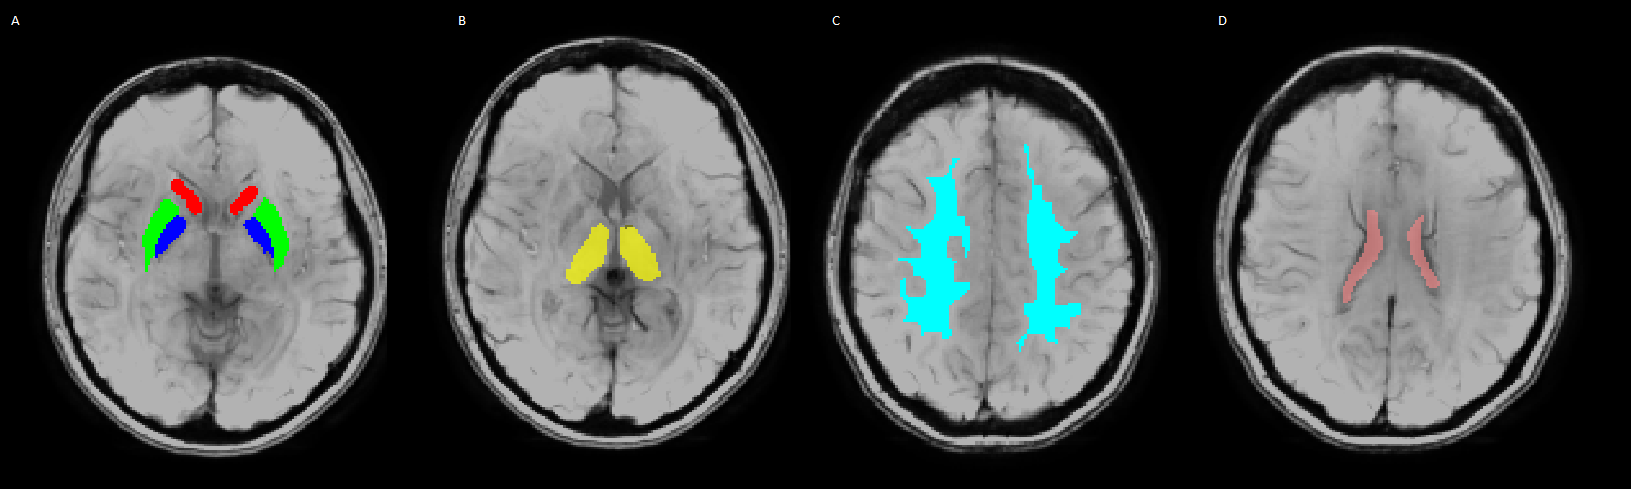
Figure 1: ROIs overlay
susceptibility weighted images including A: Caudate (Red), Putamen (Green), Globus
pallidus (Blue) B: Thalamus (Yellow) C: White matter (Light Blue) and D:
Lateral Ventricle (Pink).