2421
Automated T2 Relaxometry of the Hippocampus1Department of Clinical and Experimental Epilepsy, UCL Institute of Neurology, London, United Kingdom, 2Epilepsy Society MRI Unit, Chalfont St Peter, United Kingdom, 3Translational Imaging Group, Centre for Medical Image Computing, UCL, London, United Kingdom
Synopsis
Hippocampal sclerosis (HS), the most common cause of refractory temporal lobe epilepsy, is associated with hippocampal volume loss and increased T2-signal. These can be identified on quantitative imaging with hippocampal volumetry and T2 relaxometry. Whilst hippocampal segmentation for volumetry has been automated, T2 relaxometry currently involves subjective manual delineation of regions-of-interest. In this work, we validate an automated technique for hippocampal T2 relaxometry and show in a group of healthy controls and patients with HS that a combination of hippocampal volume and T2 values can reliably distinguish the groups and that automated measurement is more reproducible than manual measurement.
Purpose
Hippocampal sclerosis (HS) is the most common cause of refractory temporal lobe epilepsy (TLE). Typical MRI features including hippocampal volume loss and increased T2-weighted signal are not always recognised visually. Quantitative imaging with hippocampal volumetry and T2 relaxometry improves sensitivity1. Whilst volume loss can be quantified automatically2 (https://hipposeg.cs.ucl.ac.uk), T2 relaxometry currently involves subjective manual delineation of regions-of-interest (ROI)3,4,5. We seek to automate and validate this technique.Methods
We analysed 50 patients with TLE and uni- or bilateral HS as determined by a neuroradiologist (mean age 42.8 years, range 18-76, 23 male) and 50 healthy controls (mean age 39.0 years, range 17-66, 28 male). Subjects underwent imaging on a 3T GE MR750 scanner with a 32 channel coil. Sequences included a 3D T1-weighted IR-FSPGR (TE/TR/TI 3.1/7.4/400ms, FOV 224x256x256mm, matrix 224x256x256, SENSE factor 2) and a coronal dual-echo FRFSE (TE 30/119ms, TR 7600ms, FOV 220x220mm, matrix 512x512, slice thickness 4mm, SENSE factor 2). Voxelwise T2 maps were determined using6:
$$T2 = \frac{TE_{2}-TE_{1}}{ln\frac{S1}{S2}}$$
Hippocampi were automatically segmented from the T1-weighted volume using a multi-atlas-based segmentation algorithm (STEPS) and a template database of 400 manual segmentations. Hippocampal volumes were corrected for intracranial volume using linear regression with parameters derived from a group of healthy controls2.
A rigid transformation from the T1-weighted image to the dual-echo PD/T2 image was calculated using NiftyReg (https://sourceforge.net/projects/niftyreg) and applied to the hippocampal segmentations. The segmentations were eroded and voxels with T2 values above 170ms were eliminated to minimise CSF contamination and the mean T2 value determined.
For comparison to previous practice, a radiographer manually determined hippocampal T2 using elliptical ROI on consecutive coronal slices4 in all subjects on two separate occasions. The mean T2 across all ROIs was determined. To assess reproducibility, 20 controls underwent repeat imaging.
Results
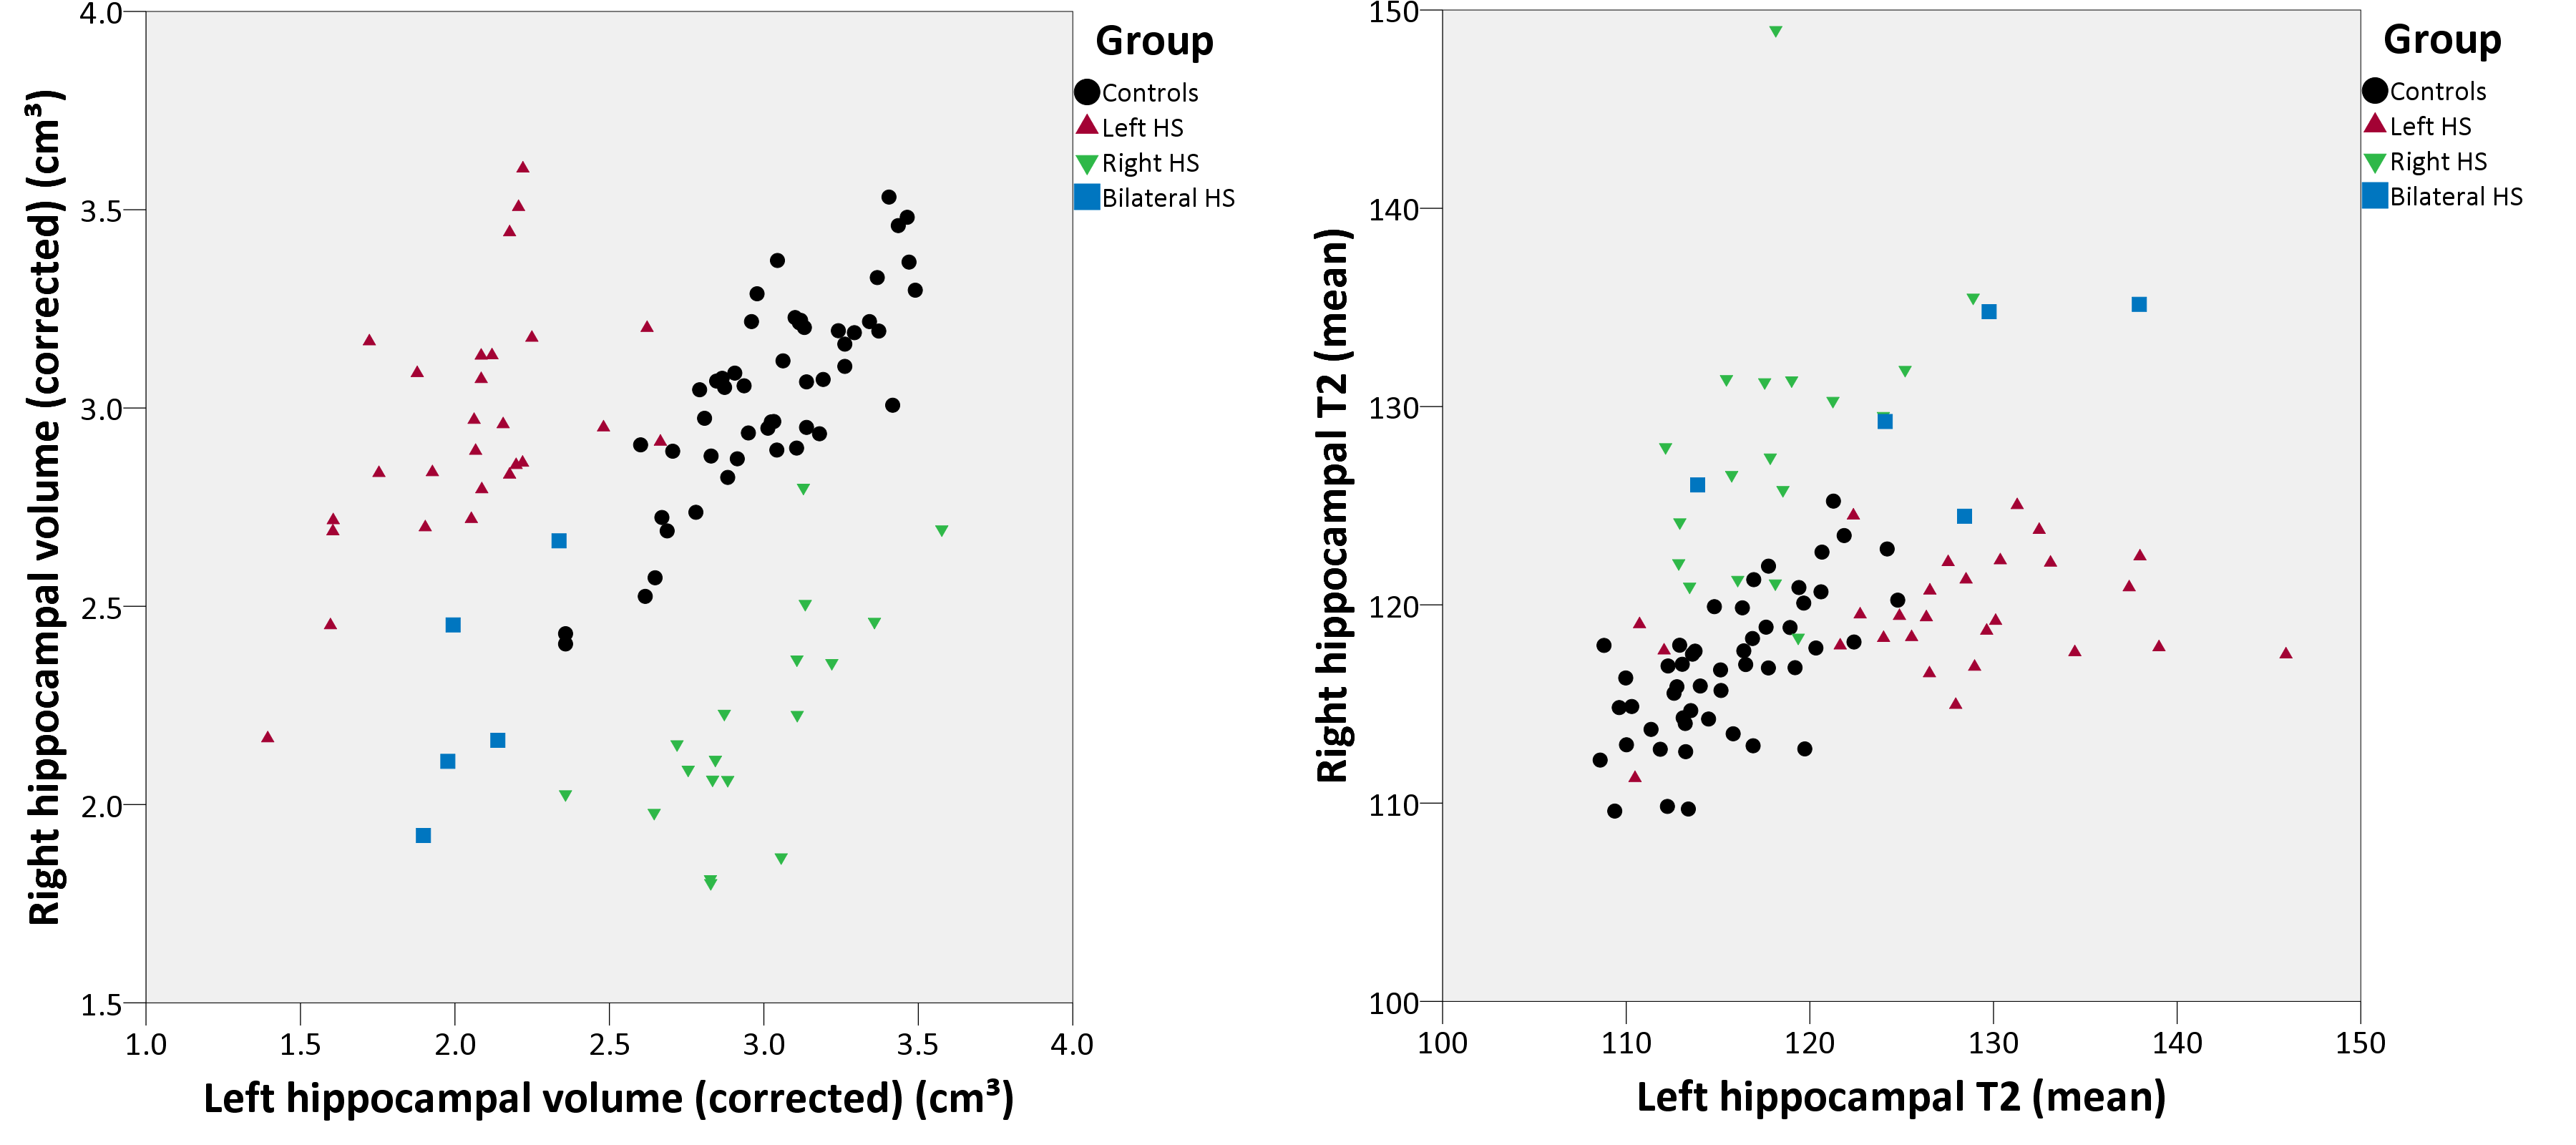
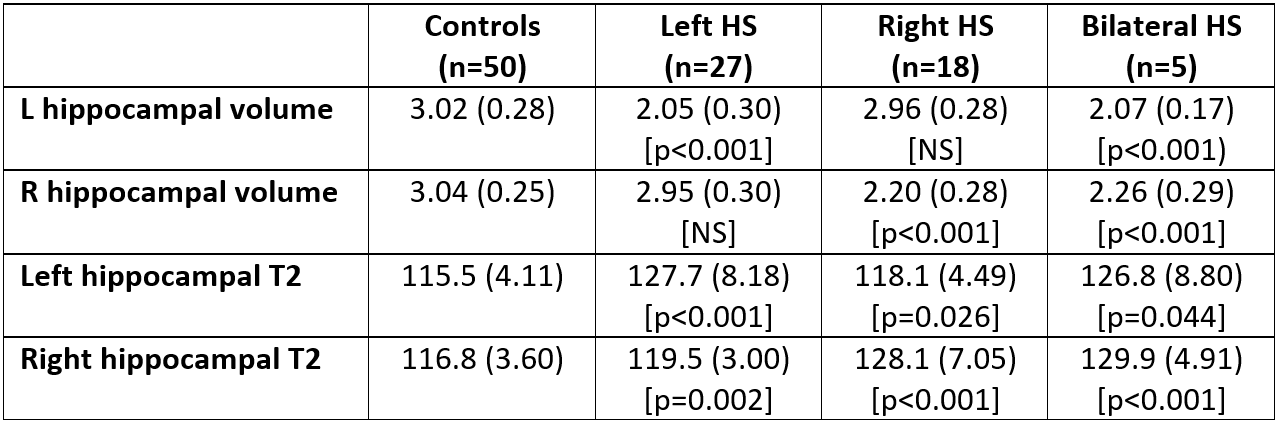
Hippocampal volumes and T2 values were reliably determined using the automated method (Figure 1, Table 1). Left hippocampal volumes were significantly reduced and left hippocampal T2 significantly increased in both left HS (two-tailed t-test, p<0.001 for both) and bilateral HS (p<0.001, p=0.044) compared to controls. Right hippocampal volumes were significantly reduced and right hippocampal T2 significantly increased in right HS (p<0.001 for both) and bilateral HS (p<0.001 for both).
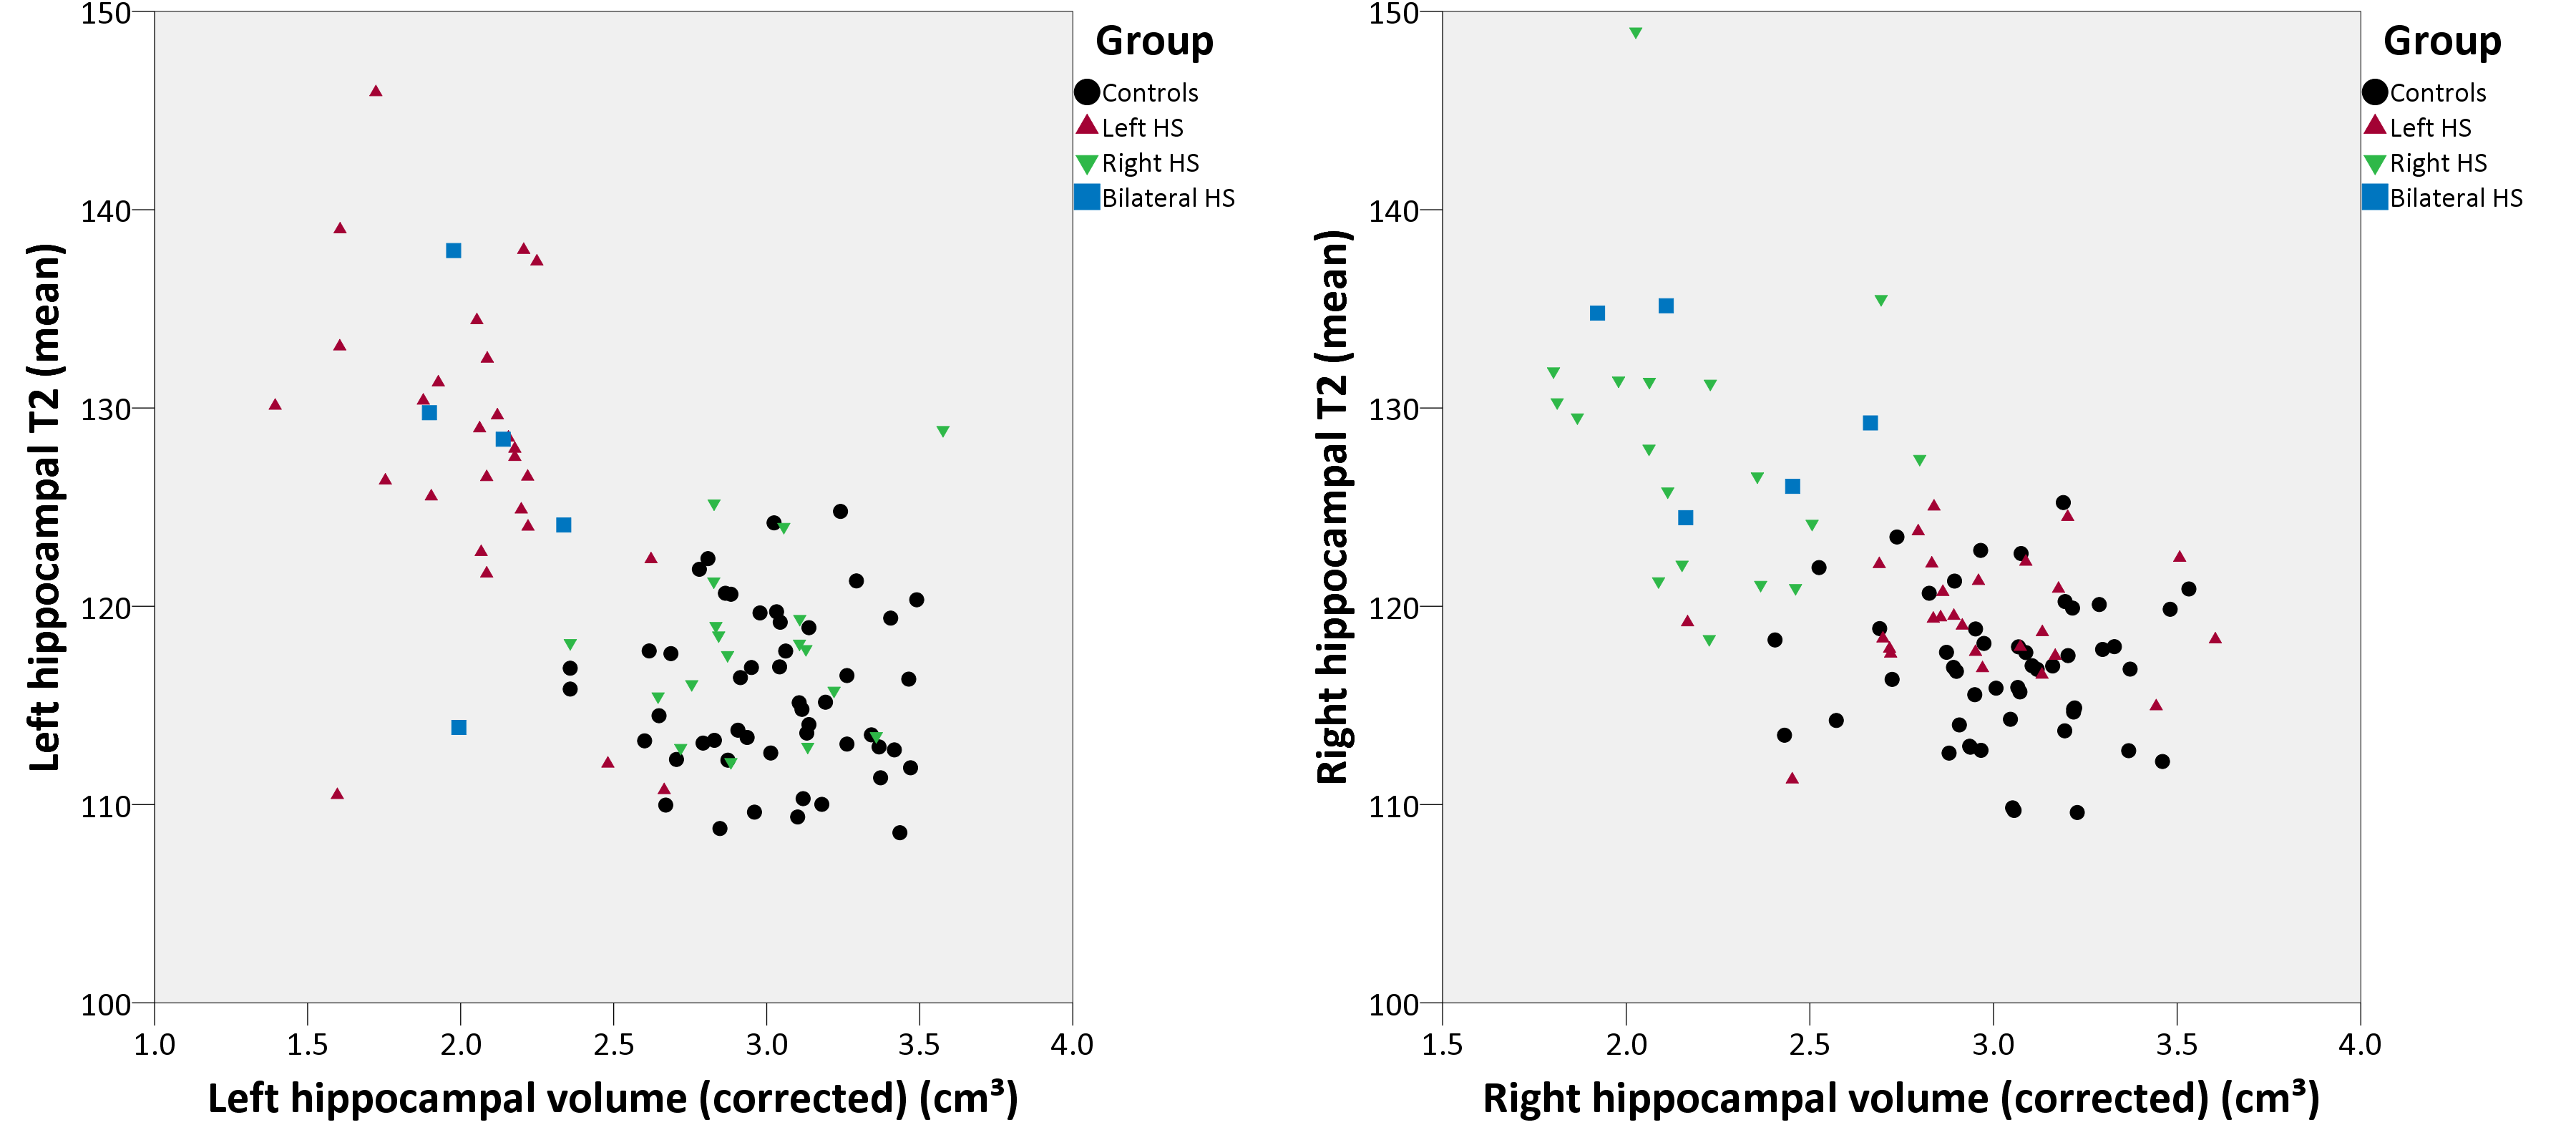
There were no contralateral changes in hippocampal volume but right hippocampal T2 was mildly increased in left HS (p=0.002) and left hippocampal T2 mildly increased in right HS (p=0.026). The combination of hippocampal volume and T2 values gave good separation between groups (Figure 2).
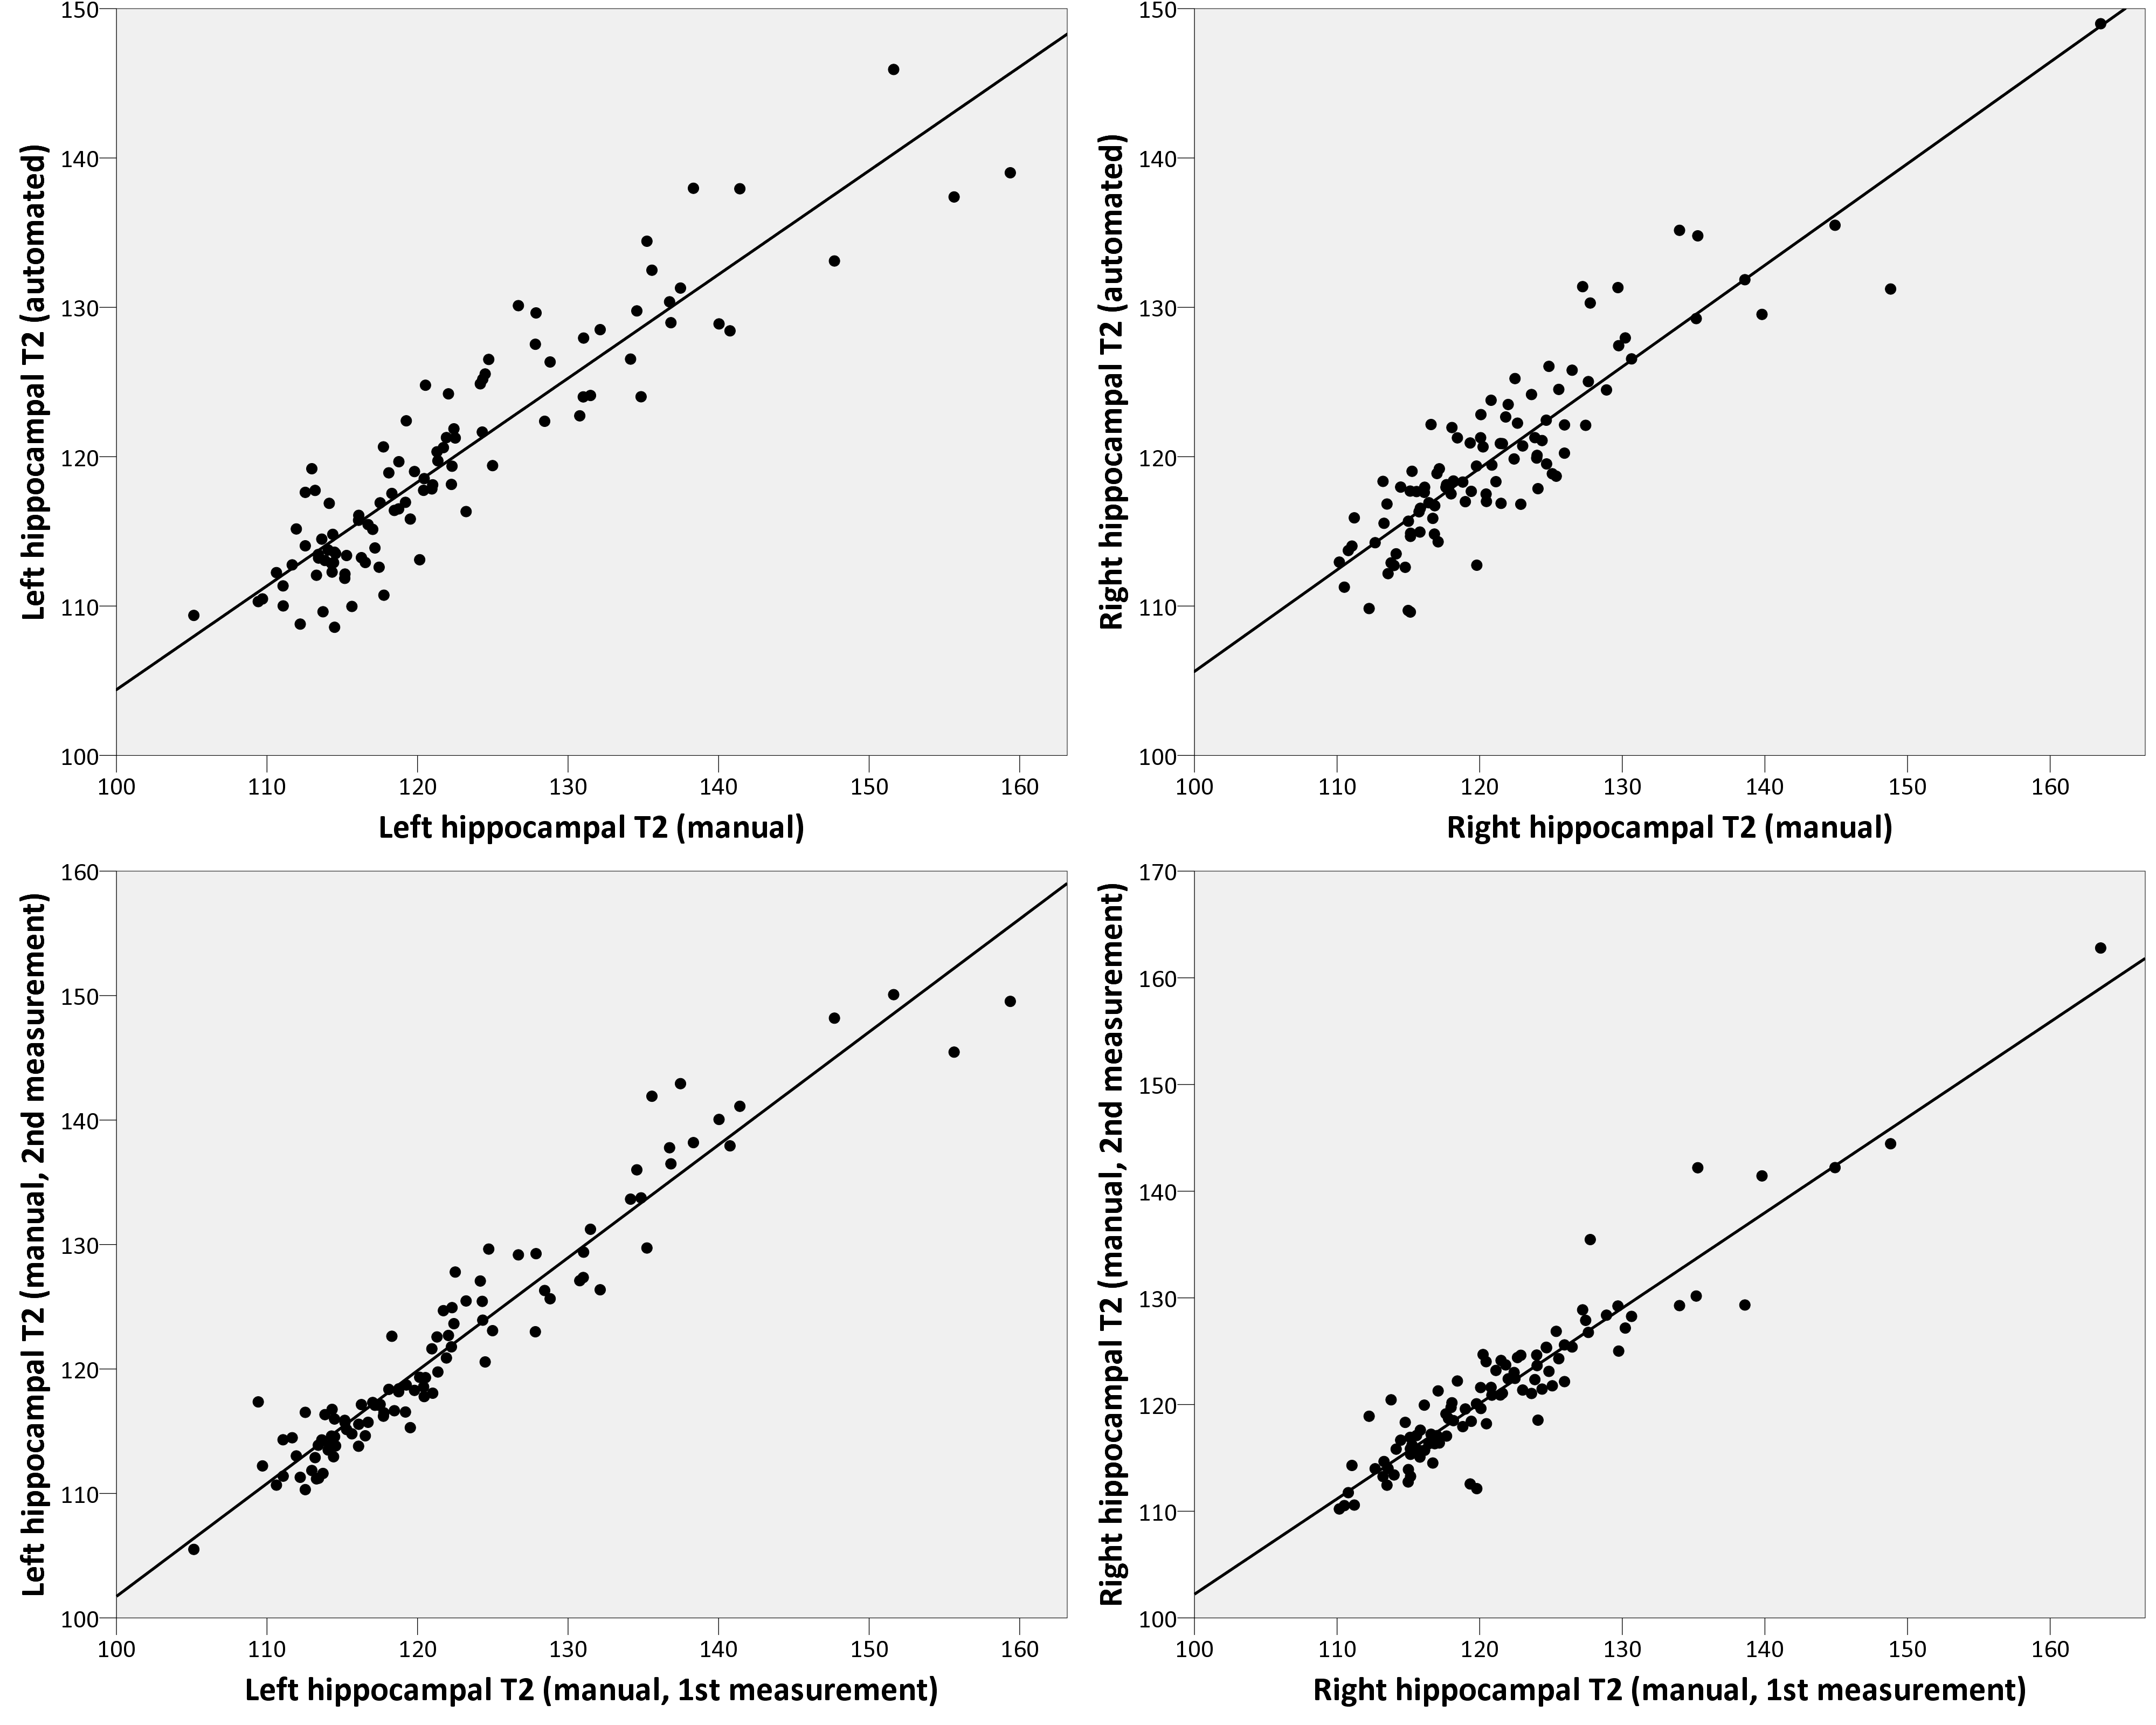
There was a strong correlation between the automated and manual methods for determining hippocampal T2 (Figure 3) with correlations of 0.917 (left, p<0.001) and 0.896 (right, p<0.001). For comparison, the correlation between two manual measurements was 0.964 (left, p<0.001) and 0.942 (right, p<0.001).
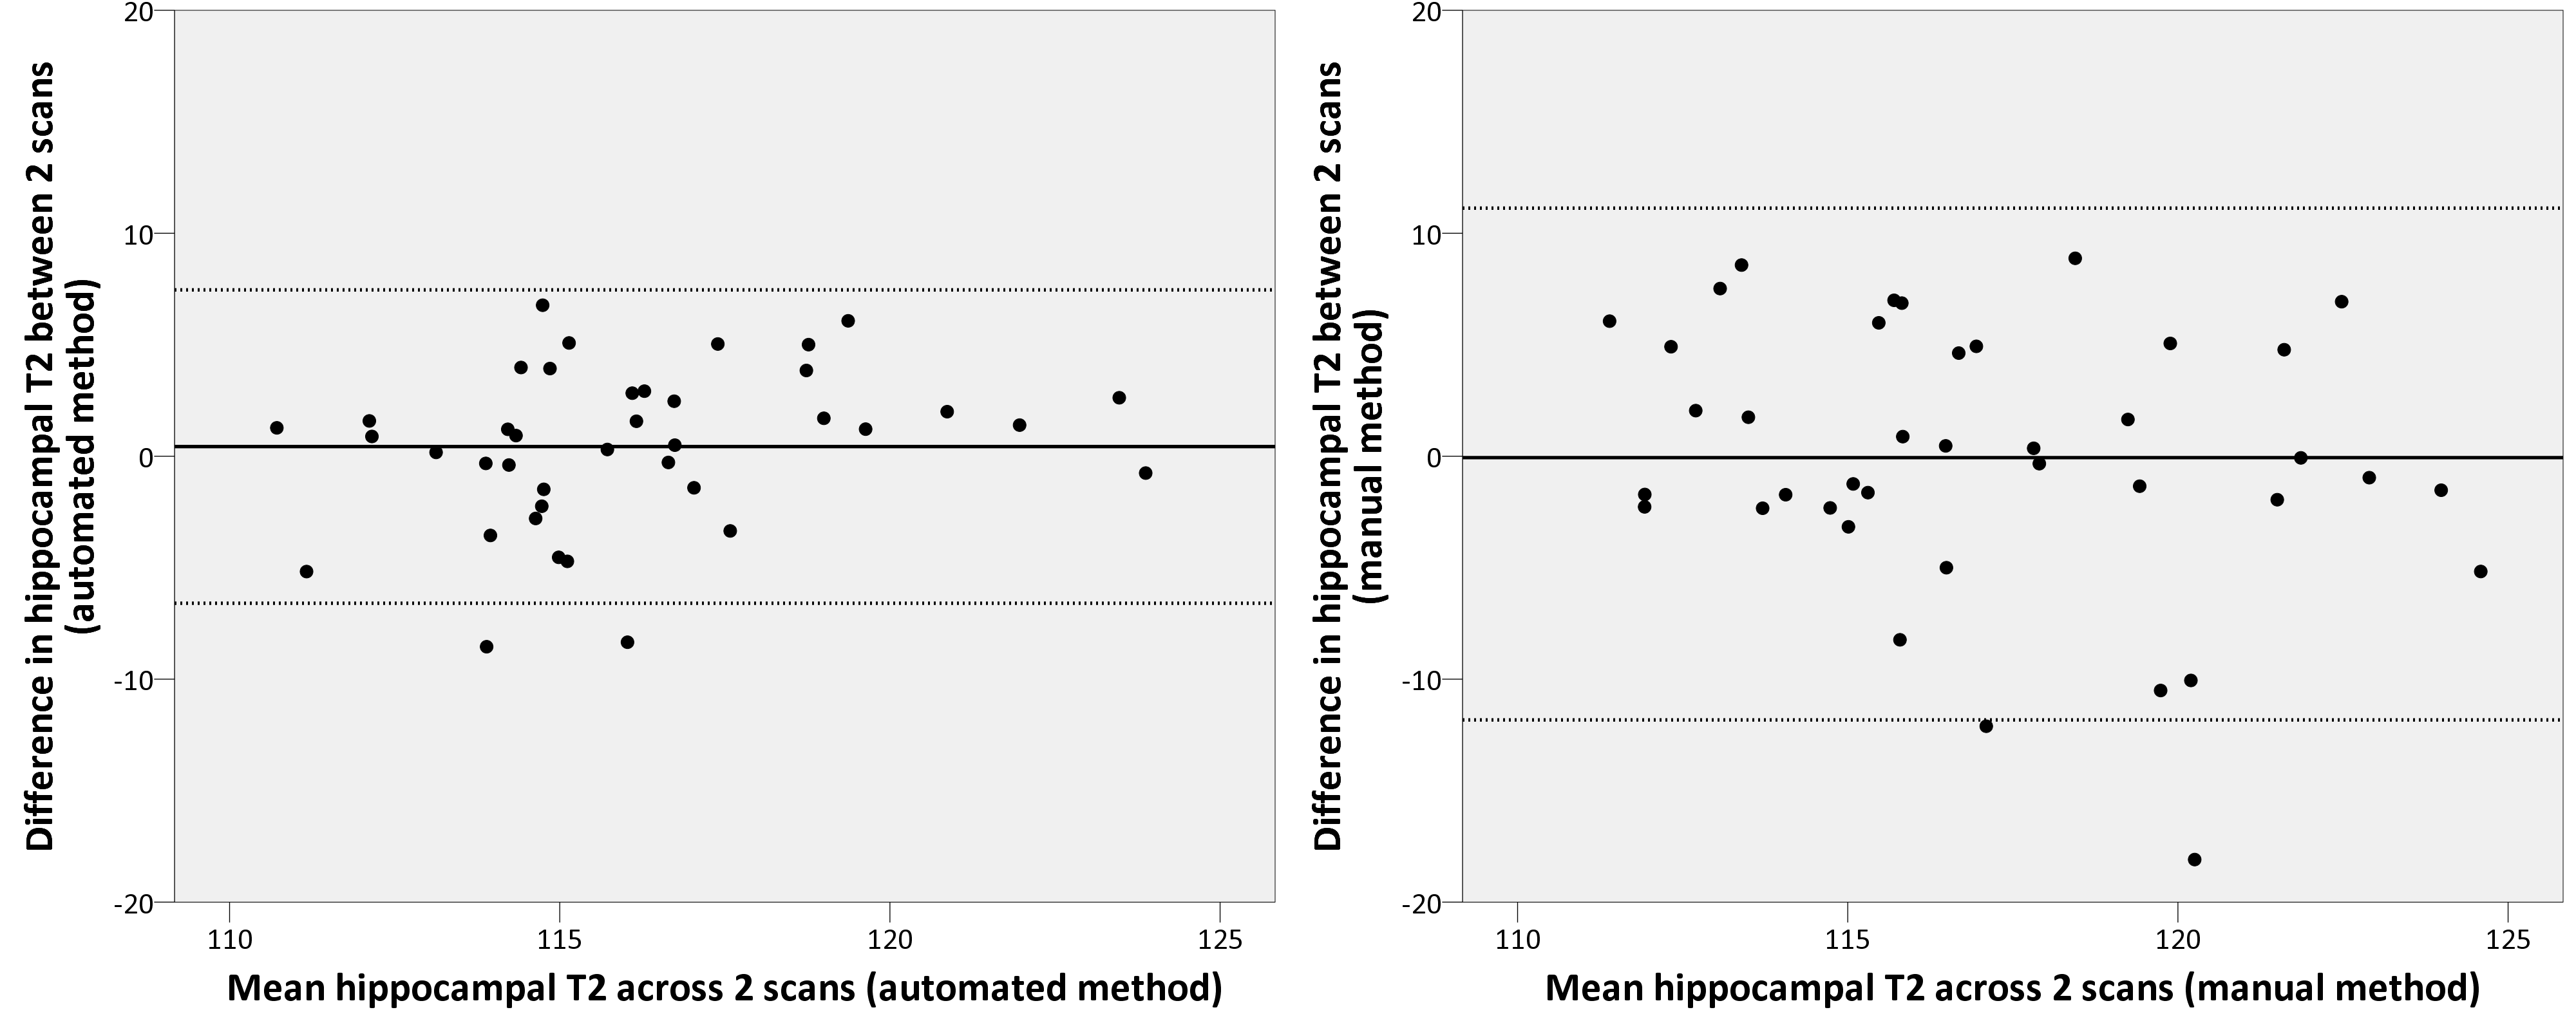
Bland-Altman plots confirm that hippocampal T2 measurements were reproducible between repeat scans (Figure 4). The relative mean absolute difference between the 2 scans was significantly lower with automated T2 mapping (2.5%) than manual determination (3.9%, p=0.019 by Wilcoxon signed rank test).
Discussion
We have shown that our method for automated hippocampal segmentation can be reliably extended to the determination of hippocampal T2 values and that a combination of hippocampal volumes and T2 values can separate subjects with HS from healthy controls. The raised T2 in the contralateral hippocampi of apparently unilateral HS is interesting and may suggest subclinical pathology. This deserves further study, but is in agreement with previous data7.
Elliptical manual regions-of-interest for hippocampal T2 measurements are necessarily limited in size to around 20mm2 per slice to avoid CSF contamination so only sample a small part of the hippocampus. By using an automated segmentation we were able to determine the mean T2 value in the entire hippocampus where cross-sectional areas in a slice can exceed 50mm2. CSF contamination was minimised by eroding the segmentation at the boundary and employing a threshold derived empirically from T2 values in grey matter and CSF of the healthy controls.
There was a good correlation between manual and automatically determined hippocampal T2 values. Although slightly inferior to the correlation obtained by the same radiographer measuring a scan twice, the values would not be expected to be exactly equivalent due to the different sampling discussed above. Automated T2 mapping showed superior reproducibility between scans than manual measurement.
Patients in this study were selected on the basis of visually apparent HS. Future work will extend the work to include those with normal appearing hippocampi but histologically identified HS following surgical treatment. This automated T2 mapping protocol will shortly be introduced into our clinical workflow.
Acknowledgements
We are grateful to the Wolfson Foundation and the Epilepsy Society for supporting the Epilepsy Society MRI scanner. This work was supported by the National Institute for Health Research University College London Hospitals Biomedical Research Centre who funded SBV through their High Impact Initiative. GPW was supported by an MRC Clinician Scientist Fellowship (MR/M00841X/1).References
1. Bernasconi A et al. T2 relaxometry can lateralize mesial temporal lobe epilepsy in patients with normal MRI. Neuroimage 2000;12(6):739-46.
2. Winston GP et al. Automated hippocampal segmentation in patients with epilepsy: available free online. Epilepsia 2013;54(12):2166-73.
3. Jackson GD et al. Detection of hippocampal pathology in intractable partial epilepsy: increased sensitivity with quantitative magnetic resonance T2 relaxometry. Neurology 1993;43(9):1793-9.
4. Bartlett PA et al. T2 relaxometry of the hippocampus at 3T. AJNR 2007;28(6):1095-8.
5. Rodionov R et al. T2 mapping outperforms normalised FLAIR in identifying hippocampal sclerosis. Neuroimage Clin 2015;7:788-91.
6. Duncan JS et al. Technique for measuring hippocampal T2 relaxation time. AJNR 1996;17(10):1805-10.
7. Von Oertzen J et al. Time-efficient T2 relaxometry of the entire hippocampus is feasible in temporal lobe epilepsy. Neurology 2002;58(2):257-64.
Figures