2418
Altered microstructural integrity in patients with tuberous sclerosis complex revealed by whole-brain tract-specific analysis1Institute of Medical Device and Imaging, National Taiwan University College of Medicine, Taipei, Taiwan, 2)Institute of Biomedical Engineering, National Taiwan University College of Medicine, Taipei, Taiwan, 3Department of Pediatrics, National Taiwan University Hospital and National Taiwan University College of Medicine, Taipei, Taiwan, 4Molecular Imaging Center, National Taiwan University, Taipei, Taiwan
Synopsis
To investigate whether the white matter tracts are altered in patients with tuberous sclerosis complex, we used whole-brain tract-specific analysis of diffusion spectrum imaging (DSI) data to measure the alteration of 76 major white matter tracts, and compared the property between 27 patients and 27 matched controls. As compared to the controls, patients showed significantly lower GFA in 13 tracts. The altered microstructural integrity of the white matter tracts in TSC supports the hypothesis of underlying microstructural changes in the brains of TSC.
Purpose:
Tuberous sclerosis complex (TSC) is an autosomal dominant neurocutaneous syndrome affecting about 1 in 6000 newborns.1 About 85% of children and adolescents with tuberous sclerosis have CNS complications, including epilepsy, cognitive impairment, challenging behavioral problems, and autism.2 Pathological studies indicated that axons in TSC patients showed less integrity of myelination.3 Wong et al. used Tract-based Spatial Statistical Analysis and found a widespread decrease in cerebral white matter integrity in patients with TSC.4 We hypothesized that white matter integrity of the tract bundles that are related to clinical symptoms should be altered in TSC. Therefore, we used whole-brain tract-specific analysis of diffusion spectrum imaging (DSI) data to investigate the alteration of 76 major white matter tracts.Methods:
Subjects: A total of 44 patients with TSC were recruited in the study. Patients who had large intra-ventricular tumors and those younger than 5 years old were excluded from the analysis. Consequently, 27 patients (age: 23.2± 12.3 14 males and 13 females) and 27 age- and sex-matched healthy controls (age: 22.9± 12.7, 14 males and 13 females) were analyzed. The study was approved by the Institutional Review Board of the hospital and informed consent was obtained from all participants. Imaging: MRI scans were performed on a 3T MRI system (TIM Trio, Siemens, Erlangen) with a 32-channel phased array coil. T1-weighted imaging utilized a 3D magnetization-prepared rapid gradient echo pulse sequence: TR/TE = 2000/3 ms, flip angle = 9o, FOV = 256 × 192 × 208 mm^3, matrix size = 256 × 192 × 208, and spatial resolution = 1 x 1 x 1 mm^3. DSI used a twice-refocused balanced echo diffusion echo planar imaging sequence5, TR/TE = 9600/130 ms, FOV = 200 x 200 mm^2, matrix size = 80 x 80, 56 slices, and slice thickness = 2.5 mm. A total of 102 diffusion encoding gradients with the maximum diffusion sensitivity bmax = 4000 s/mm^2 were applied on the grid points in a half sphere of the 3D q-space with |q| ≤ 3.6 units.6 Analysis: We used whole-brain tract-based automatic analysis to obtain a 2D connectogram for each DSI dataset.7 The connectogram provides generalized fractional anisotropy (GFA) profiles of 76 white matter tract bundles. We calculated the tract means for each tract bundle and evaluated the signed differences between patients and controls. We measured the effect size8 to indicate the significance of the difference between the study groups. Two sample t test was performed to investigate the difference of the mean GFA values between controls and patients. Bonferroni correction was used to account for multiple comparisons.Results:
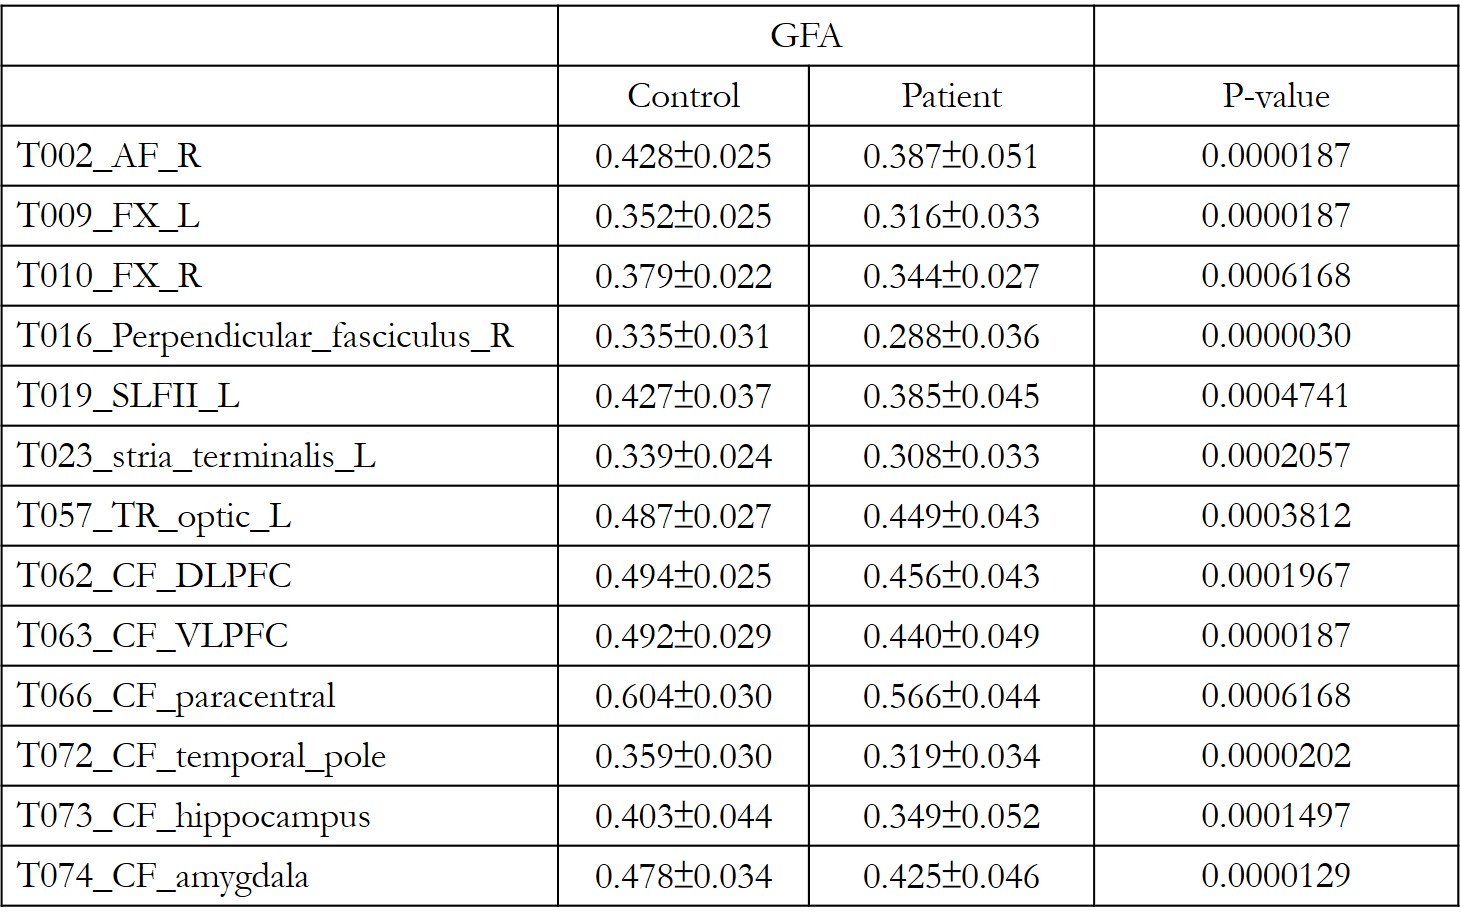
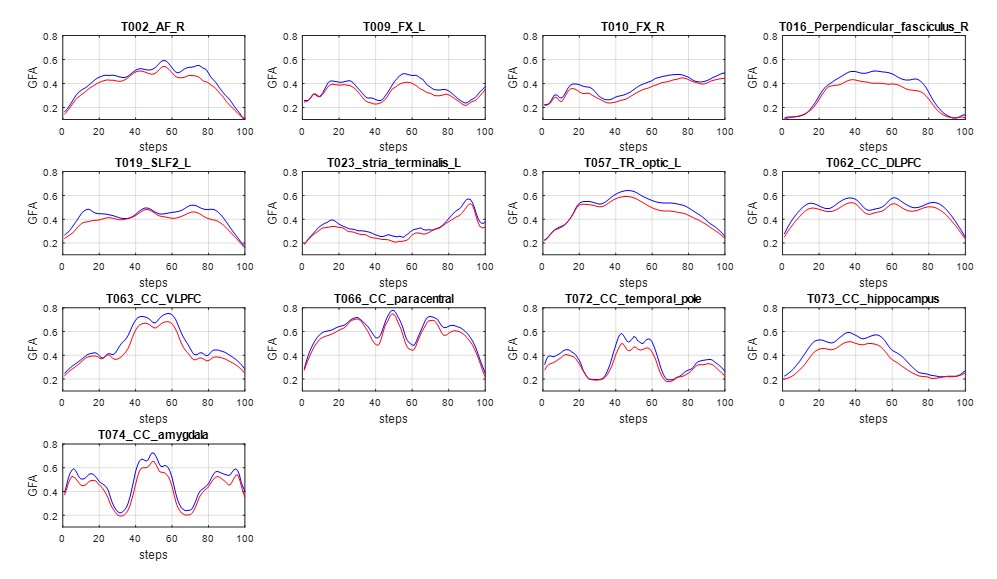
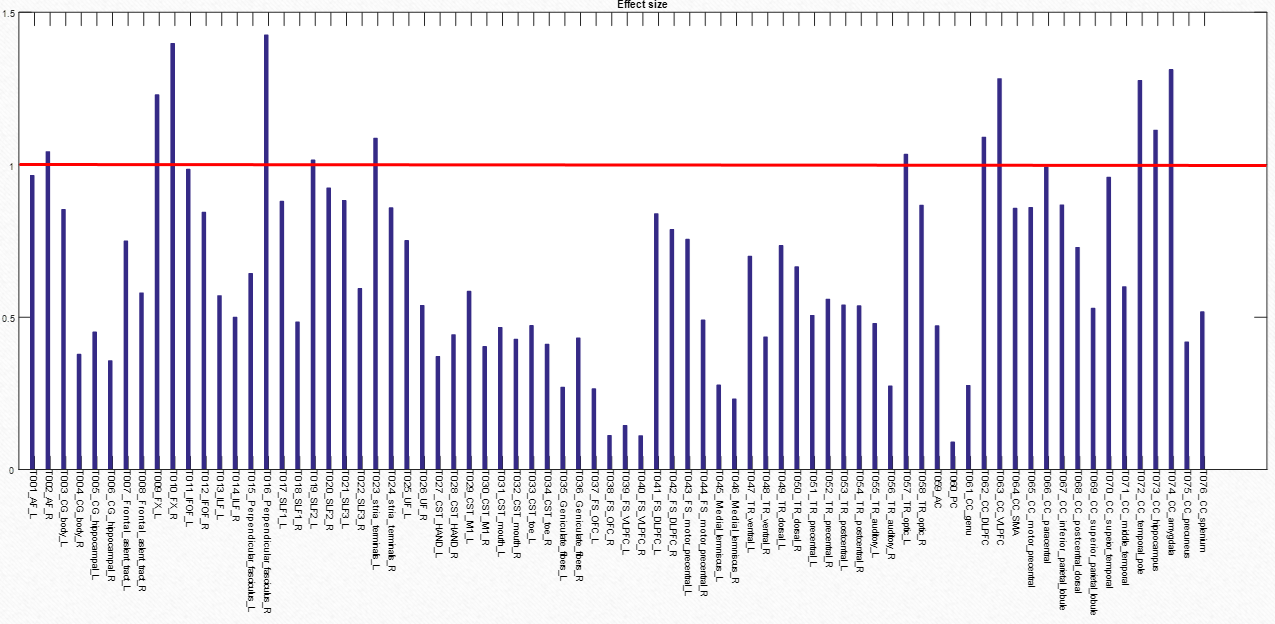
As compared with healthy controls, patients with TSC showed significantly lower GFA in 13 tracts.(Figure1) These 13 tracts included the right arcute fasciculus (AF), bilateral fornices, the right perpendicular fasciculus, the left superior longitudinal fasciculus II (SLF II), the left stria terminalis, the left thalamic radiation of visual regions, the callosal fibers (CF) of the dorsal lateral prefrontal cortex, CF of the ventral lateral prefrontal cortex, CF of the paracentral cortex, CF of the temporal pole, CF of the hippocampus, and CF of the amygdala with the effect size of 1.043, 1.230, 1.398, 1.426, 1.015, 1.087, 1.034, 1.091, 1.282, 0.992, 1.276, 1.114 and 1.312, respectively. (Figure2) (Figure3)Discussion:
This is the first study to use tract specific analysis to systematically investigate the microstructural alterations of white matter tracts in TSC. Since TSC patients show less integrity of myelination, which would probably result in generally decreased GFA values of the white matter tracts. Comparing to controls, 13 tracts were found to have significant differences. Lewis et al.9 used stochastic tractography and found that TSC patients had lower FA than controls in AF. We confirm their findings by showing significant difference in AF. Patient with TSC would have a high risk of epilepsy and ASD. In previous studies, patients with epilepsy had lower FA in fornix10, and patients with autism had lower FA in AF, SLF II and CF of prefrontal cortex.11 These altered tracts were found in the present study. It has been suggested that memory and emotion impairments may involve anatomical abnormalities in the amygdala and hippocampus.12 This might be related to the reduced GFA values in CF of the amygdala and CF of the hippocampus. In conclusion, altered microstructural integrity of the white matter tracts in TSC supports the hypothesis of underlying microstructural changes in the brains of TSC.Acknowledgements
No acknowledgement found.References
1. O'Callaghan, Finbar JK. "Tuberous sclerosis." BMJ 318.7190 (1999): 1019-1020.
2. Curatolo, Paolo, and Roberta Bombardieri. "Tuberous sclerosis." Handbook of clinical neurology 87 (2007): 129-151.
3. Meikle, Lynsey, et al. "A mouse model of tuberous sclerosis: neuronal loss of Tsc1 causes dysplastic and ectopic neurons, reduced myelination, seizure activity, and limited survival." The Journal of neuroscience 27.21 (2007): 5546-5558.
4. Wong, A. M., et al. "Cerebral diffusion tensor MR tractography in tuberous sclerosis complex: correlation with neurologic severity and tract-based spatial statistical analysis." American Journal of Neuroradiology 34.9 (2013): 1829-1835.
5. Reese, T. G., et al. "Reduction of eddy-current-induced distortion in diffusion MRI using a twice-refocused spin echo." Magnetic Resonance in Medicine 49.1 (2003): 177-182.
6. Kuo, Li-Wei, et al. "Optimization of diffusion spectrum imaging and q-ball imaging on clinical MRI system." Neuroimage 41.1 (2008): 7-18.
7. Chen, Yu-Jen, et al. "Automatic whole brain tract-based analysis using predefined tracts in a diffusion spectrum imaging template and an accurate registration strategy." Human brain mapping 36.9 (2015): 3441-3458.
8. Cohen, Jacob. "Statistical power analysis for the behavioural sciences. Hillside." NJ: Lawrence Earlbaum Associates (1988).
9. Lewis, William W., et al. "Impaired language pathways in tuberous sclerosis complex patients with autism spectrum disorders." Cerebral cortex 23.7 (2013): 1526-1532.
10. Concha, Luis, Christian Beaulieu, and Donald W. Gross. "Bilateral limbic diffusion abnormalities in unilateral temporal lobe epilepsy." Annals of neurology 57.2 (2005): 188-196.
11. Lo, Yu-Chun, et al. "The loss of asymmetry and reduced interhemispheric connectivity in adolescents with autism: a study using diffusion spectrum imaging tractography." Psychiatry Research: Neuroimaging 192.1 (2011): 60-66.
12. Baron-Cohen, Simon, et al. "The amygdala theory of autism." Neuroscience & Biobehavioral Reviews 24.3 (2000): 355-364.
Figures