2417
Magnetic flux density comparisons between in-vivo TACS human Magnetic Resonance Electrical Impedance Tomography measurements and MRI-derived human computational models1Arizona State University, Tempe, AZ, United States, 2University of Florida
Synopsis
actual current densities applied to the brain in neuromodulation therapies. MREIT can be used to determine actual current densities delivered to the brain by measuring Bz. Here we present Bz distributions resulting from trans-temporal current injection obtained from MREIT imaging during 10 Hz TACS in a healthy human subject. Comparisons of MREIT results to MRI-derived computational models suggested that actual contact areas between electrodes and scalp may be smaller than electrode surface areas, and in-vivo tissue conductivity values, particularly skin and skull, may be different than assumed.
Purpose
Effects of changing electrode-scalp contact areas and tissue conductivity values in TACS finite element models were compared with in-vivo human MREIT results to determine which parameters produced the best qualitative agreement in magnetic flux density data. While MREIT can be used to reconstruct conductivity distributions as well as current density patterns, MREIT phase data quality in skin and bone is low because of low signal and the narrow structure of these compartments. If saline soaked sponges are used to make electrical contact with the scalp it is difficult to determine contact quality a priori, and there is some evidence that only portions of the electrode held down with fastening straps may conduct current [1].Methods
Imaging was performed using the 3T Achieva Phillips MRI system at the McKnight Brain Institute, University of Florida. A pair of MR safe TACS electrodes (25 cm2 carbon rubber inside saline soaked sponges) was placed in a trans-temporal (T7-T8) configuration over the subject’s scalp and hair. Structural (T1) data were acquired as 160 sagittal slices, with 1 mm thickness per slice. Each slice had 256 x 256 pixels and a resolution of 0.9375x0.9375mm. T1 data was used to construct computational models of the subject. Subsequently, 1.5 mA amplitude current pulses at approximately 10 Hz were passed between the electrodes during Magnetic Resonance Electrical Impedance Tomography (MREIT) acquisitions. The MREIT dataset was acquired using a modified Philips mFFE-ssfp sequence (224 x 224, pixel size 1mm2) in a total of three axial slices (5 mm thickness). Phase images from MREIT acquisitions were then processed and rescaled to Bz [2]. The T1 data were segmented into ten tissue types and two electrodes for simulations and assigned literature referenced tissue conductivities3. Simulated current densities were converted into Bz using an FFT implementation of the Biot-Savart law, and resampled to the experimental resolution for comparisons. Electrode areas, bone and skin conductivity values in the models were then modified separately, and in combination to determine if large differences between synthetic and experimental Bz measurements may be caused by overestimation of electrode area, underestimation of bone conductivity or overestimation of skin conductivity or all three. Electrode contact areas were simulated to be their full original apparent size or reduced to a quarter of their original size. Bone tissue conductivity was chosen to be 0.0109 S/m or 0.1 S/m. Skin tissue conductivity was simulated to be either 0.43 S/m or 0.01 S/m as reported by Parazzini et al. [4]Results
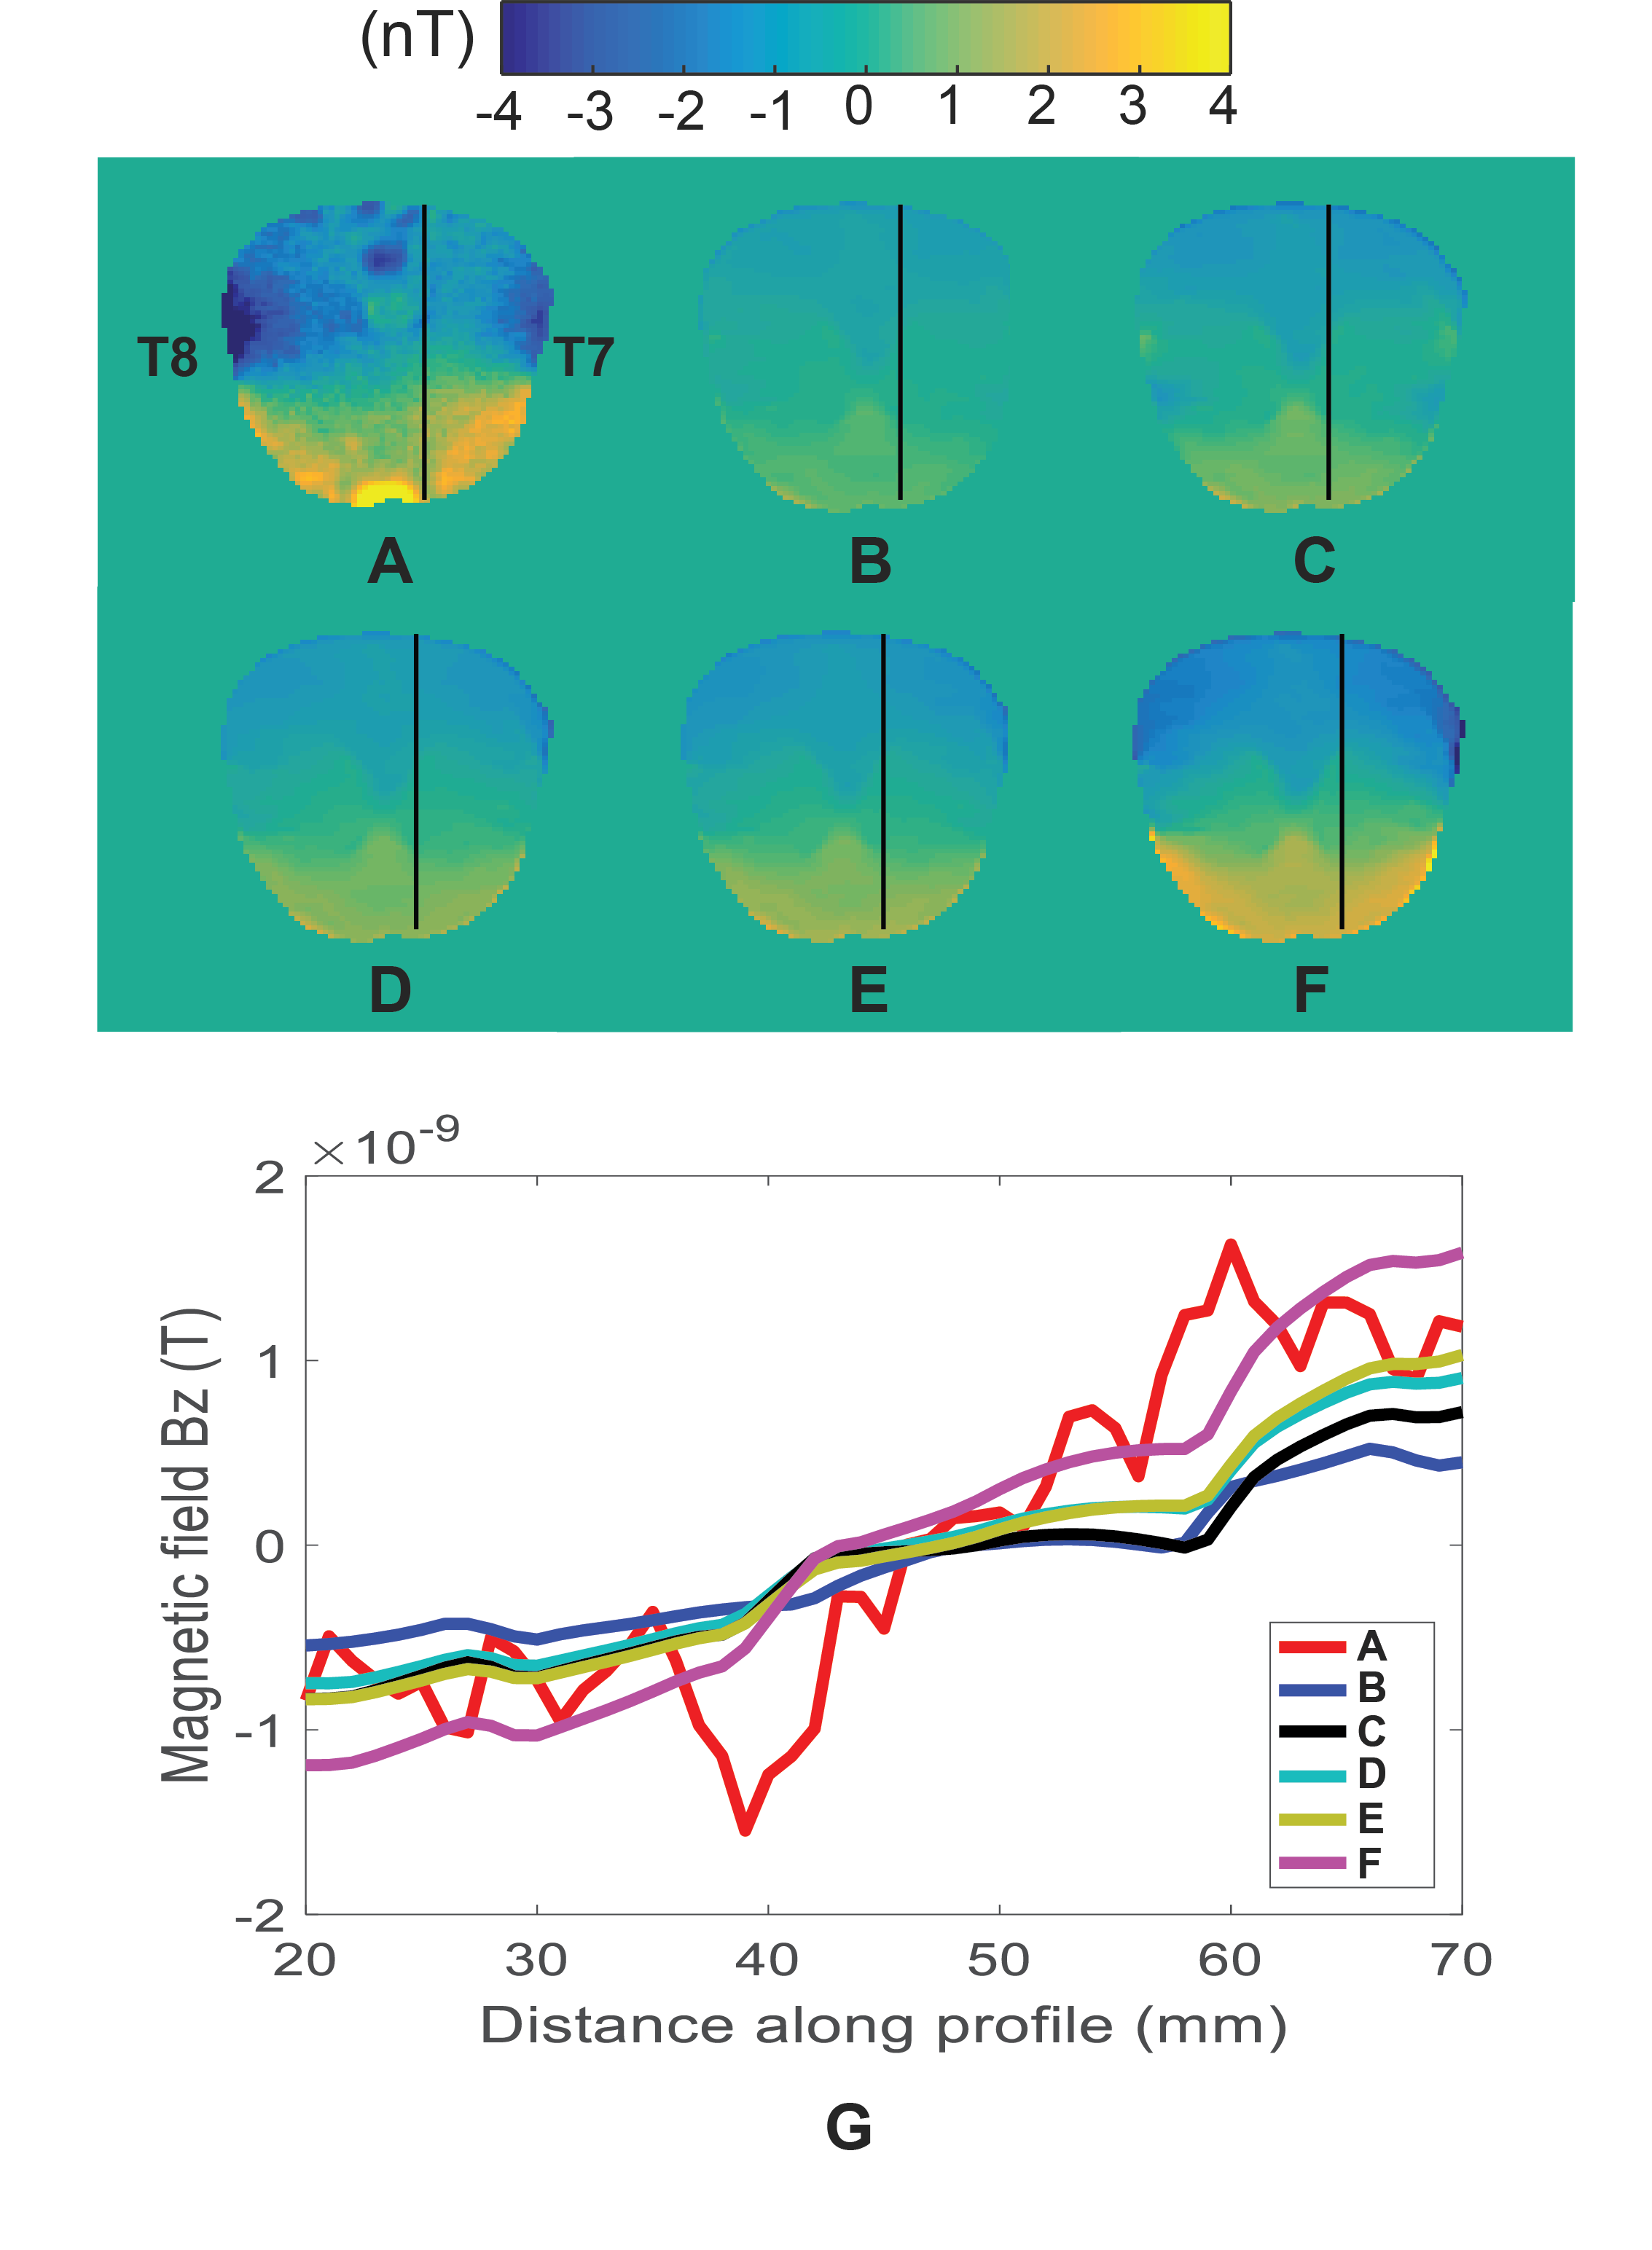
Figure 1 shows brain-masked MREIT Bz and predicted Bz distributions in the MREIT central axial slice for a T7-T8 electrode montage, and line profile plots. All Bz patterns were in agreement with the Biot-Savart law for current direction from left (T7) to right (T8) with high Bz values observed in the anterior and low Bz values observed in the posterior. Reducing electrode contact area by four as shown in Figure 1C did not increase synthetic Bz values, but caused slight change in Bz profiles nearby the electrodes. Increasing bone and decreasing skin conductivity values individually, as shown in Figures 1D and 1E, respectively, did not produce clear changes in Bz patterns, but increased Bz range, as shown in Figure 1G. The closest agreement between MREIT and synthetic Bz were observed when incorporating changes in electrode model, bone and skin conductivity into simulations altogether as shown in Figure 1F-G.Discussion
Smaller electrode contact areas should cause larger current densities to enter the head, but this modification alone did not increase Bz range inside the brain. This may indicate that the current density was mainly shunted by the high conductivity skin tissue. Decreasing skin and increasing bone conductivity values individually altered the Bz range as expected, allowing more current to enter the brain. The combination of decreased electrode contact area, high bone and low skin conductivity parameters produced synthetic Bz maps that best matched the scale of experimental Bz distributions. While not conclusive, these findings indicated that our previous computational parameters used in Bz simulations of TACS may be inaccurate. Thus, our study could contribute to improvements of TACS finite element modeling. Our method can also be used to reconstruct conductivity distributions, though reconstructions in skin and bone are likely to be poor. Further processing of these data may yield useful findings of interest to workers involved in validation of computational models of transcranial electrical stimulation or in inverse source imaging applications.Acknowledgements
Research reported in this
publication was supported by the National Institute Of Neurological Disorders
And Stroke of the National Institutes of Health under Award Number R21NS081646
to RJS.
In addition, a portion of this work was performed in
the Advanced MRI/S (AMRIS) Facility at the McKnight Brain Institute of the
University of Florida, which is part of the National High Magnetic Field
Laboratory (supported by National Science Foundation Cooperative Agreement
DMR-1157490, the State of Florida, and the U.S. Department of Energy).
References
[1] Woods, A.J., et al., "A technical guide to tDCS, and related non-invasive brain stimulation tools." Clinical Neurophysiology vol. 127, pp. 1031–1048, 2016.
[2] E. J. Woo and J. K. Seo, "Magnetic resonance electrical impedance tomography (MREIT) for high-resolution conductivity imaging," Physiological measurement, vol. 29, no. 10, pp. 1-26, 2008.
[3] A. Indahlastari, et al., “Changing head model extents affects finite element predictions of transcranial direct current stimulation distributions.” Journal of Neural Engineering vol 13 no. 6, pp. 066006, 2016.
[4] M. Parazzini, et al., "Transcranial direct current stimulation: Estimation of the electric field and of the current density in an anatomical human head model," IEEE Trans Biomed Eng, vol. 58, pp. 1773-1780, 2011.
Figures