2416
Magnetic Resonance Neurography (MRN) in the abdomen: the feasibility of imaging the celiac plexus with motion-compensated 3D SHINKEI1UMC Utrecht, Utrecht, Netherlands, 2Philips Electronics Japan, Tokyo, Japan
Synopsis
Recently, the 3D-SHINKEI (3D nerve-SHeath signal increased with INKed rest-tissue RARE Imaging) sequence was introduced for peripheral MR neurography. This method uses an improved Motion Sensitized Driven Equilibrium (iMSDE) prepulse to suppress muscle and slow flow signal, for improved visualization of peripheral nerves. Applying this method in the abdomen would provide the potential to image the celiac plexus, which is involved in various pain mechanisms, e.g. due to pancreatic cancer and other upper gastrointestinal malignancies. In this work, we show the feasibility of MRN of the celiac plexus in volunteers by using cardiac and respiratory motion-compensated 3D SHINKEI.
Purpose
Magnetic Resonance Neurography (MRN) methods allow visualization of peripheral nerves based on the relatively long T2 of the fluid in the endoneurium, using fat-suppressed T2-weighted pulse sequences, sometimes with diffusion weighting to benefit from the restricted neural diffusion1.Recently, the 3D-SHINKEI (3D nerve-SHeath signal increased with INKed rest-tissue RARE Imaging) sequence was introduced, which uses an improved Motion Sensitized Driven Equilibrium (iMSDE)2 prepulse to suppress muscle and slow flow signal. With 3D-SHINKEI, visualization of the brachial and lumbosacral plexus has been successfully demonstrated3. MRN methods in the abdomen would have the potential to image the celiac plexus which is involved in various pain mechanisms and a target for image-guided interventions aimed at pain palliation4. However, motion renders MRN in this anatomical region challenging. Here, we investigate if adding motion compensation to 3D SHINKEI allows visualization of the celiac plexus in healthy volunteers at 1.5 and 3T.Methods
Image Acquisition: Experiments were performed on clinical 1.5T and 3T MRI scanners (Ingenia, Philips Healthcare, The Netherlands). Five volunteers were scanned in the supine position at 3T, with the following protocol: Breathold mDixon FFE, 3D T2W fatSat TSE. For 3D SHINKEI different motion compensation strategies were applied:
1) no compensation
2) respiratory triggered
3) respiratory and cardiac triggered
4) respiratory and cardiac triggered with saturation bands (covering organs with peristaltic and respiratory motion)
Based on image quality, a motion compensation strategy was selected for volunteer scanning to evaluate the consistency of anatomy on 3D SHINKEI at 1.5 and 3T. 3D SHINKEI was performed with Spectral Presaturation with Inversion Recovery (SPIR). Imaging parameters at 3T were as proposed in3: target TR=2400ms (varying with breathing pattern), equivalent TE=61, Echo train length=80, Echo spacing=4.0ms, iMSDE velocity-encoding=1cm/s, iMSDE preparation duration iMSDE-prep: 50ms, acquired voxel-size= 1x1x2mm3, scan duration=5:47min. At 1.5T the same parameter settings were applied, except, acquired voxel size: 1.25x1.25x2.5mm3 and equivalent TE=51ms.
Results
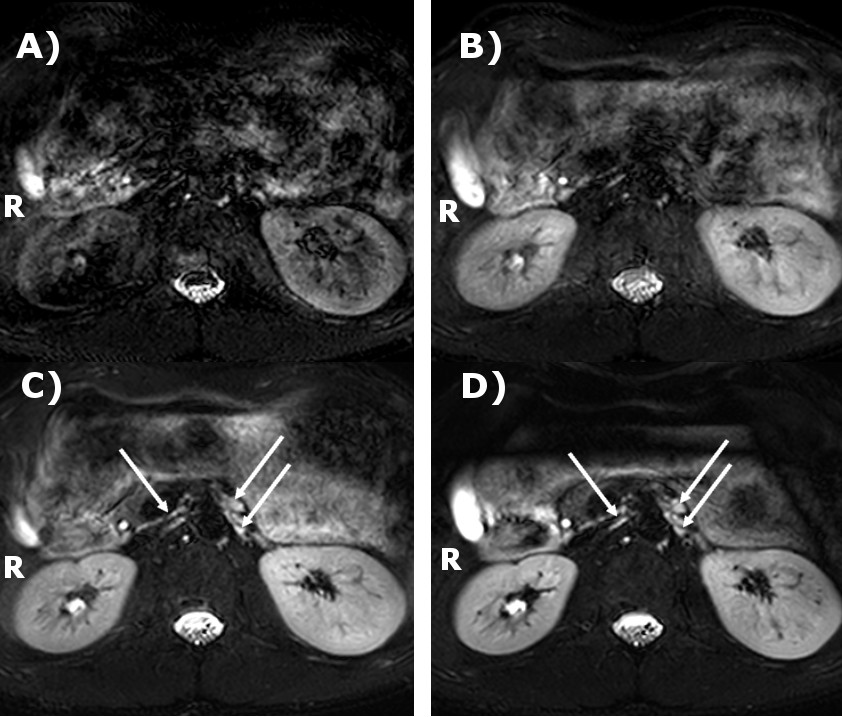
The celiac plexus consists of the left and right celiac ganglion, laying in the retroperitoneal area close to the aorta between the origin of the celiac artery and superior mesenteric artery (SMA) behind the pancreas5,6.There, hyperintense structures can be identified on the SHINKEI images, but only with double triggering (arrows in Fig.1C&D). These structures were located near the SMA, consistent with the known location of the celiac ganglia. The other structures in the retroperitoneal area, kidneys, aorta, vena cava and the spine were poorly defined without motion compensation (Fig 1A), or with respiratory triggering only (Fig 1B). Blurring and intensity variations are seen in the larger structures, and a noise-like texture further complicated identifying the structures. With both respiratory and cardiac triggering (Fig.1C&D), edge definition improved considerably, and the contours of the vena cava and aorta could be seen. The noise-like texture is reduced, especially with the use of saturation bands over the bowels. Hence, the respiratory and cardiac-gated sequence with saturation bands was selected for volunteer scanning.
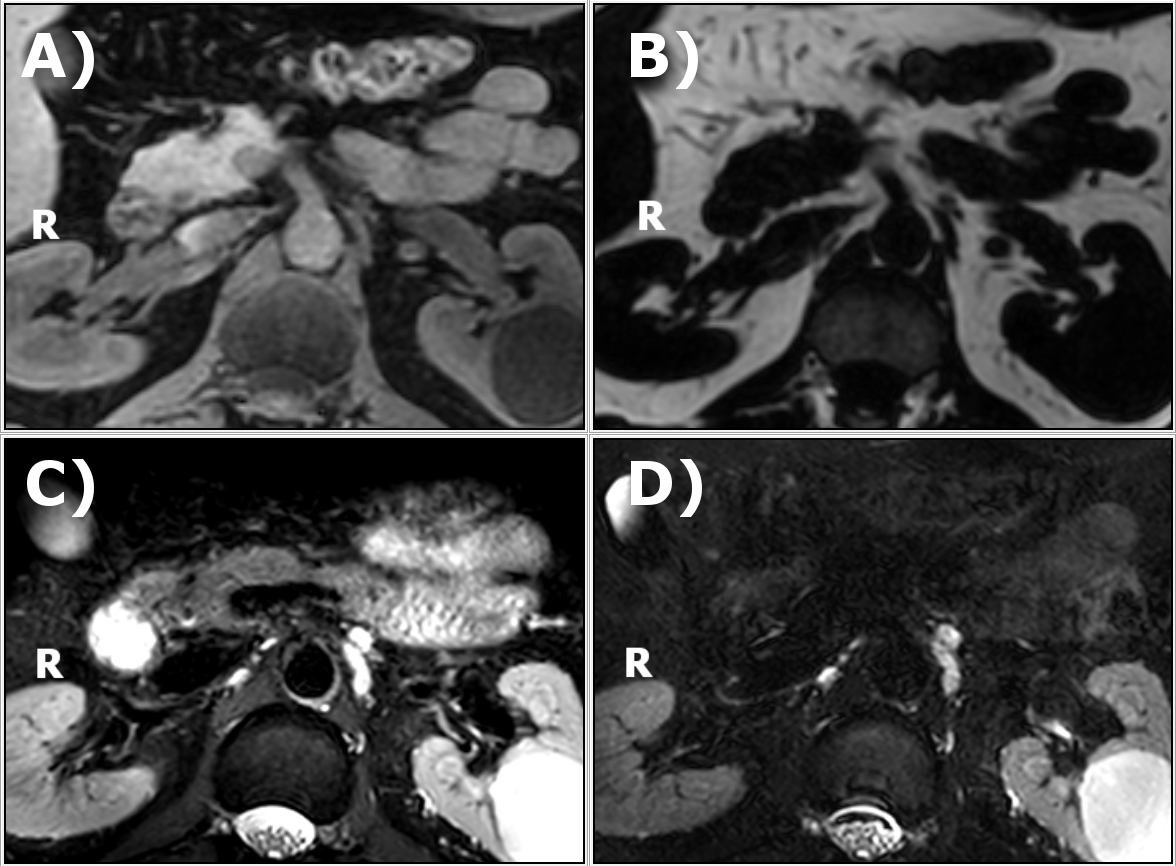
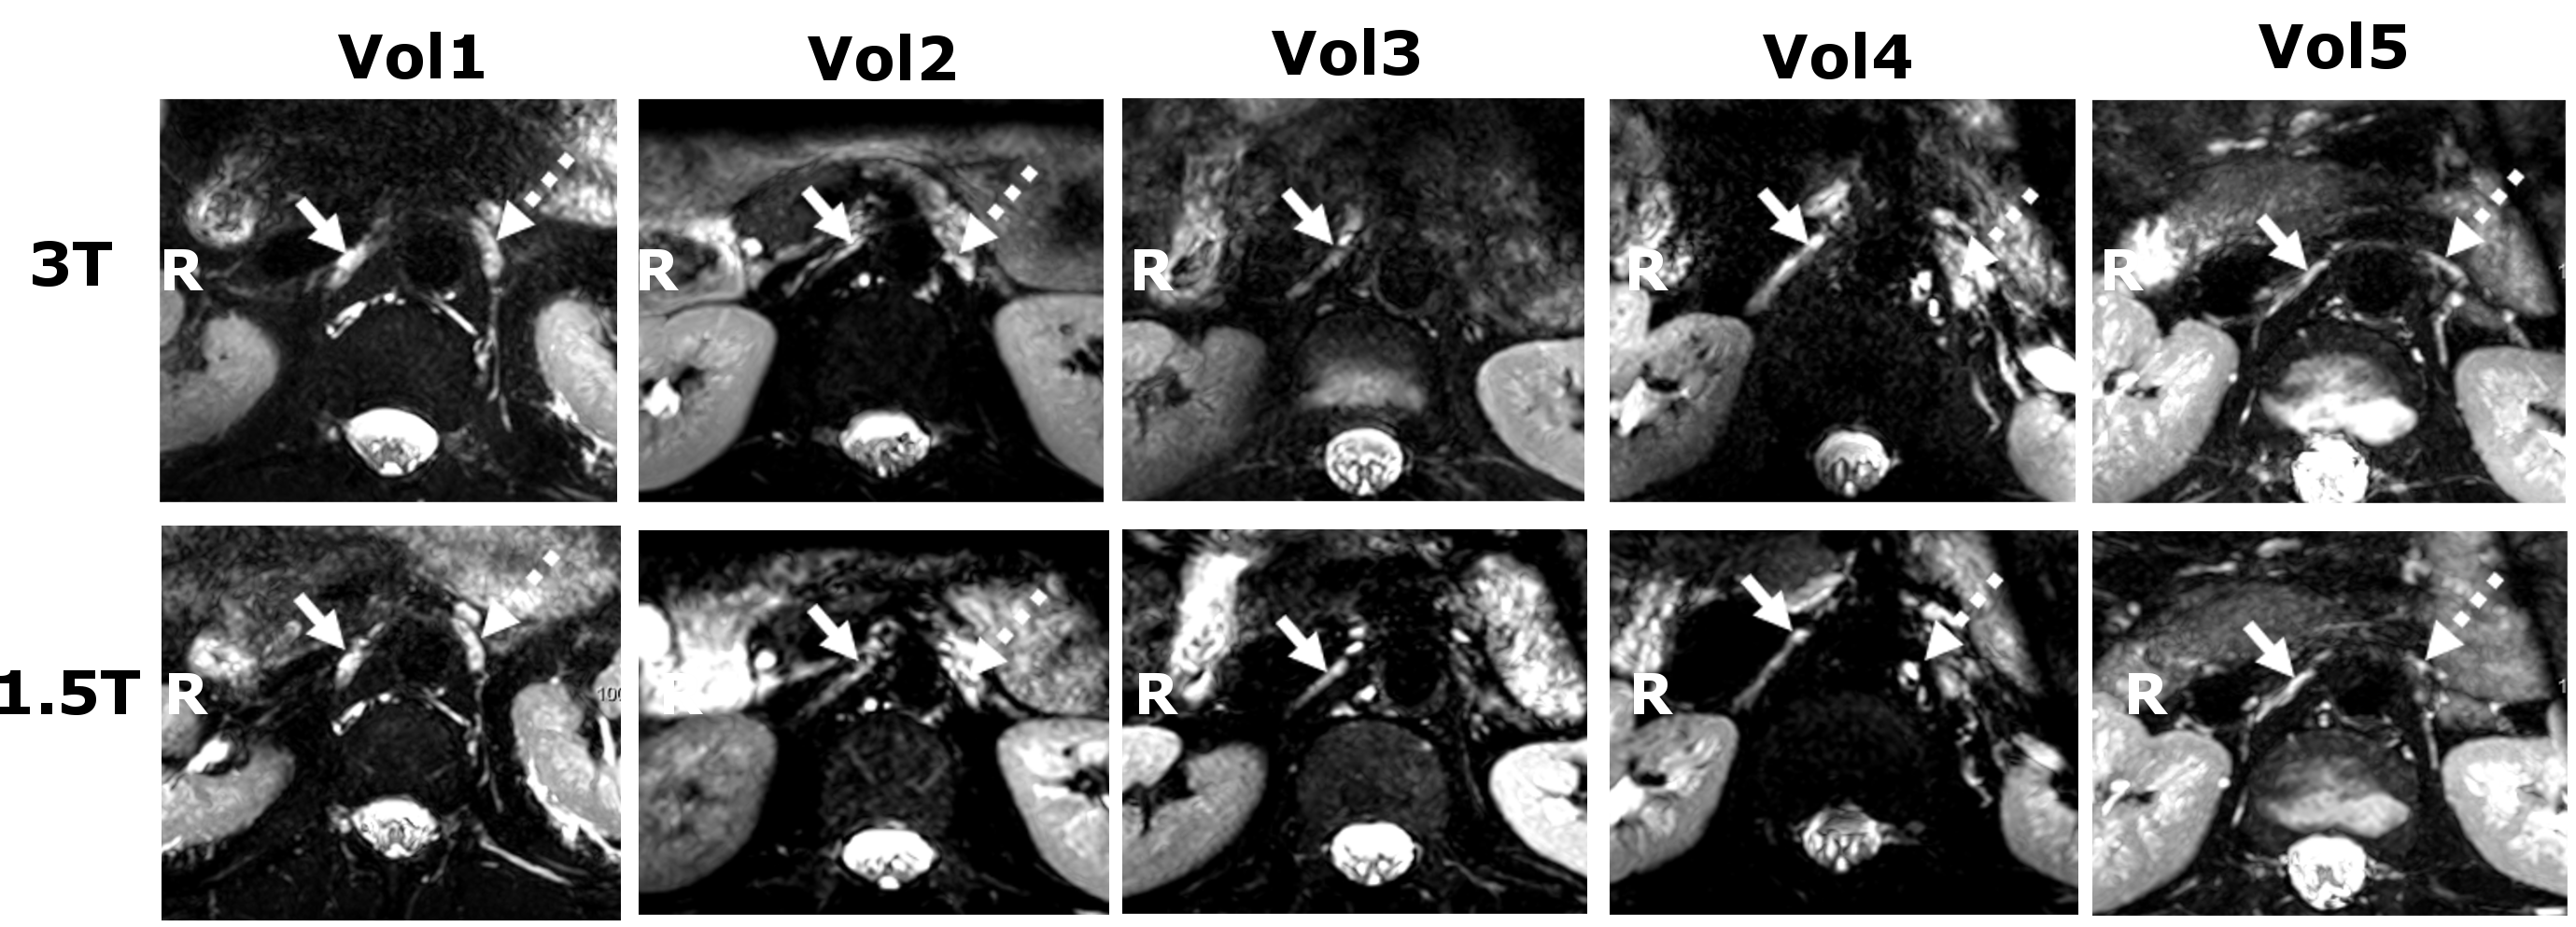
The SMA is easily identified on the water image of the mDixon (Fig 2). On both sides, adjacent to the SMA, small isointense structures are seen in locations consistent with the location of the celiac ganglia, corresponding to hypointense areas in the fat image. At the same locations on the T2W fat-suppressed TSE, and the 3D SHINKEI, hyperintense structures are seen. Three structures close to the aorta, two on the left side and one on the right side can clearly be identified. The 3D SHINKEI showed improved contrast between celiac plexus and pancreas, muscle and fluid inside the stomach as compared to the T2W FatSat TSE. The images of the celiac plexus and surrounding structures obtained at 1.5T and 3T in 5 volunteers demonstrated that the selected motion compensated scheme was effective (Fig 3). In all volunteers, Laminar or nodular hyperintense structures on the right of the aorta could be identified (solid arrows). In 4 volunteers, a nodular hyperintense structure on the left side of the aorta was seen (dashed arrows).
Discussion/Conclusion
We showed the feasibility of MRN of the celiac plexus in volunteers by using 3D SHINKEI with combined respiratory and cardiac triggering. Future work should include evaluation of the robustness of the methods and contrast with surrounding tissue in a clinical setting, for instance when invasion of the plexus is suspected or before and during follow up of palliative treatment. The presented approach may also be applicable to other nerve structures in the abdomen.Acknowledgements
No acknowledgement found.References
1. Carpenter EL, Bencardino JT. Focus on Advanced Magnetic Resonance Techniques in Clinical Practice : Magnetic Resonance Neurography. Radiol Clin North Am. 2015 May;53(3):513-29
2. Yoneyama M, Nakamura M, et al. High-Resolution 3D Volumetric Nerve-Sheath Weighted RARE Imaging (3D SHINKEI). ISMRM 2011
3. Yoneyama M, Takahara T, et al. Rapid High Resolution MR Neurography with a diffusion-weighted Pre-pulse. Magn Reson Med Sci. 2013;12(2):111-9
4. Kambadakone A, Thabet A, et al. CT-guided celiac plexus neurolysis: a review of anatomy, indications, technique, and tips for successfultreatment. Radiographics. 2011 Oct;31(6):1599-621
5. Loukas M, Klaassen Z, et al. A review of the thoracic splanchnic nerves and celiac ganglia. Clin Anat. 2010 Jul;23(5):512-22
6. Zhang XM, Zhao QH, et al. The celiac ganglia: anatomic study using MRI in cadavers. AJR Am J Roentgenol. 2006 Jun;186(6):1520-3.
Figures