2414
Head-to-head comparison of ferumoxytol and gadolinium-enhanced intracranial MRA at 7T vs. non-contrast TOF1Neurology/AIRC, OHSU, Portland, OR, United States, 2Radiology/AIRC, OHSU, 3Siemens Medical, 4Neurology, OHSU, 5AIRC, OHSU, 6Neurology/Neurosurgery, OHSU
Synopsis
7T imaging of neurovasculature with TOF affords sub-millimeter resolution and can make it possible to visualize extremely small vessels such as the lenticulostriate arteries; however, TOF can be hampered by flow and pulsation artifacts. K-space reordering and the administration of a contrast agent can greatly reduce these artifacts while still allowing for small vessel conspicuity. We acquired gadolinium and ferumoxytol-based MRA alongside TOF in three patients and two radiologists rated vessel conspicuity and artifact. Artifacts were diminished with contrast, though there were no differences in artifact due to k-space reordering, and vessel conspicuity was high in all acquisitions.
Purpose
Recent reports have investigated the use of time-of-flight (TOF) magnetic resonance angiography (MRA) at 7 Tesla and found that the resolution afforded by ultra high field imaging relative to 1.5 or 3T increased conspicuity of small branching vessels while having little to no effect on SNR in large vessels1. T1 weighting in vasculature on an MPRAGE sequence was compared between non-contrast and contrast-enhanced protocols at 7T and found improved assessment of small peripheral segments with contrast2. However, intracranial contrast-enhanced (CE) MRA has yet to be reported when compared to TOF at 7T.Methods
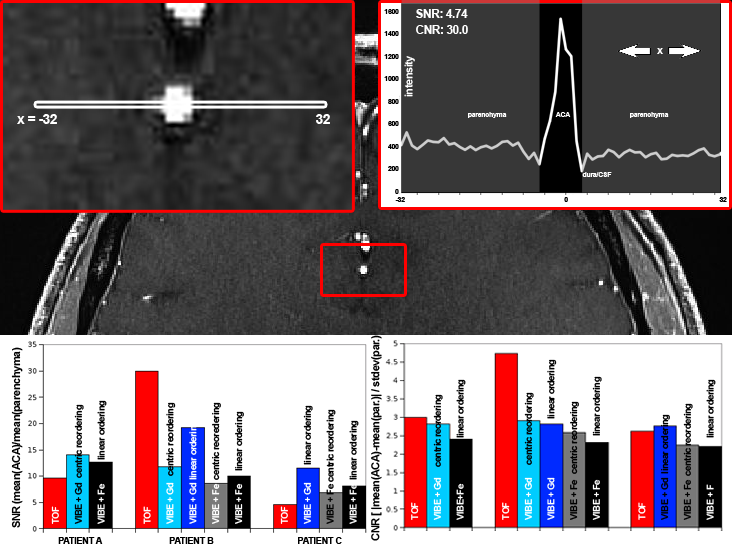
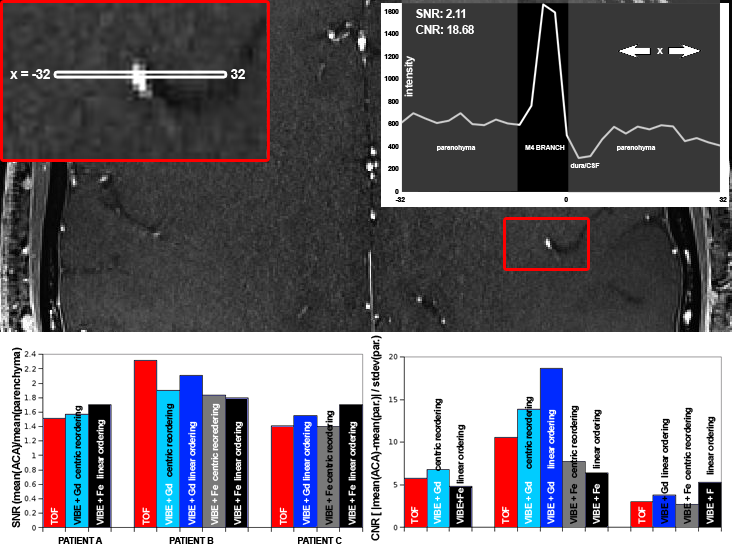
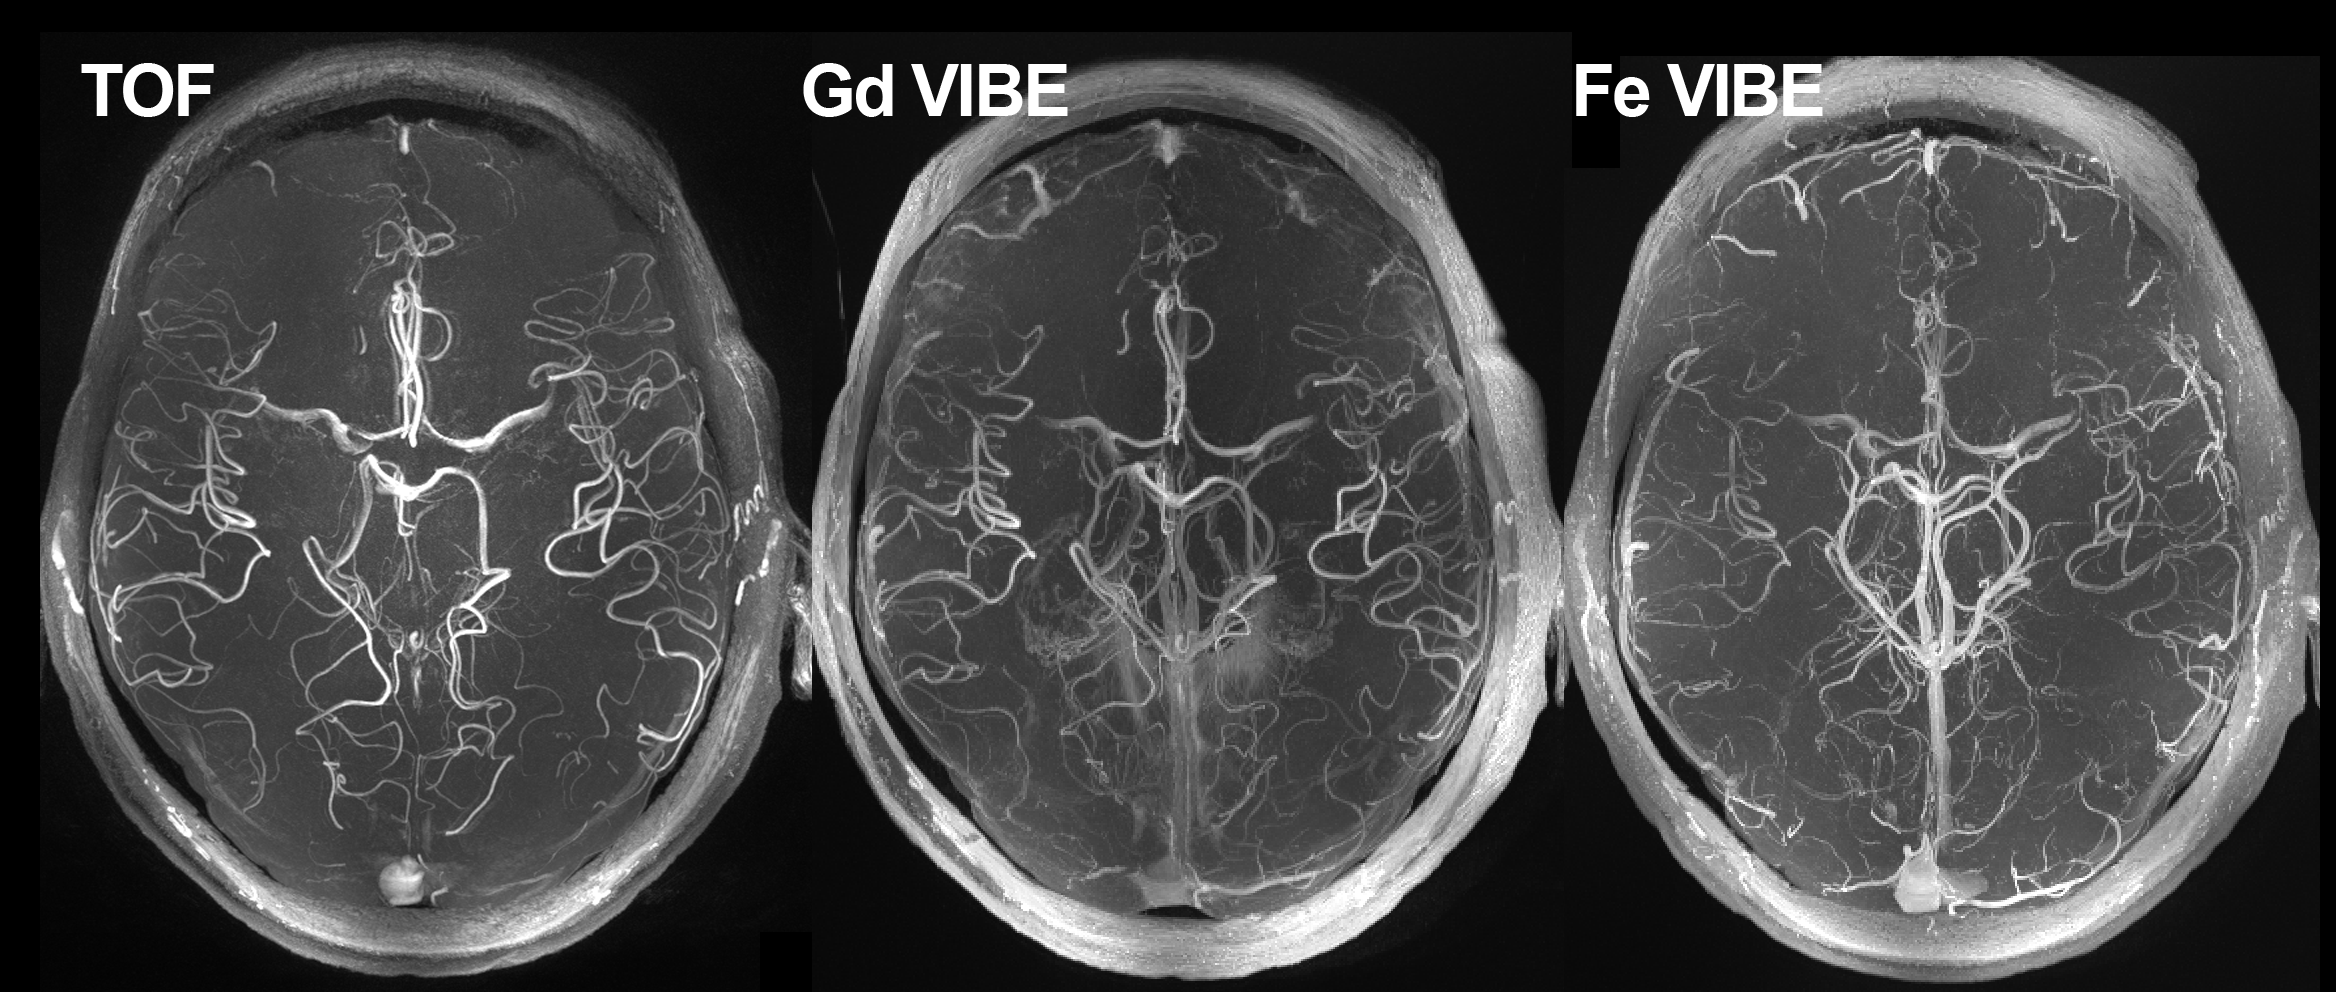
3 patients were entered into an OHSU IRB-approved 3 day protocol and scanned on a MAGNETOM 7T (Siemens) with a quadrature transmit 24-channel recieve head coil (Nova Medical). The first day contained TOF (TR/TE/FA=15ms/5.58ms/20°, 5 slabs of 50 0.4mm slices, FOV=160x200mm, matrix=618x768, 0.35x0.26x0.69mm3 voxels), and CE-MRA (TR/TE/FA=7.09/2.3/12°, 208 0.4mm slices, FOV=165x200mm, matrix=416x512, (0.4mm)3 voxels) immediately after 0.2mmol/kg gadoteridol (Gd) administration. CE-MRA with 4mg/kg ferumoxytol (Fe) was performed on a second day. CE-MRA was acquired with linear k-space ordering and with 3D centric reordering for assessment of pulsation and ghosting artifacts. CNR and SNR measurements were taken in the axial plane through the ACA spanning two hemispheres and through a cortical M4 segment (Figure 1) for all sequences; two blinded radiologists rated for a) visualization of dural venous sinus (DVS), b) visualization of M1/A1 segment (M1A1), c) visualization of M4/subcortical arteries (M4), d) visualization of lenticulostriate vessels (LSV), and e) for the presence of flow and pulsation artifacts (FPA) in the phase encoding axis in the axial plane at the ACA. Ratings for visualization were 1 – 5: visualization without question, visualized but artifact impacts evaluation, visualized with less than 90% certainty, visualized less than 50% certainty, and not visualized, respectively. Artifacts were rated 1-5: no artifact, artifact present but does not affect vessel conspicuity, artifact present with minor effect on vessel conspicuity, artifact present with major effect on conspicuity, and artifact renders vessel unreadable. Maximum intensity projections were calculated through the slice direction between the circle of Willis and the top of the lateral ventricles for qualitative comparison (Figure 3).Results
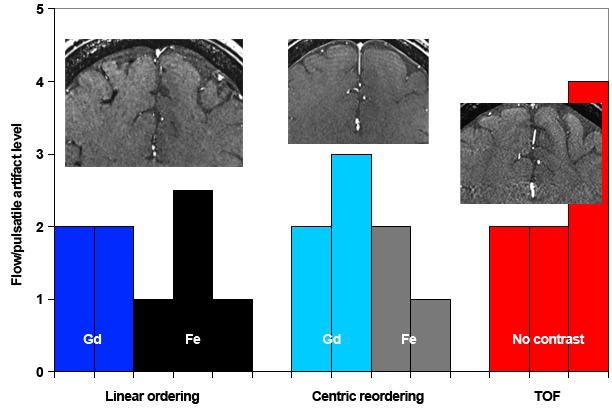
There was no significant difference in SNR or CNR between any of the scan types in the ACA (Figure 1) or in a cortical M4 segment (Figure 2), though SNR and CNR varied widely across patients. Raters were in modest agreement for LSV and M4 (r = 0.28 and 0.20, respectively), good agreement on DVS (r = 0.62) and excellent agreement on M1A1 (r = 0.95) and artifacts (r = 0.95). Ratings for visualization (Figure 3) of small vessels (LSV and M4) were best with TOF (1.8 and 2.2) and Gd (2.0 and 1.9), though vessels were visualized with Fe (3.3 and 3.0). M1A1 was rated most highly in Gd (1.5) and TOF (1.8), with Fe (2.8) also providing good visualization. Finally, DVS was rated highest for Fe (1.5), with Gd (2.6) and TOF (2.0) providing excellent visualization. Flow and pulsatile artifacts were largest in TOF (2.7) and had a minor effect on conspicuity; artifacts were the same with linear ordering and 3D centric reordering (1.7 and 2.0) and did not affect vessel conspicuity (Figure 3).Discussion
This small pilot project investigated the effect of contrast agent on MRA and the amelioration of artifacts produced by flow and pulsatile movement by using a centric k-space reordering method. All methods yielded excellent visualization of small and large vessels, though artifacts hampered visualization of some vessels in TOF. Bright blood visualization of lenticulostriate vessels is extremely difficult at 3T. (3) averaged 3.3 in 100 patients, and 5 or more were visualized in each patient for each sequence performed in this study, demonstrating superior performance for MRA at 7T. Variability between patients for the same acquisition was much larger than variability within a patient for different acquisitions, making it difficult to make recommendations for targeted 7T imaging with or without contrast. However, the near elimination of flow and pulsatile artifact with the administration of contrast, with or without k-space reordering, suggests that contrast enhanced acquisitions may be recommended when evaluating relatively small pathology in large vessels. Lastly, Fe-based contrast-enhanced images were qualitatively better in smaller vessels, though that finding was not supported by the ratings. 4mg/kg is a small dose of ferumoxytol, and enhancement might be augmented by administration of 510mg.Conclusion
All acquisitions were able to better visualize small vessels at 7T than previously published 3T data. Contrast administration limited flow and pulsatile artifacts, though 3D-centric k-space reordering had no effect.Acknowledgements
No acknowledgement found.References
1. Heverhagen, J. T., E. Bourekas, et al. (2008). "Time-of-flight magnetic resonance angiography at 7 Tesla." Invest Radiol 43(8): 568-573.
2. Umutlu, L., N. Theysohn, et al. (2013). "7 Tesla MPRAGE imaging of the intracranial arterial vasculature: nonenhanced versus contrast-enhanced." Acad Radiol 20(5): 628-634.
3. Akashi, T., T. Taoka, et al. (2012). "Branching pattern of lenticulostriate arteries observed by MR angiography at 3.0 T." Jpn J Radiol 30(4): 331-335.
Figures