2412
Evaluation of multispectral segmentation of gray matter based on 3D T1-, T2 and T2-weighted FLAIR images for gray matter segmentation1Diagnostic and Interventional Neuroradiology, University Hospital Tübingen, Tübingen, Germany, 2Neurology and Epileptology, University Hospital Tübingen, Tübingen, Germany
Synopsis
An ideal classification of brain tissue structures as segmented gray matter (GM) has been a challenge while using standard T1-weighted image. One of the important ways of addressing this issue would be to use additional information from multispectral imaging such as T2- and T2-weighted FLAIR images. We evaluated the effect of multispectral segmentation on GM segmentation using SPM12 VBM and compared it with T1-only segmentation. We found that T1-segmentation overestimates dura, meninges and vessels as GM. This problem was successfully addressed by multispectral segmentation, which should be used as a segmentation model for future VBM studies.
Purpose
The
purpose of this study was to validate multispectral segmentation of
gray matter, based on a combination of T1, T2 and FLAIR images and
evaluate its effect in comparison with T1-only segmentation, using
voxel based morphometry (VBM).Methods
We scanned 77 healthy controls on a 3T scanner (Skyra, Siemens, Erlangen) with a 32-channel head coil. The acquisition consisted of 3D T1-weighted MPRAGE (TI = 900 ms, α = 80, TE = 2.32 ms, TR = 2300 ms, GRAPPA = 2), 3D T2-weighted SPACE (α = 1200, TE = 4.08 ms, TR = 3200 ms, GRAPPA = 2) and 3D inversion recovery prepared SPACE with a FLAIR contrast (TI = 1800 ms, α = 1200,TE = 3. 87 ms, TR = 5000 ms, GRAPPA = 2) scans with an isotropic resolution of 0.9mm3. We used SPM12, which allows for a simultaneous inclusion of multispectral data for extracting gray matter (GM ), white matter (WM) and cerebrospinal fluid (CSF). Along with T1-only segmentation, we performed multispectral segmentation on intermodality combination models; T1+T2, T1+FLAIR, T2+FLAIR and T1+T2+FLAIR in controls. To achieve a first validation of multispectral segmentation, we assessed already known age-related volume changes in GM in healthy subjects (n=77). For this purpose, absolute GM, WM and CSF volumes were calculated using SPM12 and GM volumes were normalized to total intracranial volumes (TIV=GM+WM+CSF) of respective subjects. Later, a linear polynomial function was used for regression analysis in all models for the gray matter estimation with respect to age, and root mean square error (RMSE) was calculated. Furthermore, VBM analysis was performed on all 5 models to account for group level comparison of GM volume changes in multispectral models against T1-only model, using a two-sample t-test at p<0.05 (FWE), corrected for multiple comparisons.Results
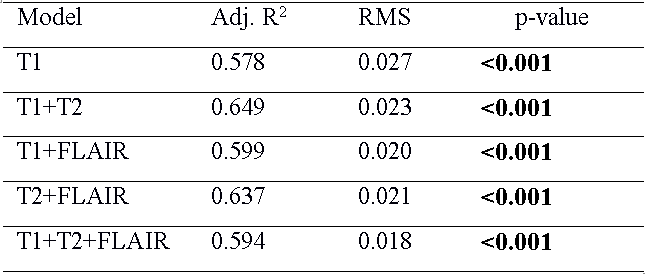
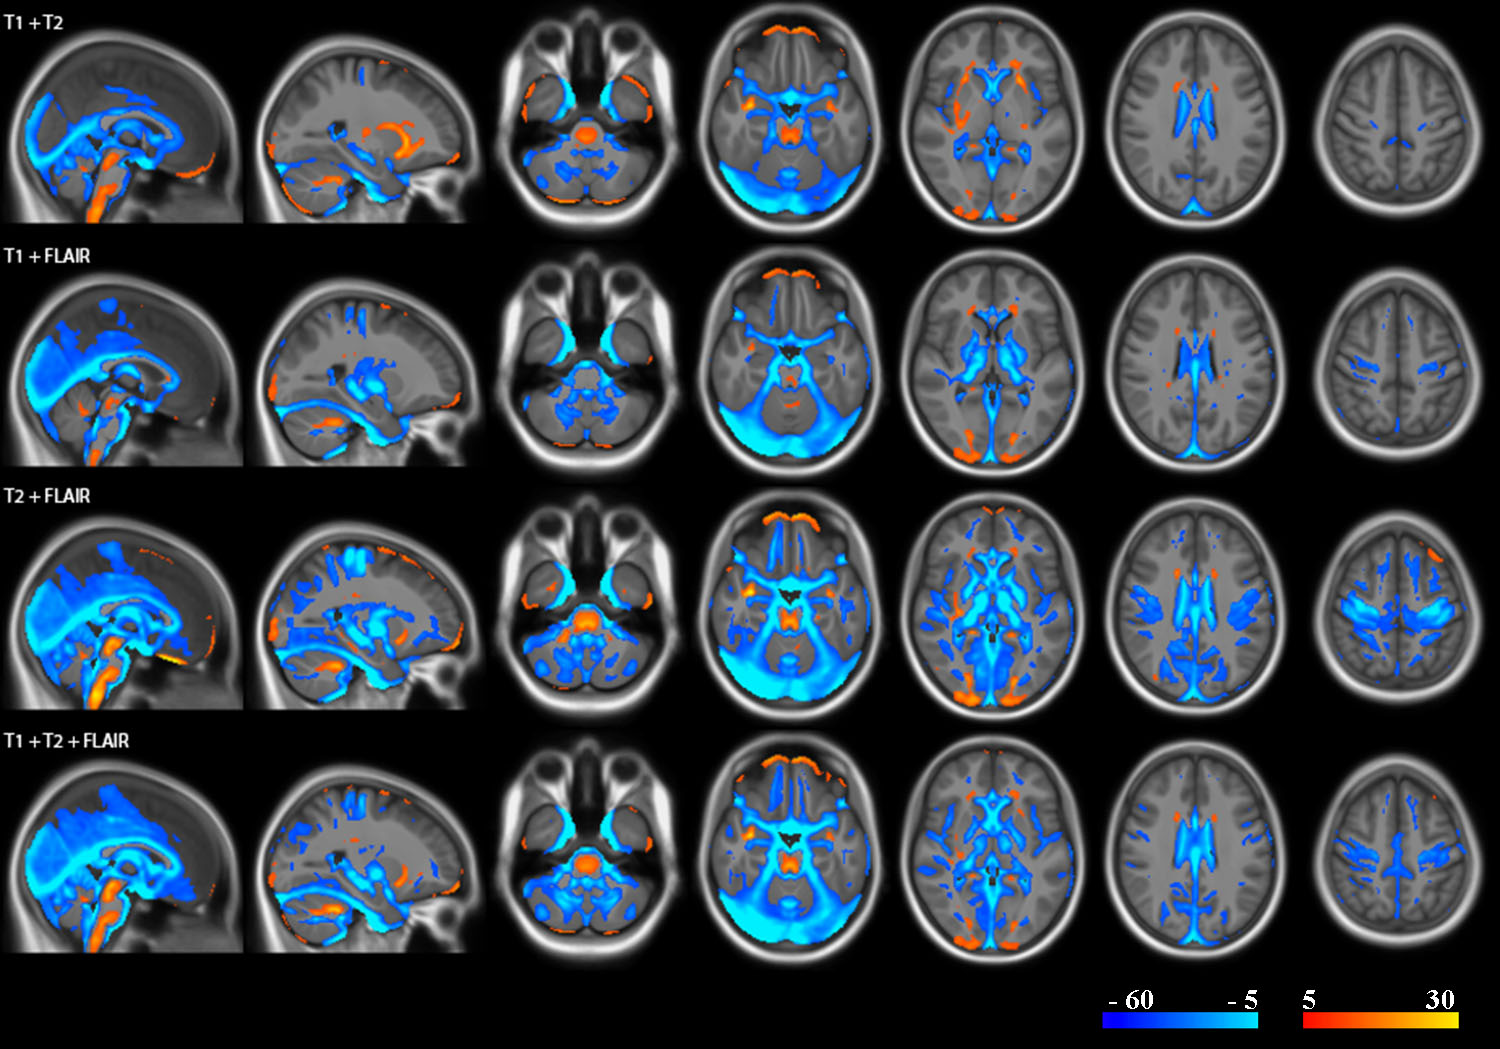
We found that all segmentation models showed a strong negative correlation between age and GM volume, when fitted to a 2nd order linear polynomial function. But among all models, T1+T2+FLAIR with an RMSE =0.018, showed the best fit to the regression function (Figure 1, Figure 2). VBM analysis for GM volume changes revealed consistently, a significant increase in GM volume, especially in dura, meninges and vessels for T1 compared to all multispectral models (Figure 3).Discussion
In comparison to adjusted R2, which is a relative measure of fit, we assessed the performance of all models for age-GM correlations using RMSE as it provides the absolute fit to the regression function. All the models showed a significant gray matter atrophy with an increasing age, which is in line with previous studies (1,2). We found that T1+T2+FLAIR showed the best age-GM correlations in comparison to rest of the models. In a detailed visual analysis of the individual cases by an expert neuroradiologist, the T1-only segmentation overestimated GM and CSF outside the brain by falsely applying the GM and CSF tissue class to vessels, meninges, and parts of the dura . These findings were in agreement with our VBM based GM volume changes pertaining to group level comparisons. These findings were also in line with previous studies which showed that dura and cortex are iso-intense in T1-weighted images (3), a problem addressed by multispectral segmentation (4).Conclusion
In summary, multispectral segmentation, especially T1+T2+FLAIR showed a better age-gray matter correlation in comparison to rest of the models. At the cortical level, we found a significant overestimation of gray matter through T1 segmentation in comparison to all multispectral segmentation models, for non brain tissues of dura, meninges as well as vessels.Acknowledgements
This study received intramural research funding by the medical faculty of the University of Tübingen (AKF 321-0-1).References
1. Ge, Y., Grossman, R. I., Babb, J. S., Rabin, M. L., Mannon, L. J., & Kolson, D. L. (2002). Age-related total gray matter and white matter changes in normal adult brain. Part I: volumetric MR imaging analysis. AJNR Am J Neuroradiol, 23(8), 1327-1333.
2.Peelle, J. E., Cusack, R., & Henson, R. N. (2012). Adjusting for global effects in voxel-based morphometry: gray matter decline in normal aging. Neuroimage, 60(2), 1503-1516. doi:10.1016/j.neuroimage.2011.12.086
3. van der Kouwe, A. J., Benner, T., Salat, D. H., & Fischl, B. (2008). Brain morphometry with multiecho MPRAGE. Neuroimage, 40(2), 559-569. doi:10.1016/j.neuroimage.2007.12.025
4. Viviani, R., Pracht, E., Brenner, D., Stingl, J., & Stöcker, T. (2016). Multimodal segmentation utilizing FLAIR or R2* images for improved detection of gray matter in VBM. Paper presented at the 22nd Annual meeting of the Organization for Human Brain Mapping, Geneva, Switzerland.
Figures