2409
AUTOMATED DETECTION OF WHITE-MATTER AND CORTICAL LESIONS IN MP2RAGE AT ULTRA-HIGH FIELD USING A SINGLE SCAN1Advanced Clinical Imaging Technology, Siemens Healthcare AG, Lausanne, Switzerland, 2Department of Radiology, Centre Hospitalier Universitaire Vaudois (CHUV) and University of Lausanne (UNIL), Lausanne, Switzerland, 3Signal Processing Laboratory (LTS 5), Ecole Polytechnique Fédérale de Lausanne (EPFL), Lausanne, Switzerland, 4Department of Radiology, Valais Hospital, Sion, Switzerland, 5Centre for Advanced Imaging, University of Queensland, Brisbane, Queensland, QC, Australia, 66. Siemens Healthcare Pty Ltd., Brisbane, Queensland, Australia, 7Siemens Medical Solutions USA, Boston, MA, United States, 8Translational Neuroradiology Section, Institute of Neurological Disorders and Stroke, National Institutes of Health (NIH), Bethesda, MD, United States, 9Medical Image Analysis Laboratory (MIAL), Centre d'Imagerie BioMédicale (CIBM), Lausanne, Switzerland, 10Martinos Center for Biomedical Imaging, Massachusetts General Hospital and Harvard Medical School, Boston, MA, United States, 11Department of Clinical Neurosciences, Centre Hospitalier Universitaire Vaudois (CHUV) and University of Lausanne (UNIL), Lausanne, Switzerland
Synopsis
Ultra-high-field Magnetic Resonance Imaging (7T MRI) has been shown to be a valuable tool to assess focal and diffuse pathology in multiple sclerosis (MS) patients, both in grey- and in white-matter. In this work, we developed and evaluated a method to automatically assess MS lesion load using magnetization-prepared two inversion-contrast rapid gradient-echo (MP2RAGE) MRI at 7T. The validation was conducted in a cohort of twenty MS patients from two research centers through a ground truth based on manual segmentations performed by a radiologist. Our single-sequence segmentation accurately detects visible white-matter and cortical lesions.
Purpose
Several studies have shown that ultra-high-field (7T) provides a detailed description of focal and diffuse pathology in multiple sclerosis (MS)1-3. The improvements in spatial-resolution, signal-to-noise ratio, contrast-to-noise ratio, as well as the minimization of partial-volume effects compared to clinical imaging protocols allow both higher detection through visual exploration and more detailed morphological characterization of the MS lesions4-6. 7T magnetization-prepared two inversion-contrast rapid gradient-echo (MP2RAGE)7,8 has shown to be sensitive to grey- and white-matter lesions in MS2,9. However, manual segmentation of MS lesions is tedious and time-consuming. Here, we develop a method to automatically detect MS lesions using 7T-MP2RAGE images.Material and Methods
Twenty MS patients were imaged on two 7T-MRI research scanners (Siemens, Erlangen, Germany) using 32-channel coils. The cohort included data from two research centers:Centre Hospitalier Universitaire Vaudois (CHUV, Switzerland), and National Institutes of Health (NIH, Bethesda,USA). The data from CHUV included 14 early relapsing-remitting-MS patients (10♀,4♂, median age 35 years, range:21-46), and the following set of parameters was used for the MP2RAGE acquisition:TR/TI1/TI2=6000/750/2350ms, voxel size(vs)=0.75x0.75x0.9mm3. The data acquired at NIH included 4 relapsing-remitting and 2 secondary-progressive-MS patients (4♀,2♂, median age 53 years, range:35-64), and the following set of parameters was used for the MP2RAGE acquisition:TR/TI1/TI2=6000/800/2700ms, vs=isotropic0.7mm3. All imaging volumes were skull-stripped10, and concentration maps for WM (cWM) and GM (cGM) as well as cerebrospinal-fluid (cCSF) were computed using a partial-volume estimation algorithm11. Five post-processing steps were applied to the concentration maps in order to disentangle lesions from healthy-tissues: i)Hole-filling was applied to cWM under the assumption that areas with vanishing WM concentration surrounded by WM correspond to MS lesions; ii)Ventricles and periventricular-lesions were differentiated using a ventricle mask from a template; iii)Connected-component analysis was applied to cGM, assuming that the largest connected component is GM and all remaining small components are lesions; iv)The same connected-component analysis was performed in the cCSF, where connected components within 2mm from the cortical CSF were considered as lesions; v)A registered atlas-based probability map of WM was used to improve the detection, assuming that hypointense structures in areas of high WM probability are lesions. Manual segmentation of MS lesions was performed by one radiologist and used as ground truth (GT). Virchow-Robin-spaces (VRS) were not considered and were distinguished from MS lesions12. Due to the difficulty of detecting lesions in a single-image type, in which intensity signatures may be similar to healthy-tissue, a correction of the GT by the same expert was performed. This revision was driven by the lesion-map obtained from our automated approach. The goal was to identify lesions that were missed in the first manual segmentation but detected by our automated method. The lesions that were identified after correction were not considered for the validation. Lesion-wise true-positive-rate (TPR: percentage of detected lesions that overlap with the GT-lesions) and false-positive-rate (FPR: percentage of detected lesions that do not overlap with the GT-lesions), and a voxel-wise DICE similarity coefficient (DSC) were calculated to evaluate the performance of the method. Agreement between manual and automated segmentations was also shown through a Bland-Altman-plot.Results
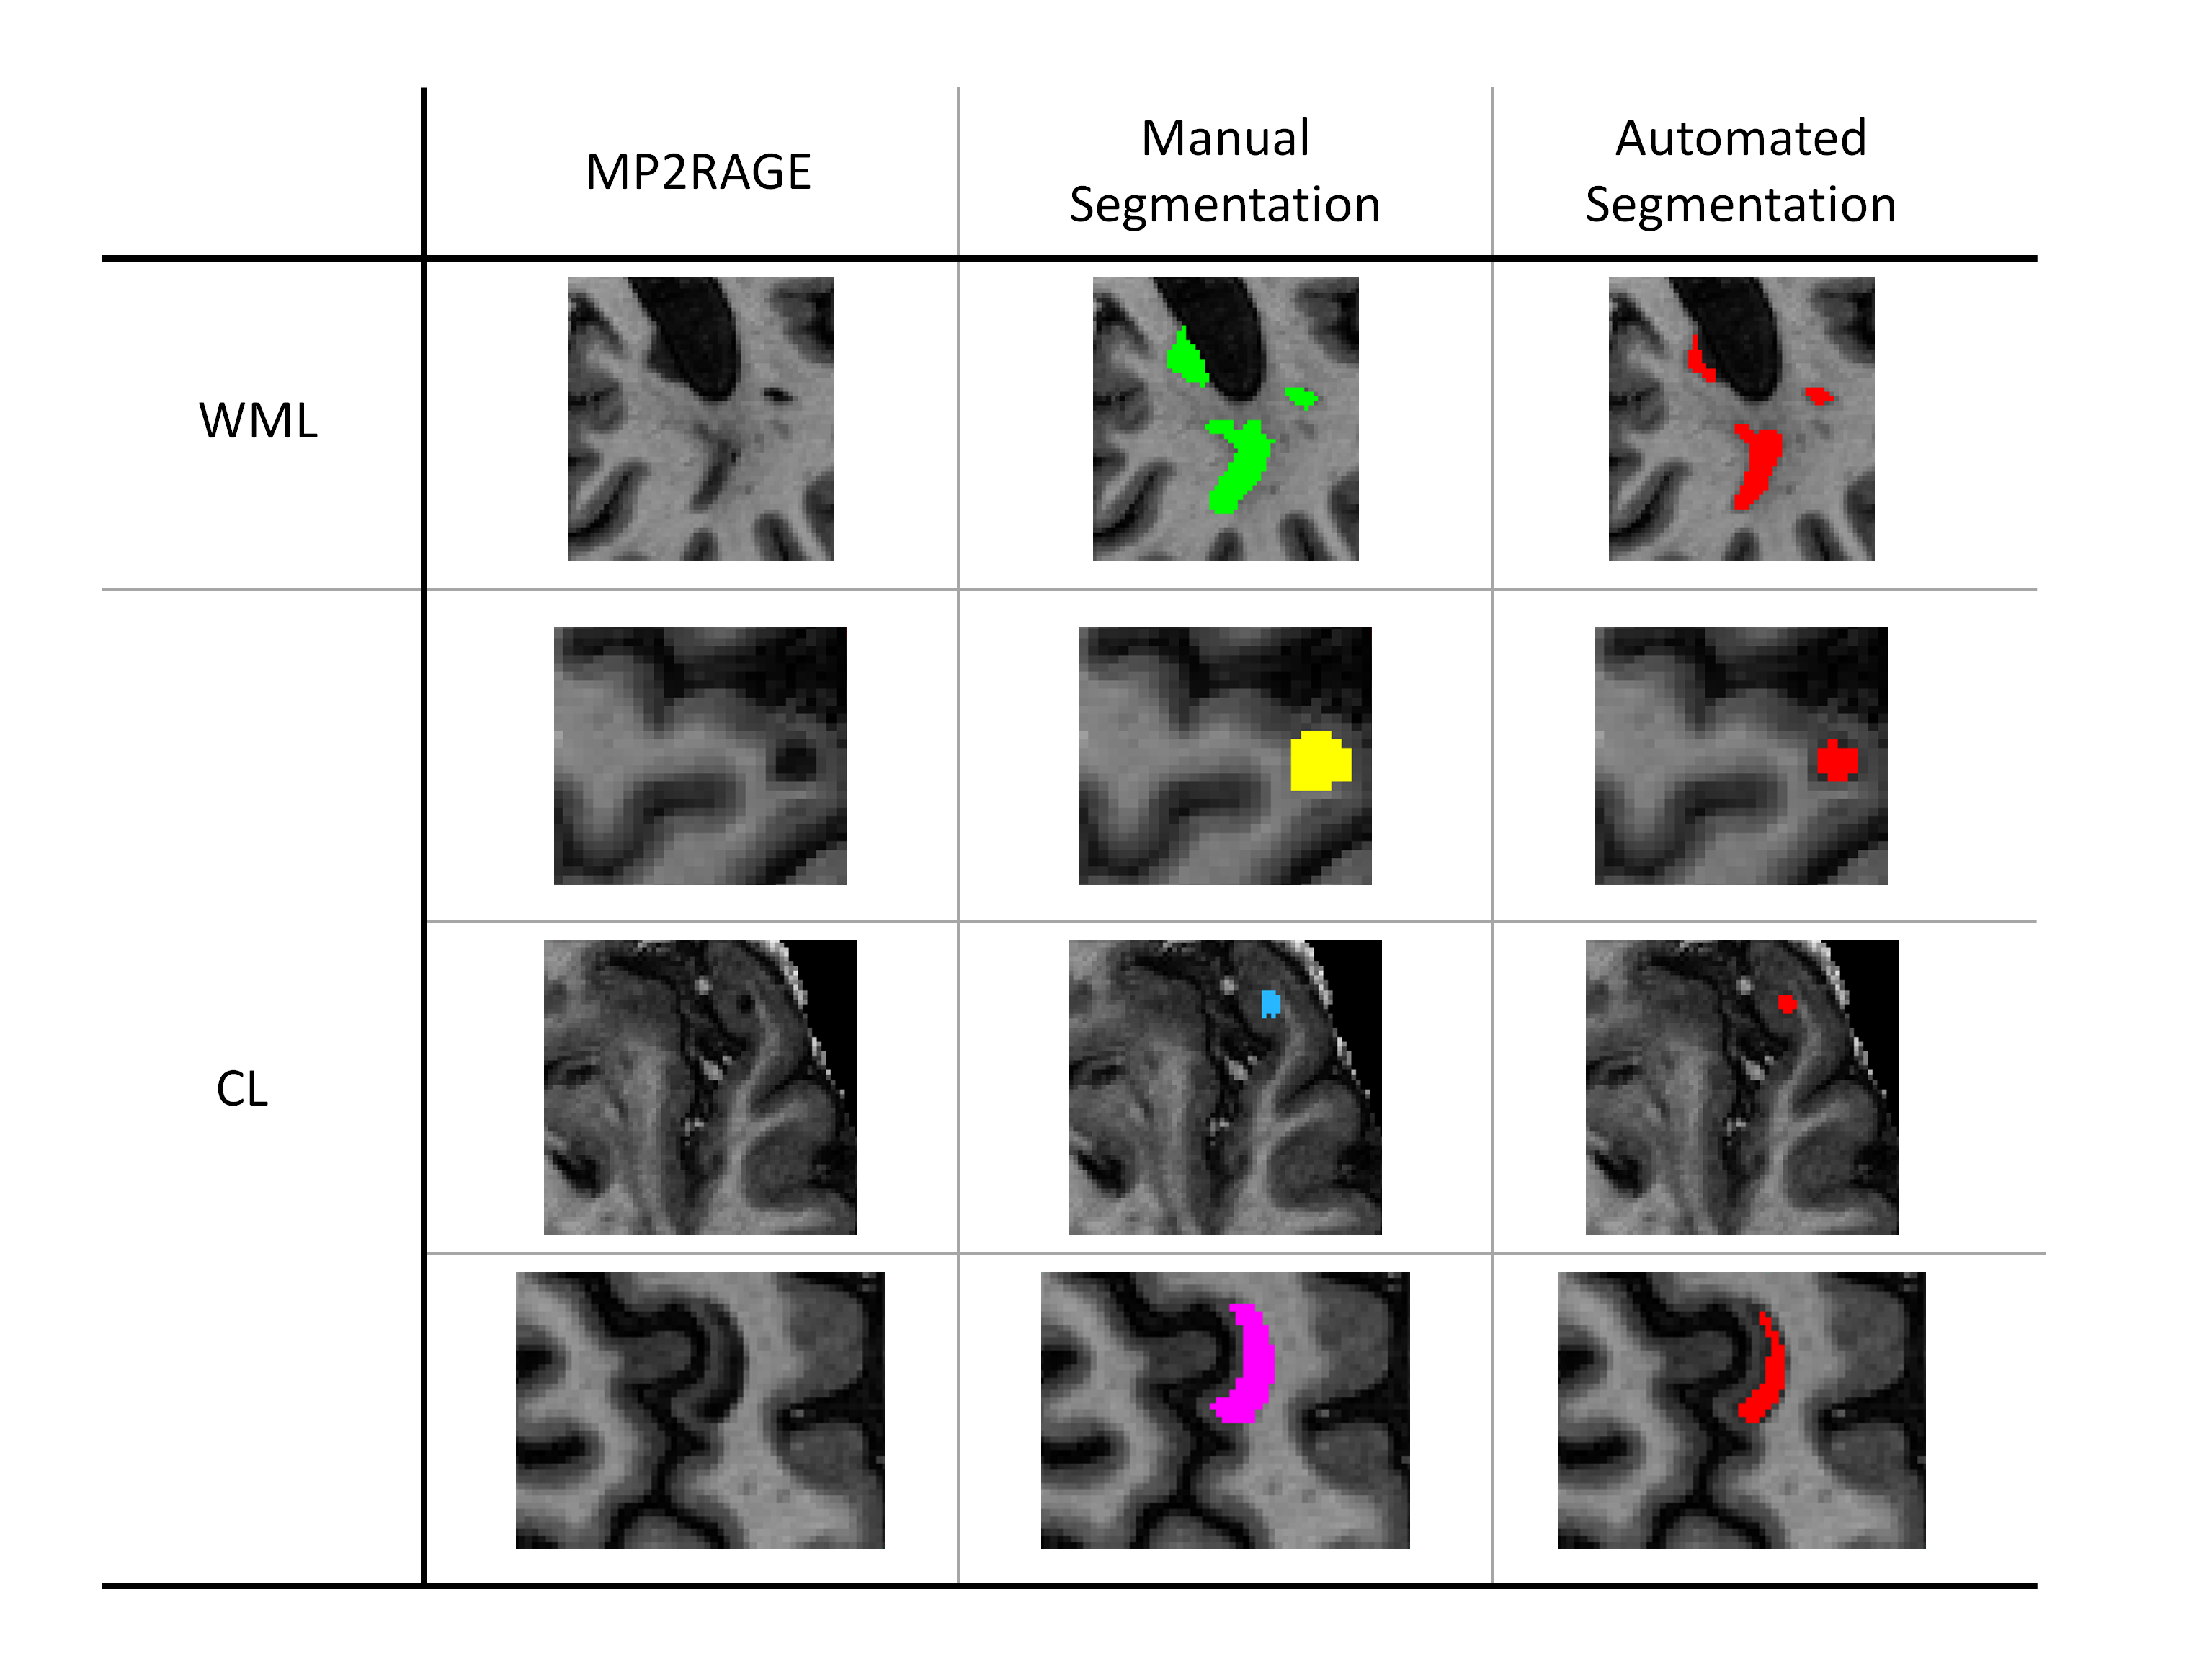
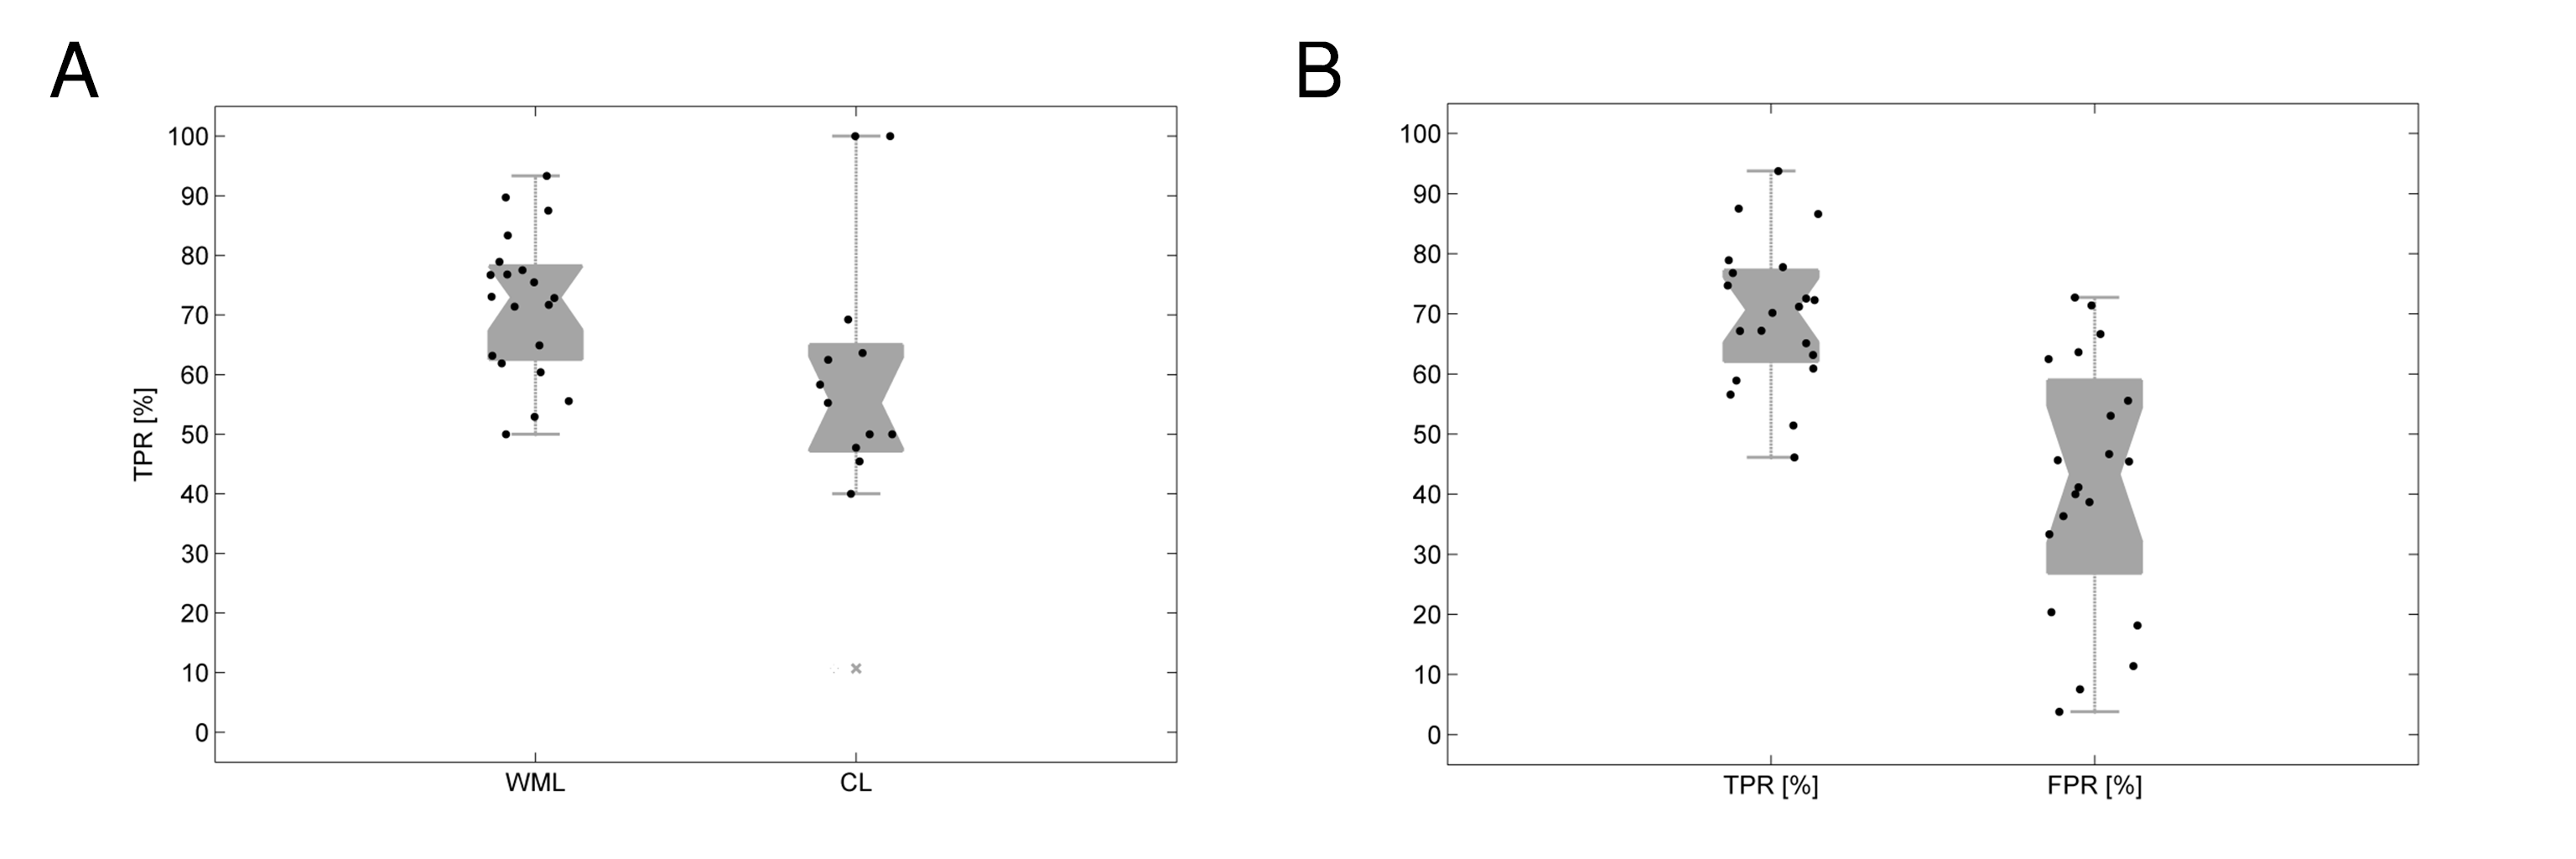
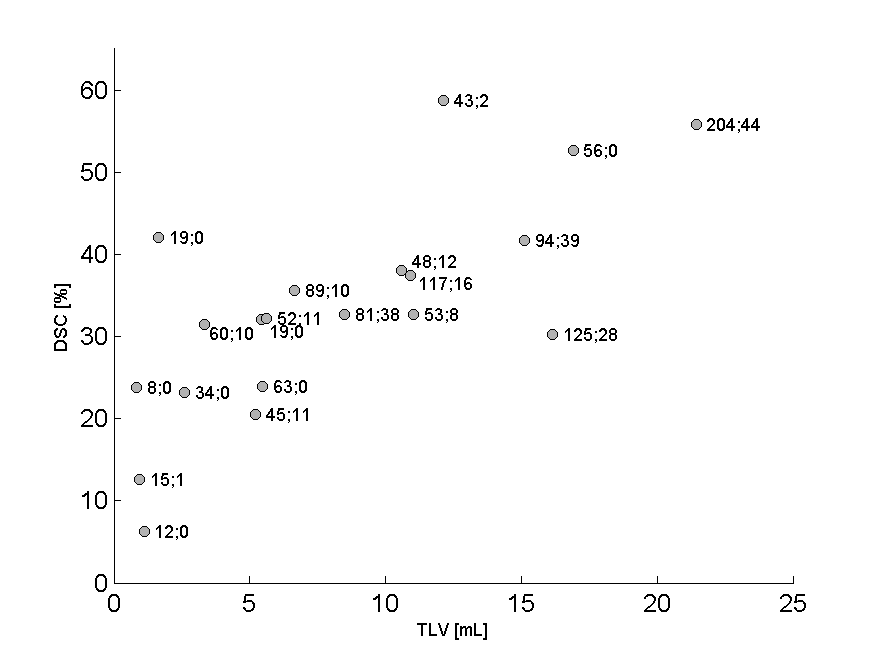
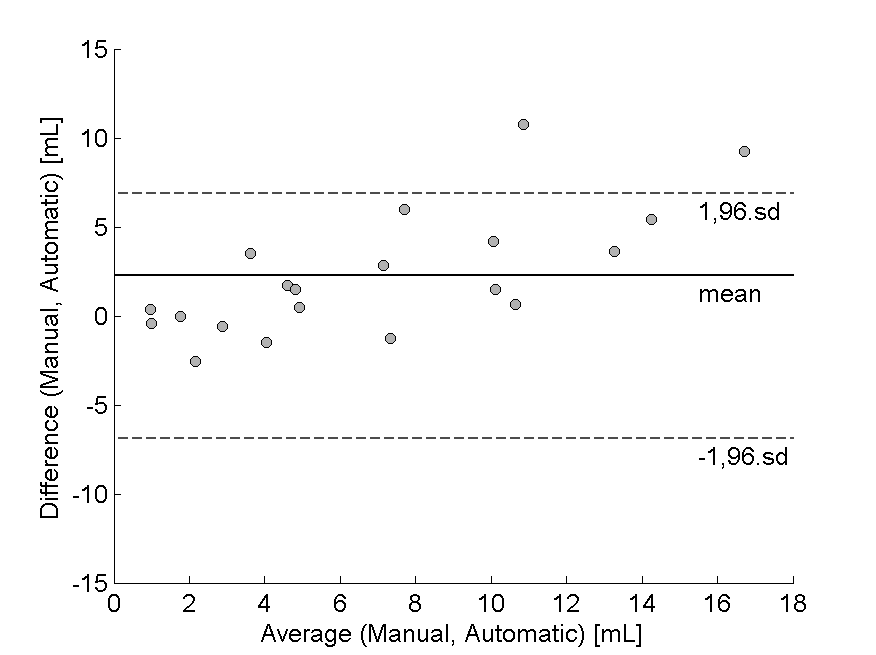
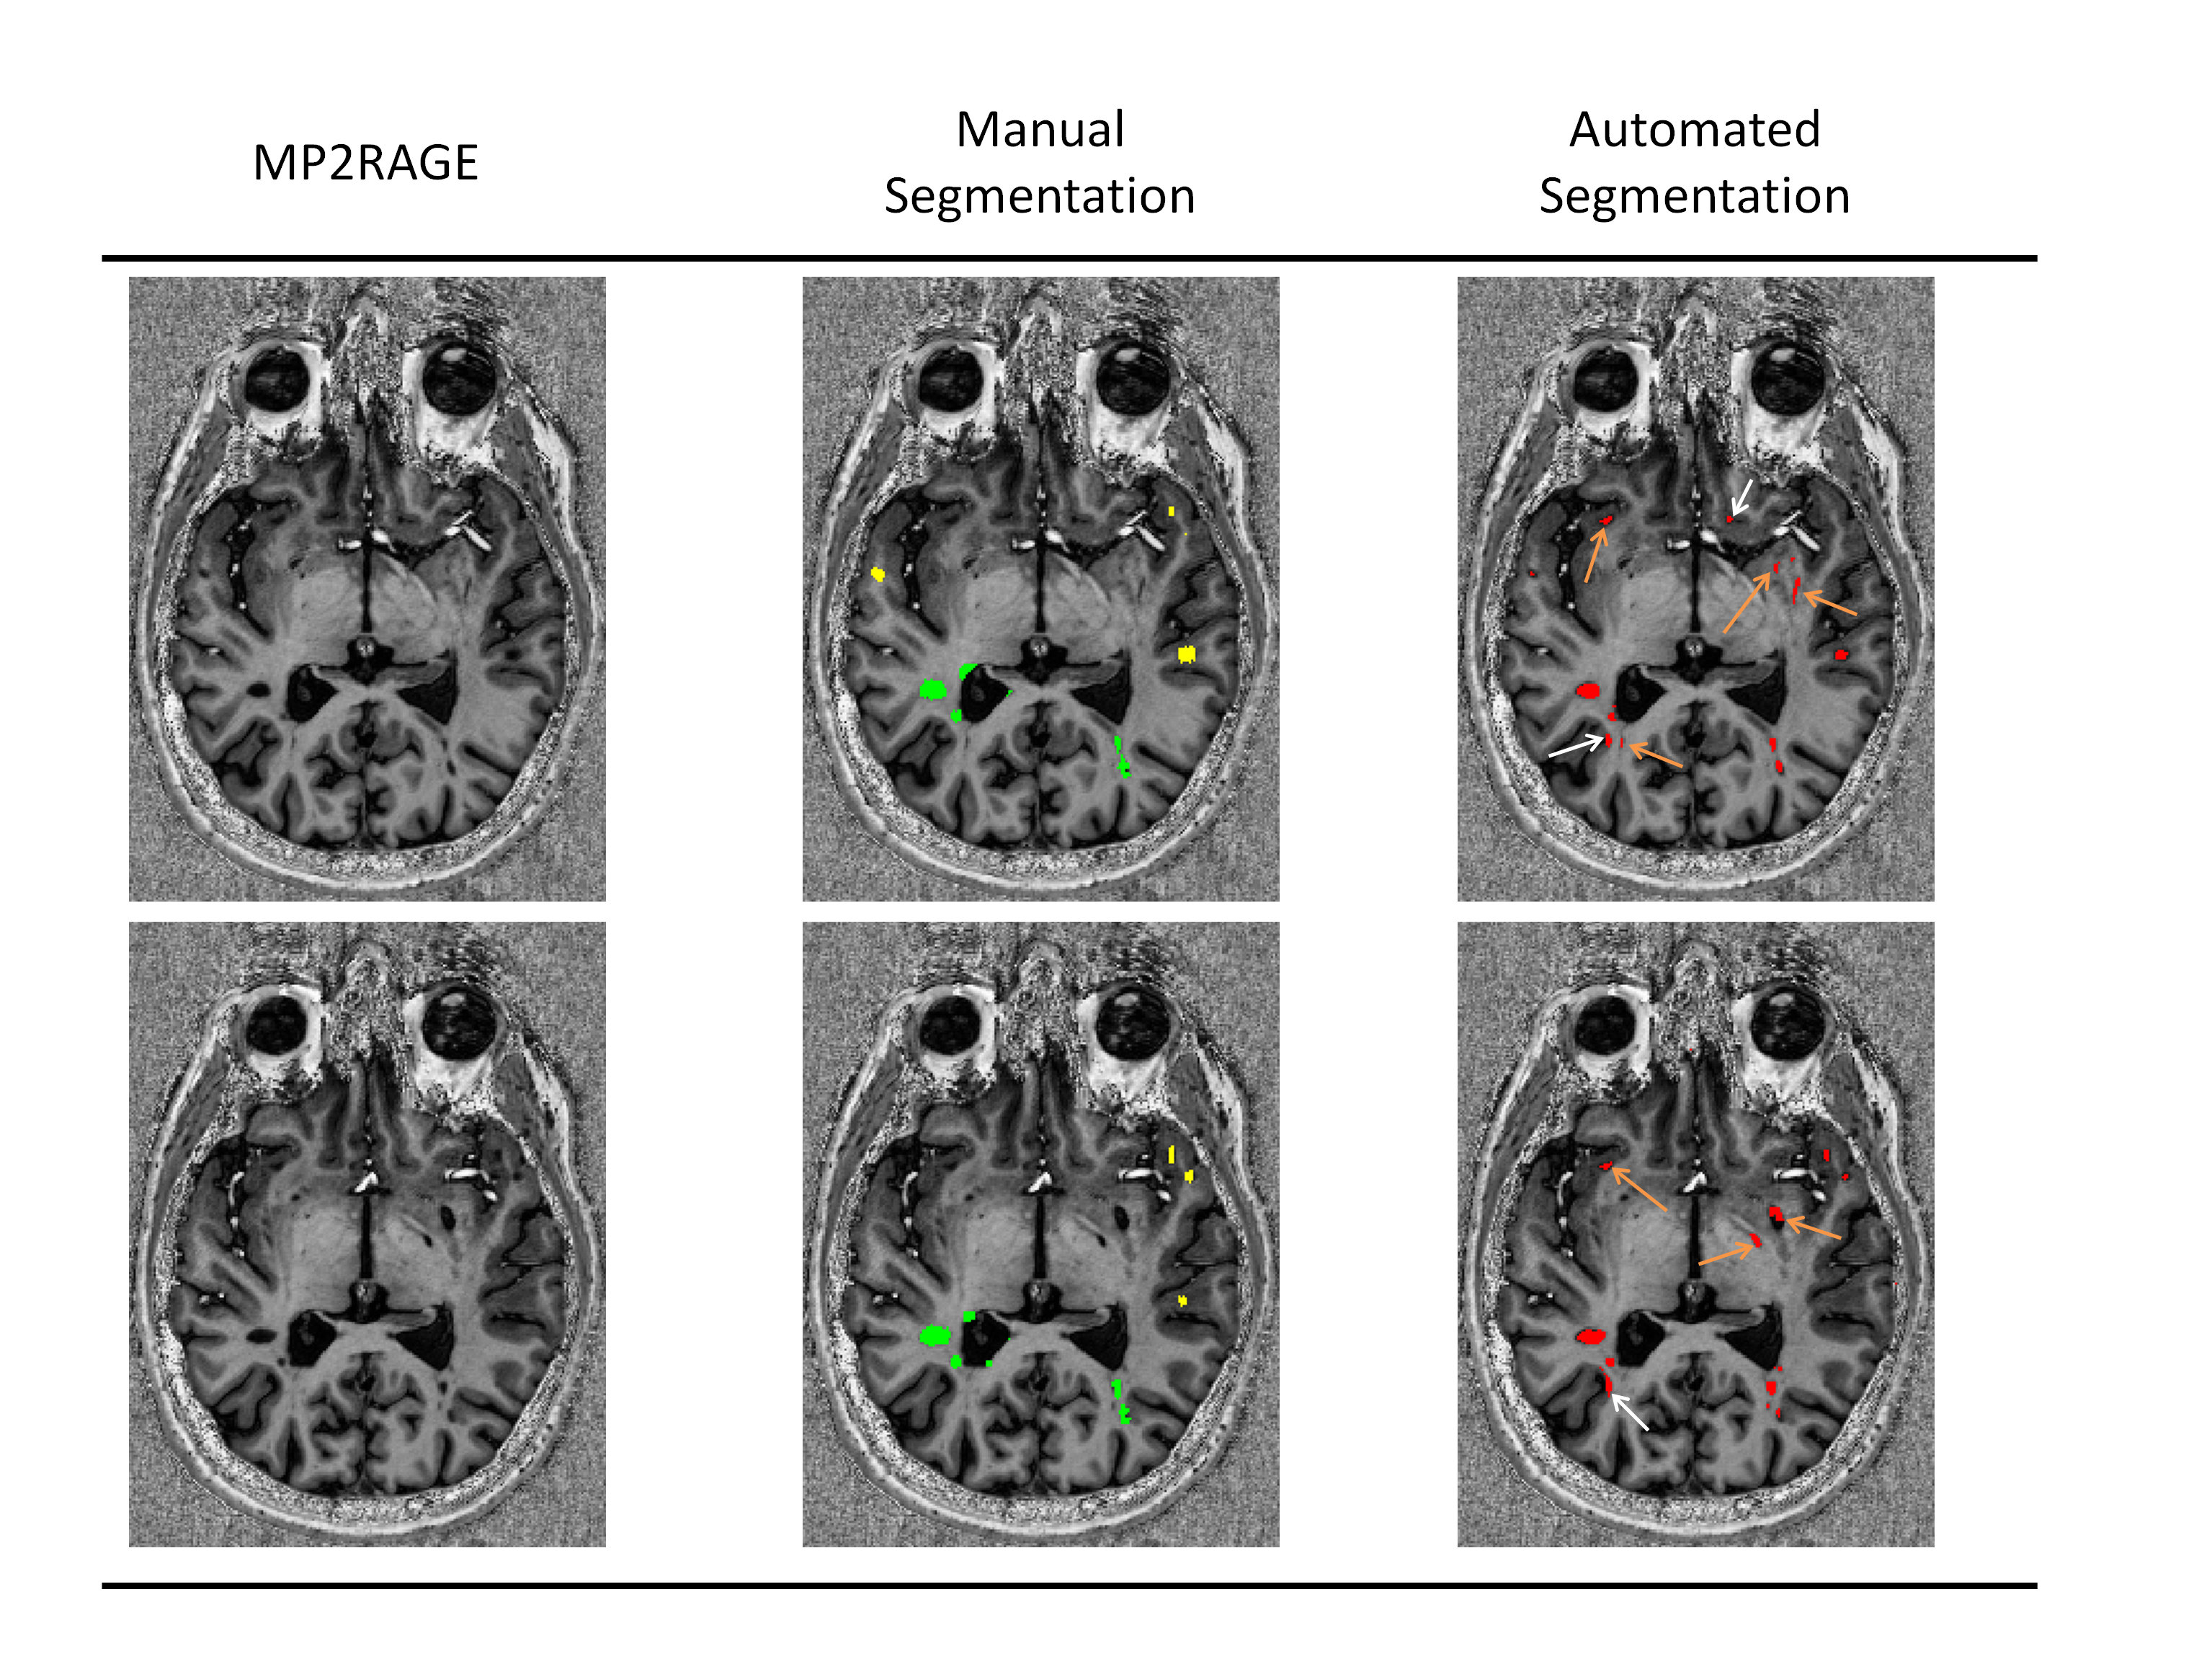
Our method automatically detected WM (WML) and cortical lesions (CL), as small as 3μL (corresponding to 6/9 voxels in CHUV/NIH datasets, Figure 1). Median of TPR for WML was 73%(range:50-93%) and 56%(range:40-100%) for CL (Figure 2A). We obtained an overall TPR median of 71%(range:46-94%) and a FPR median of 43%(range:4-73%,Figure 2B). The overall median DSC obtained was 33%, and the highest values were obtained on patients with high lesion load (DSC>40%, Figure 3). Except for two patients, volume difference quantification lies within 1.96-standard-deviations, indicating the good agreement between manual and automated segmentations.Discussion and conclusion
We have performed automated MS lesion detection on a single 7T-MP2RAGE scan. Currently, the method detects over 73% of WML and more than half of the CL. Cortical and juxtacortical lesions remain a challenge due to their smaller size (strongly affected by partial-volume), lower contrast (low degree of tissue inflammation/demyelination), and location (convoluted structure of the cortex). The method still exhibits a considerable FPR due to: i)its limitations in disentangling lesions from healthy-tissue, since they have similar signal intensities; ii)detection of structures that mimic lesions, such as small-vessels and VRS (Figure 5). Importantly, metrics like DSC are negatively biased when applied to this type of data, where in case of a small true lesion volume, a few false-positives have an artificially large penalty effect. Future work will aim to improve the current lesion detection and reduce the FPR by integrating other sequences currently used in ultra-high-field studies6 as well as to add topological information to distinguish lesions from VRS according to guidelines12.
Acknowledgements
No acknowledgement found.References
1. Mainero, C., et al., In vivo imaging of cortical pathology in multiple sclerosis using ultra-high field MRI. Neurology, 2009. 73(12): p. 941-8.
2. Sati, P., et al., Clinical T1-Weighted Brain Imaging at Ultra-High Field Using M2PRAGE: Application to Multiple Sclerosis (P4. 161). Neurology, 2016. 86(16 Supplement): p. P4. 161.
3. Tallantyre, E.C., et al., 3 Tesla and 7 Tesla MRI of multiple sclerosis cortical lesions. J Magn Reson Imaging, 2010. 32(4): p. 971-7.
4. Tallantyre, E.C., et al., A comparison of 3T and 7T in the detection of small parenchymal veins within MS lesions. Investigative radiology, 2009. 44(9): p. 491-494.
5. Absinta, M., et al., Persistent 7-tesla phase rim predicts poor outcome in new multiple sclerosis patient lesions. The Journal of clinical investigation, 2016. 126(7).
6. Absinta, M., P. Sati, and D.S. Reich, Advanced MRI and staging of multiple sclerosis lesions. Nature Reviews Neurology, 2016. 12(6): p. 358-368.
7. Marques, J.P., et al., MP2RAGE, a self bias-field corrected sequence for improved segmentation and T1-mapping at high field. Neuroimage, 2010. 49(2): p. 1271-81.
8. Kober, T., et al., MP2RAGE multiple sclerosis magnetic resonance imaging at 3 T. Invest Radiol, 2012. 47(6): p. 346-52.
9. Fartaria, M.J., et al., An Ultra-High Field Study of Cerebellar Pathology in Early Relapsing-Remitting Multiple Sclerosis Using MP2RAGE. Investigative Radiology, 2016.
10. Falkovskiy, P., et al., Quantitative comparison of MP2RAGE skull-stripping strategies.
11. Roche, A. and F. Forbes, Partial volume estimation in brain MRI revisited, in Medical Image Computing and Computer-Assisted Intervention–MICCAI 2014. 2014, Springer. p. 771-778.
12. Wuerfel, J., et al., Perivascular spaces—MRI marker of inflammatory activity in the brain? Brain, 2008. 131(9): p. 2332-2340.
Figures