2407
Quantitative Measurement of Cerebral Blood Volume Across 173 Brain Regions In Anethesia and Response to CO21Physics, Northeastern University, Boston, MA, United States, 2Gordon Center for Medical Imaging, Massachusetts General Hospital, Harvard Medical School, Boston, MA, 3Bioengineering, Northeastern University, Boston, MA, United States, 4Psychology, Northeastern University, Boston, MA, United States, 5Physics, Bioengineering, Northeastern University, Boston, MA, United States
Synopsis
We use a technique based on positive contrast quantitative imaging of super paramagnetic iron oxide nanoparticles with optimized parameters which we have previously introduced called QUTE-CE to measure CBV across a detailed rat brain atlas. This is done for an anesthetized state and then changes in an awake hypercapnic state are additionally quantified. The former provides a baseline for future work and reflects evolutionary and developmental forces. The latter demonstrates the potential of the technique for measuring changes in CBV and provides a measure of perfusion reserve.
Introduction
This research was performed in the development of a technique for the measurement and characterization of neurovascular via a newly optimized imaging modality. This modality uses super-paramagnetic iron oxide nanoparticles (SPIONs) as a positive contrast agent by combining them with an ultrashort time-to-echo (UTE) imaging sequence which was developed in our lab previously1. The architecture of the vasculature and its total cerebral blood volume in different functional brain regions is believed to be seriously altered during neurodegenerative diseases2. Thus, the ability to absolutely and quantitively measure this neurovascularture, as well as its reactivity and perfusion reserves under state changes, across many specialized functional regions of the brain is of both neuroscientific and clinical relevance. We therefore worked to measure cerebral blood volume (CBV) in 173 regions of the rat brain under anesthesia and investigated changes in this metric in response to hypercapnia which is a standard test of perfusion reserve.Methods
The previously developed quantitative UTE with contrast enhancement (QUTE-CE) MRI technique provides the basis for this work. This technique creates purely T1-weighted positive contrast angiographic images via application of a 3D UTE pulse sequence combined with the intravascular SPION contrast agent (CA), ferumoxytol (Feraheme, AMAG Pharmaceuticals, Waltham, Massachusetts, USA). In this investigation, N=11 Sprague Dawley rats were dosed with 200 µg/ml Fe and imaged in a horizontal magnet (Bruker, Billerica, Massachusetts, USA) equipped with a 20-G/cm magnetic field gradient insert (ID = 12 cm, Bruker) and a custom 30mm diameter 300 MHz quadrature volume coil. Animals were imaged without contrast agent under isoflurane anesthesia, allowed to awaken for 25 minutes, given the bolus injection of CA, made to breath 5% CO2, and then re-imaged under anesthesia. A correction for inhomogeneity effects was applied to the raw intensity images prior to atlas based analysis. The atlas was previously developed for MRI of similar resolution and adapted from Paxinos and Watson3.Results
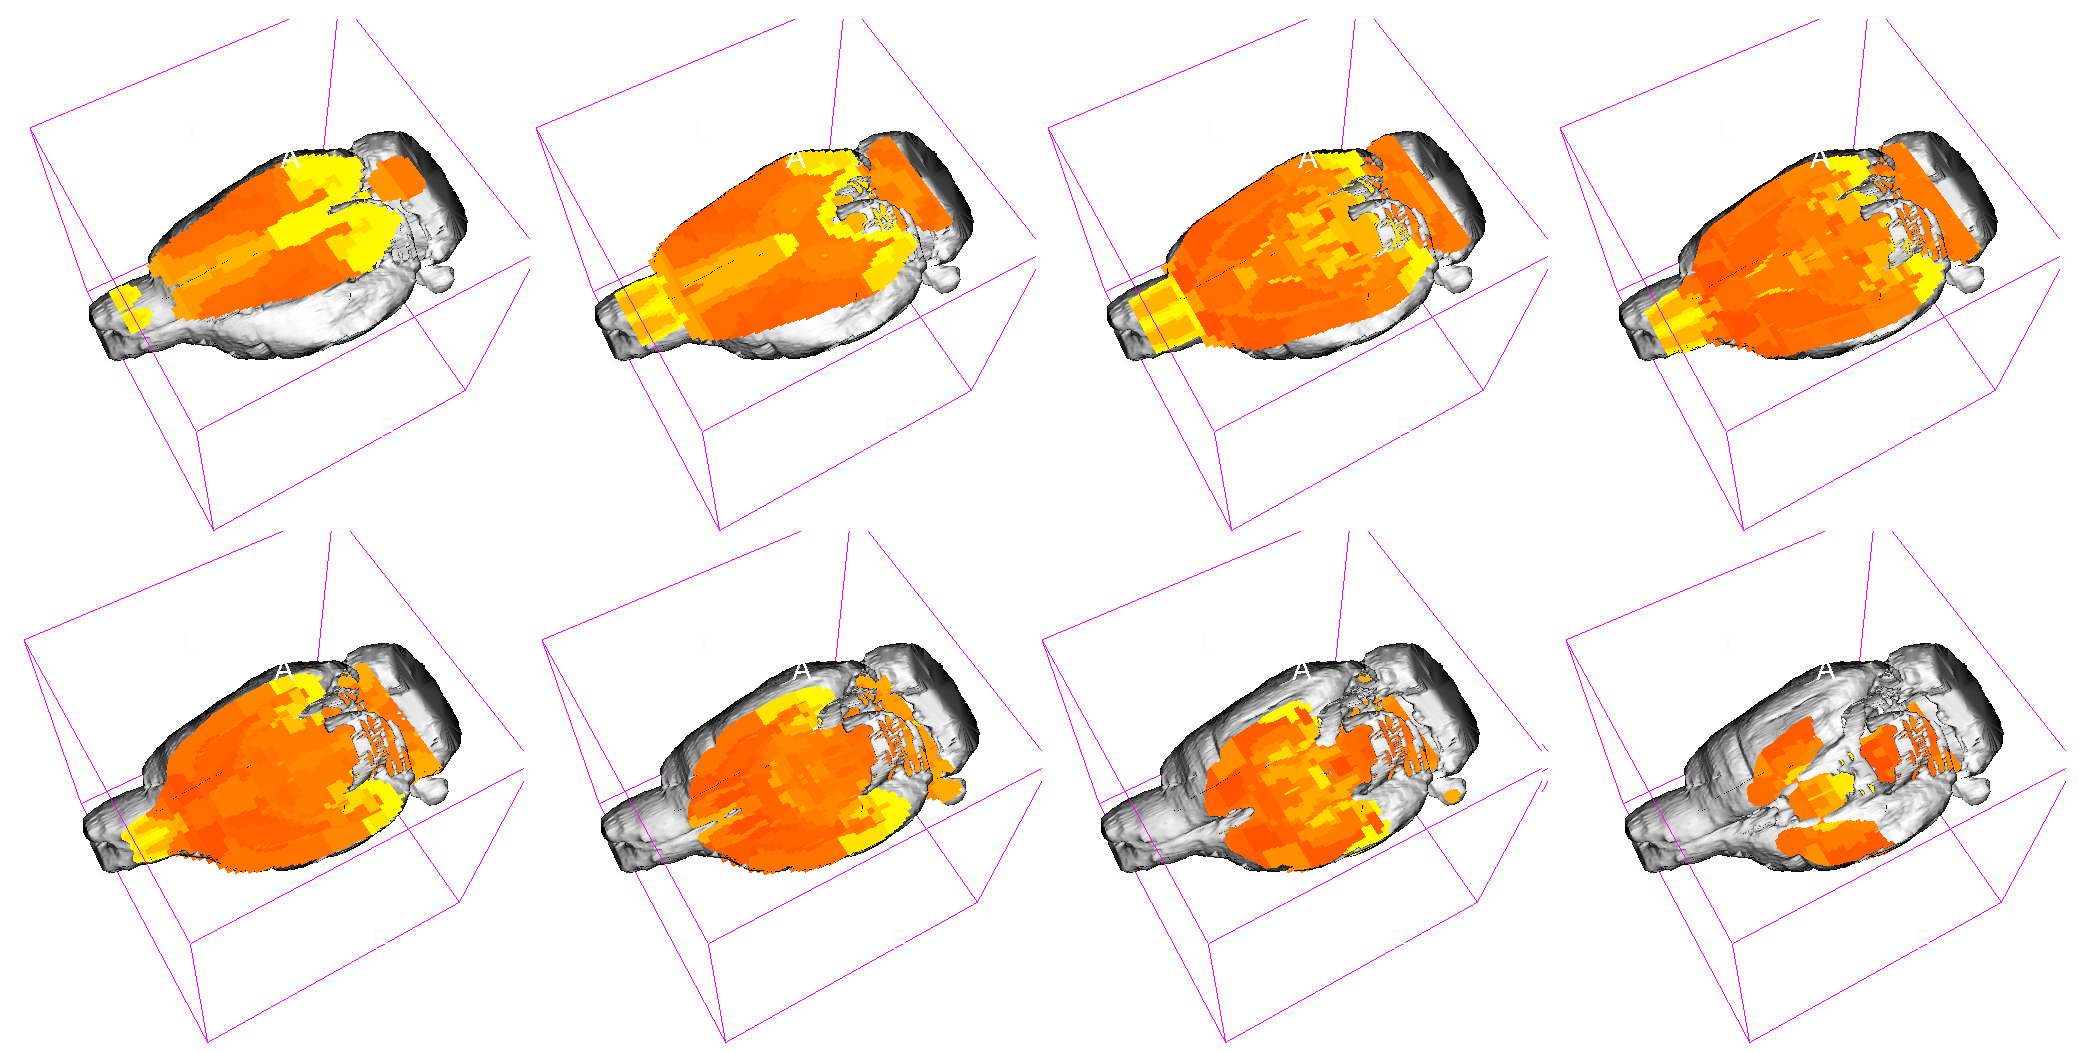
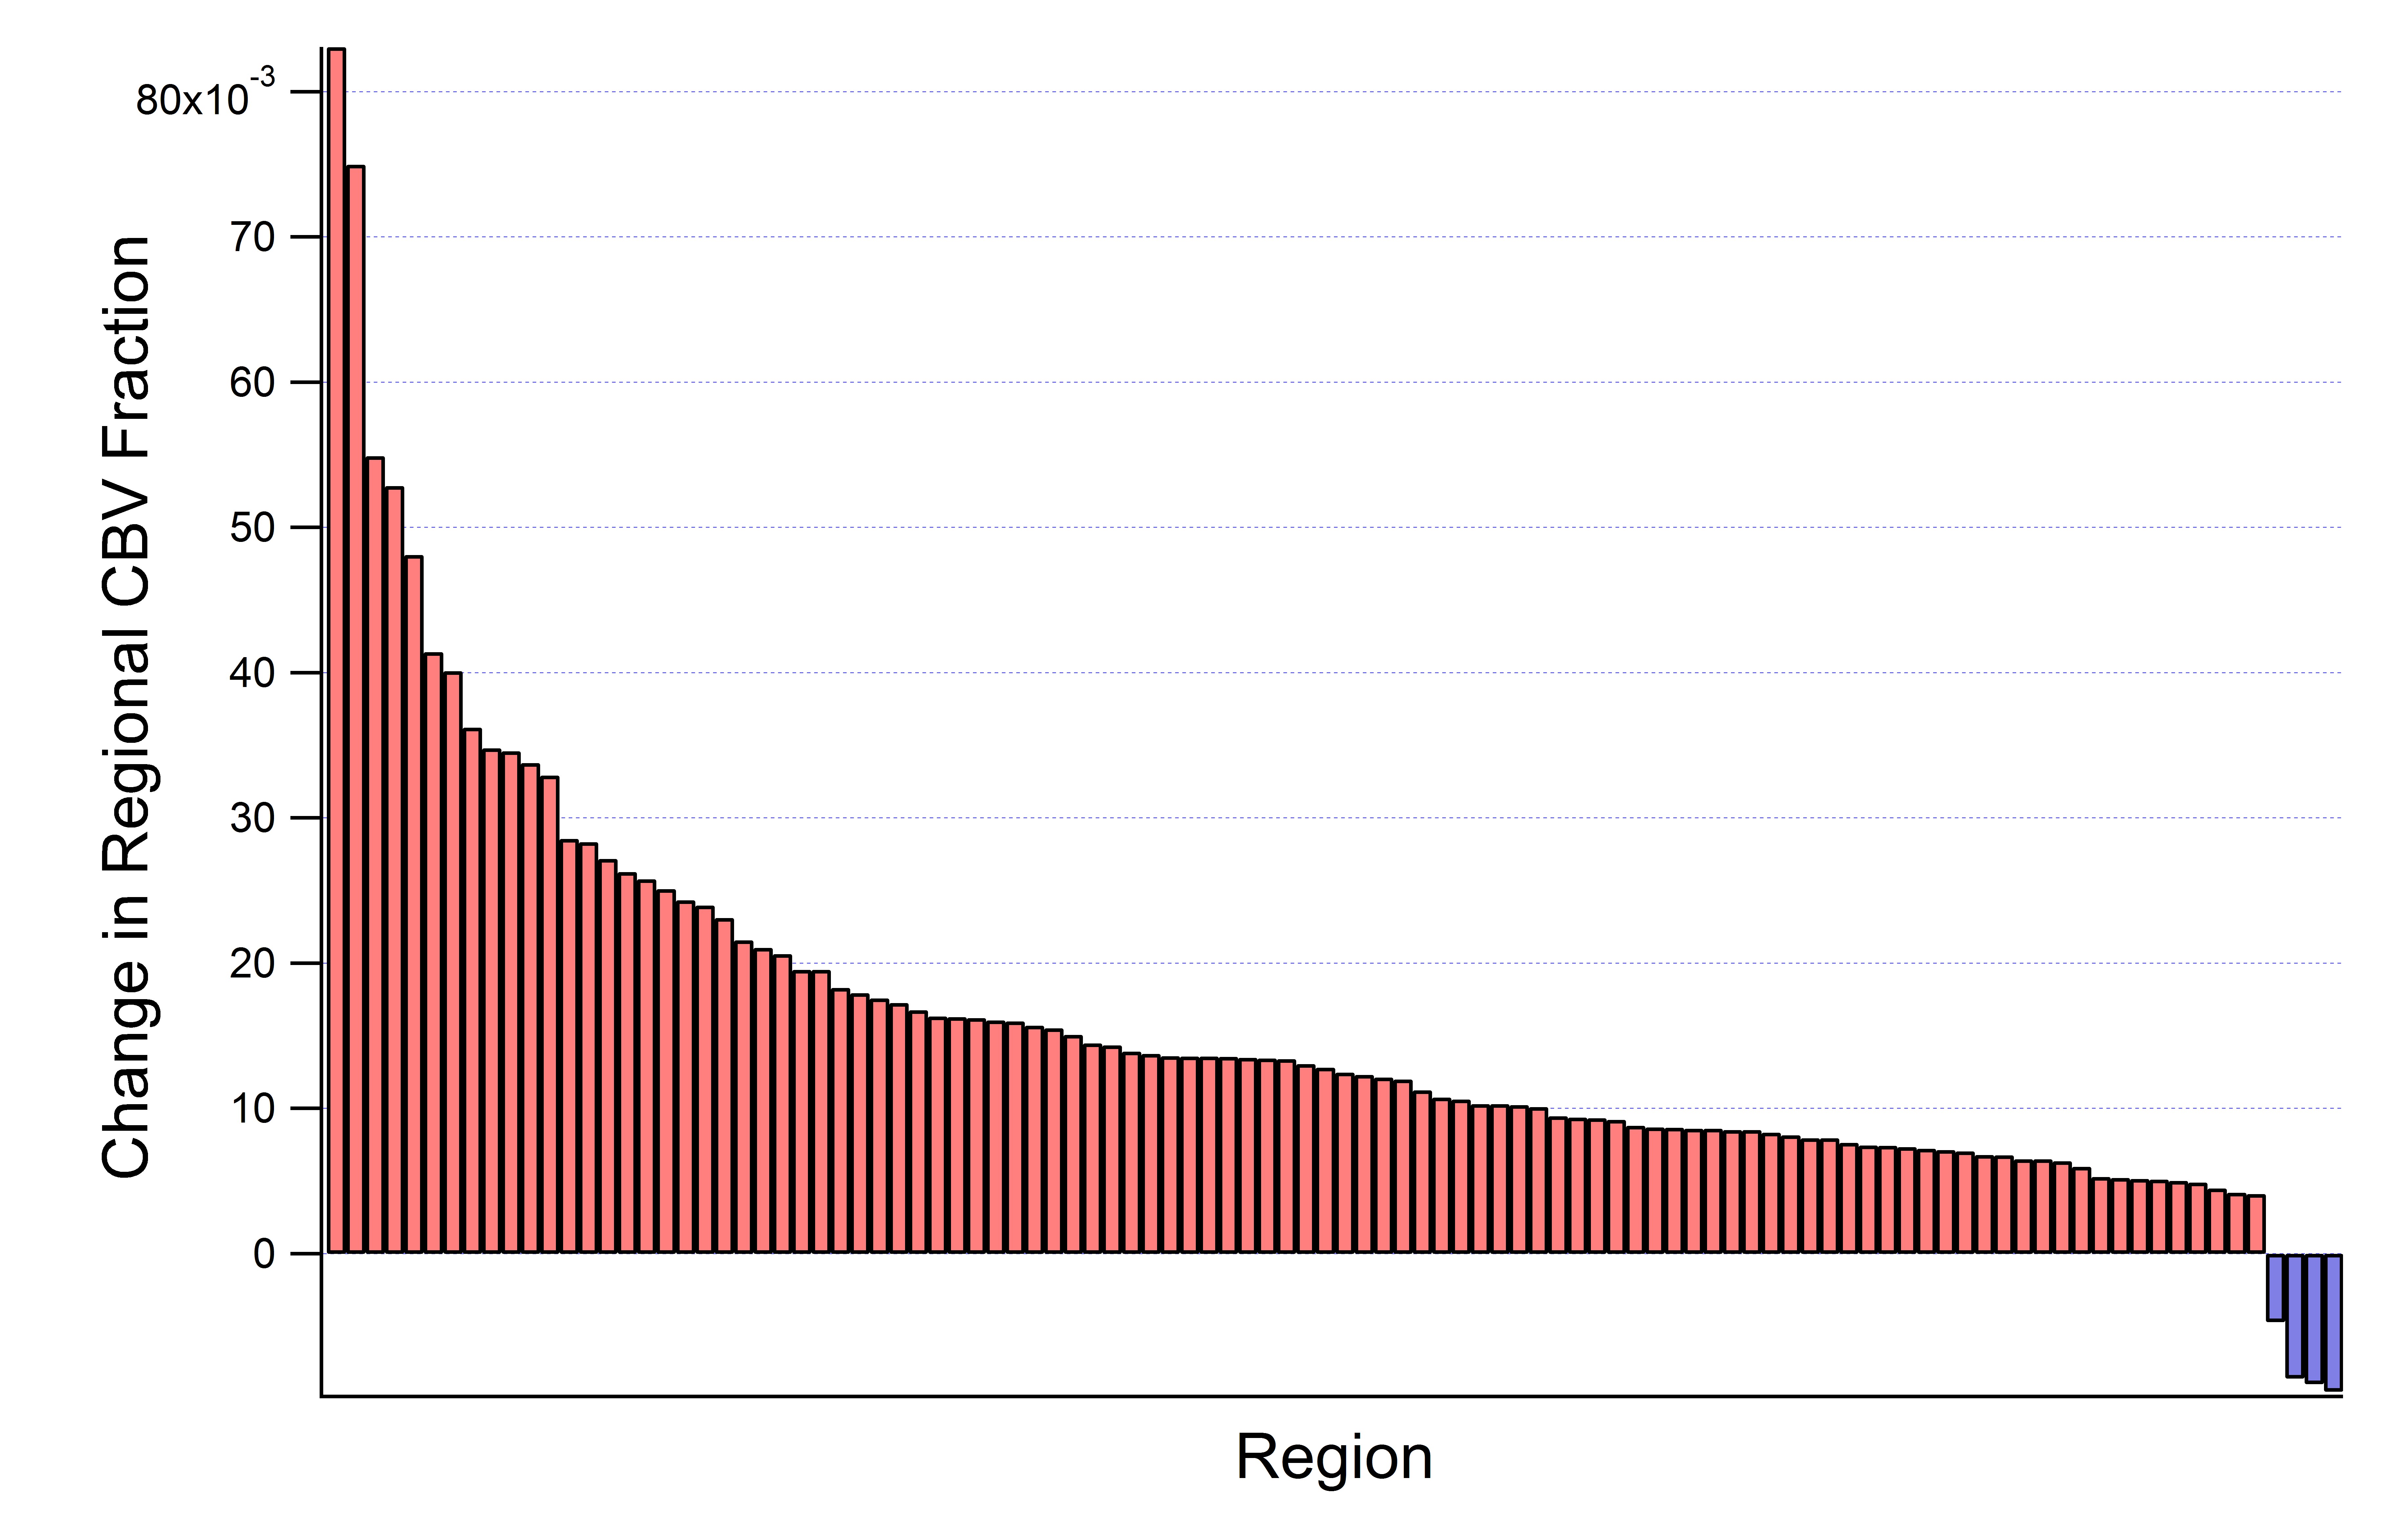
CBV was calculated on this regional basis using partial volume effects in a multistep process accounting for state-change. Example slices are presented in Fig. 1 for the anesthetized state. The whole brain for the anesthetized state was found to have $$$9.31\pm0.91$$$% CBV while the CO2 challenged state had $$$10.79\pm1.18$$$%. Regional differences in CBV between these states were calculated per-animal. A t-test against the null hypothesis of no change found 104 statistically significant changes with $$$p\leq.05$$$ out of the 173 brain regions. These regional changes are presented in Fig. 2.Discussion And Conclusion
These data demonstrate the utility of the technique for characterizing CBV in a repeatable way between animals.The fundamental variation between regions carries neuroscientific implications as developmentally, regions will require vascularity commensurate with their general activity and use. Further, the fact that 60% of regions showed changes from this baseline in the CO2 induced hypercapnic state provides both a metric of vascular reactivity and a proof of concept for the use of the technique in measuring CBV change. As animals are often anesthetized during research scans, this portion of the work provides a useful base-line for further work investigating changes under other manipulations.Acknowledgements
This work was supported in part by HHS 1R21DA042583 and IGERT fellowship awarded to CAG and LT under NSF-DGE- 0965843.References
1. Gharagouzloo, C.A., P.N. McMahon, and S. Sridhar, Quantitative contrast-enhanced MRI with superparamagnetic nanoparticles using ultrashort time-to-echo pulse sequences. Magnetic resonance in medicine, 2014. 00: p. 1-11.
2. C.-C. V Chen, Y.-C. Chen, H.-Y. Hsiao, C. Chang, and Y. Chern, “Neurovascular abnormalities in brain disorders: highlights with angiogenesis and magnetic resonance imaging studies.,” J. Biomed. Sci., vol. 20, p. 47, 2013.
3. Paxinos, Watson; The Rat Brain in Stereotaxic Coordinates, 6th Edition, 2006; 9780125476126
Figures