2405
Exploring complementarity in multi-modal imaging of cortex microstructure: a diffusion and relaxometry study1CRCHUM, Université de Montréal, Montreal, QC, Canada, 2MR Clinical Science, Philips Healthcare Canada, Markham, ON, Canada, 3NeuroPoly Lab, Ecole Polytechnique, Montreal, QC, Canada, 4Montreal Heart Institute, University of Montreal, Montreal, QC, Canada, 5CHUM Notre-Dame, Montreal, QC, Canada, 6CRCHUM, Montreal, QC, Canada, 7Université de Montréal, Montreal, QC, Canada, 8Division of Neurology, CHUM Notre-Dame, Montreal, QC, Canada, 9Department of Neuroscience, Université de Montréal, Montreal, QC, Canada
Synopsis
We explored the utility and complementarity of different diffusion and relaxometry metrics for cortical imaging. The following metrics were assessed for correlation: mean kurtosis (MK) from diffusion kurtosis imaging, intra-cellular volume fraction (ICVF), from the NODDI model, intra-neurite volume fraction (VINT), from the multi-compartment microscopic diffusion imaging (MCMICRO) model, R1 (=1/T1), R2* (=1/T2*) and the ratio of T1w/T2w images. Some global similarities can be seen between most cortical maps, while some features that suggest complementarity between diffusion and relaxometry maps were also observed. This study emphasizes the importance of better understanding and characterising the relationship between different MRI-derived metrics.
PURPOSE
There is growing interest in characterising the brain microstructure using multimodal MRI1–5. Several studies have looked into the relationship between diffusion imaging, relaxometry, and myelin content in the white matter6–9 but few have done so for the gray matter10–12. In this study, we examine the utility and complementarity of some diffusion and relaxometry metrics for cortical imaging.METHODS
As part of an ongoing study on epilepsy and dyslexia, we acquired multimodal MRI data from 24 participants (17F, 19-68yo, 11 dyslexic or epileptic subjects free from visually detectable brain anomaly, 13 healthy controls) at 3T:
a) 1 mm isotropic T1-weighted and T2-weighted images;
b) diffusion imaging (2 mm isotropic multi-shell acquisition with eight b=300, thirty-two b=1000, sixty b=2000 mm²/s directions and 7 interleaved b=0 mm²/s acquisitions);
c) multi-contrast imaging (1 mm isotropic multi-echo VFA-FLASH with flip angles of 6 and 34 degrees and 12 echoes) targeting quantitative tissue assessment (R1 and R2*)13.
To maximize statistical power, all participants were included in this preliminary study.
The following metrics were assessed:
a) mean kurtosis (MK), a model-free metric from diffusion kurtosis imaging (DKI)14;
b) intra-cellular volume fraction (ICVF), from the NODDI model15;
c) intra-neurite volume fraction (VINT), from the multi-compartment microscopic diffusion imaging (MCMICRO) model16;
d) R1 (=1/T1);
e) R2* (=1/T2*);
d) the ratio of T1w/T2w images, an indirect measure of myelin content17.
The metrics were mapped to the cortex of each subject and averaged across the group. The maps were visually examined for qualitative contrast correlations between metrics. Vertex-wise correlation coefficients between each metric pair were also computed.
RESULTS
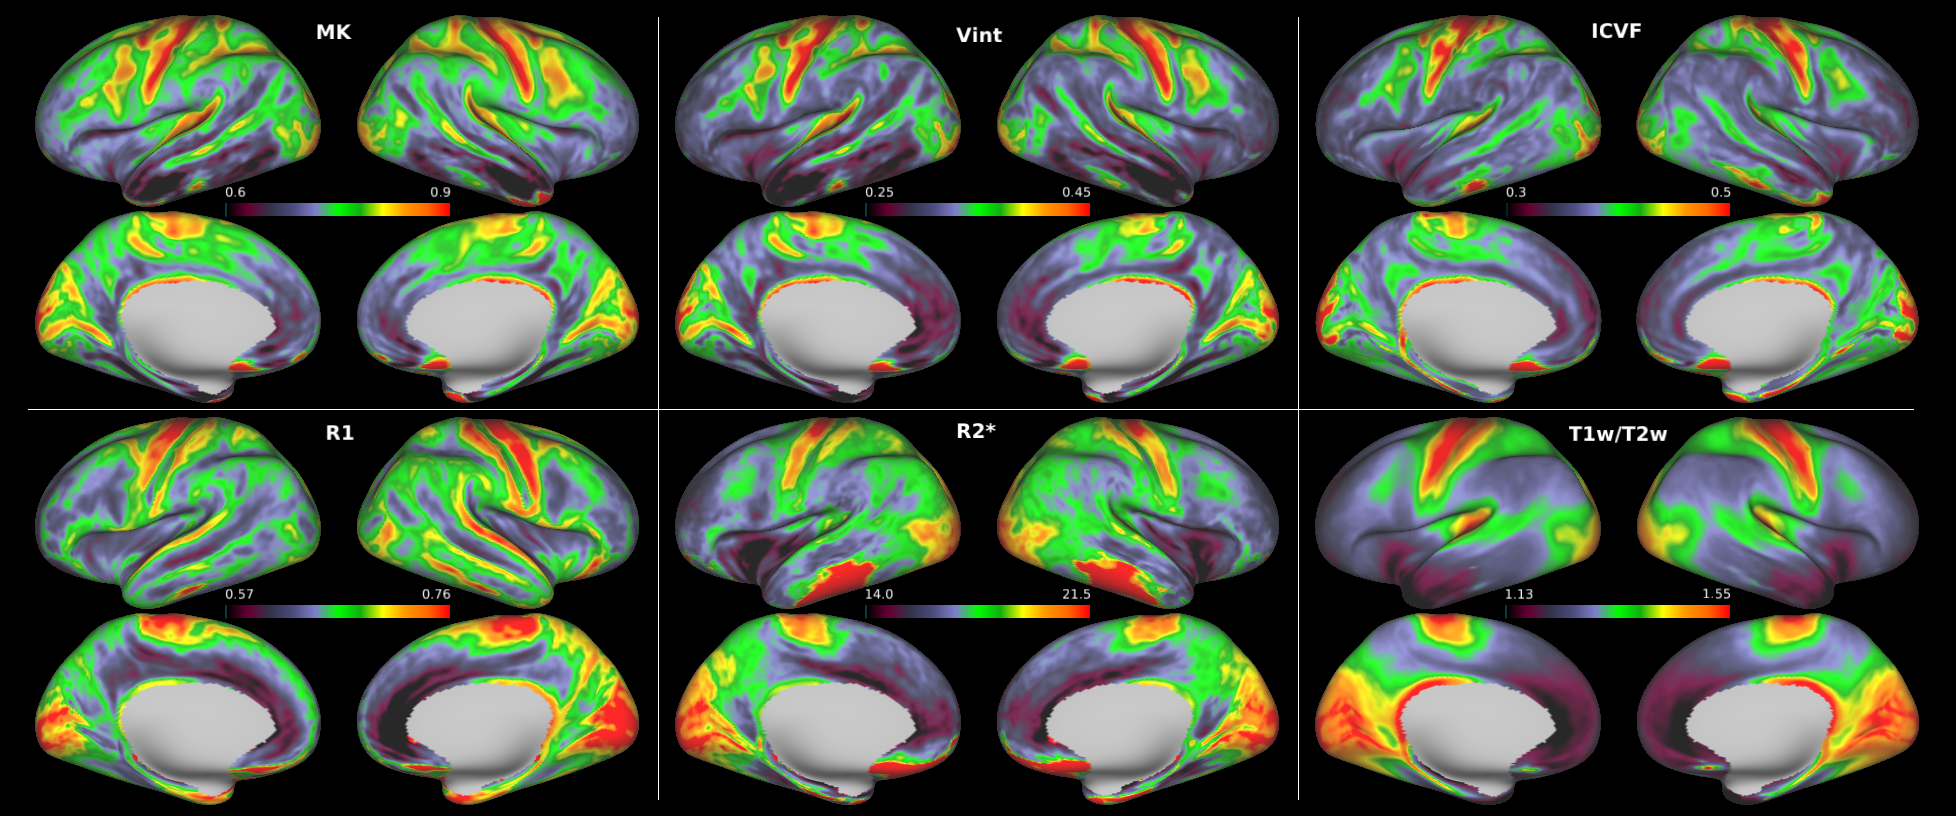
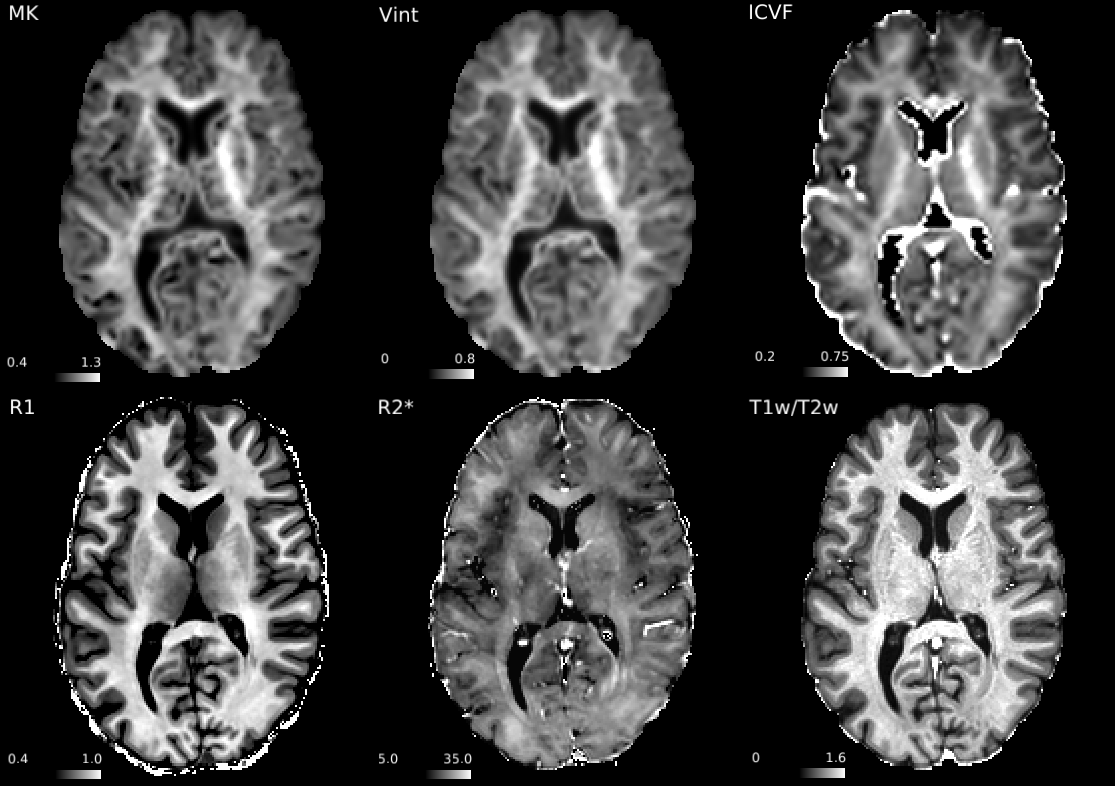
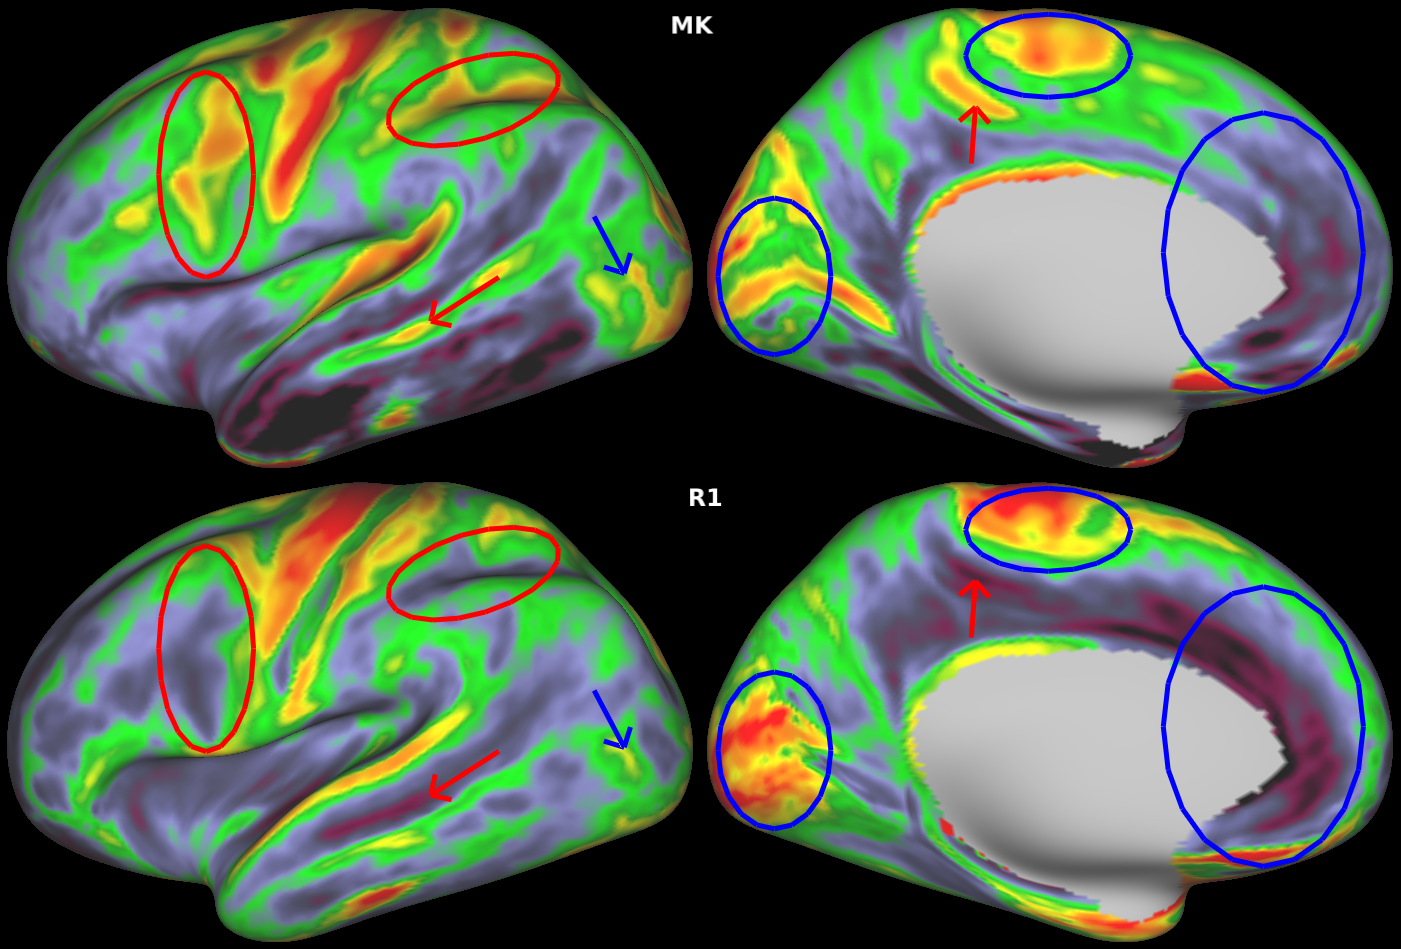
Figure 1 shows the group-averaged maps while Fig. 2 shows an individual subject’s maps. A single slice of the volumetric maps from a single subject is shown in Fig. 3. Qualitatively, regions of high and low values were spatially concordant in most cortical maps. Notably, matching higher values were identified in the primary motor, premotor and supplementary motor cortices as well as primary somatosensory, visual and auditory cortices, while lower values were observed in the anterior cingulate gyrus and insula. Despite these overall similarities, some features that suggest complementarity between diffusion and relaxometry maps were observed. Figure 4 shows for example that although R1 and MK maps have qualitatively similar contrast in the medial part of the hemispheres, they present inverted contrast in several other regions.
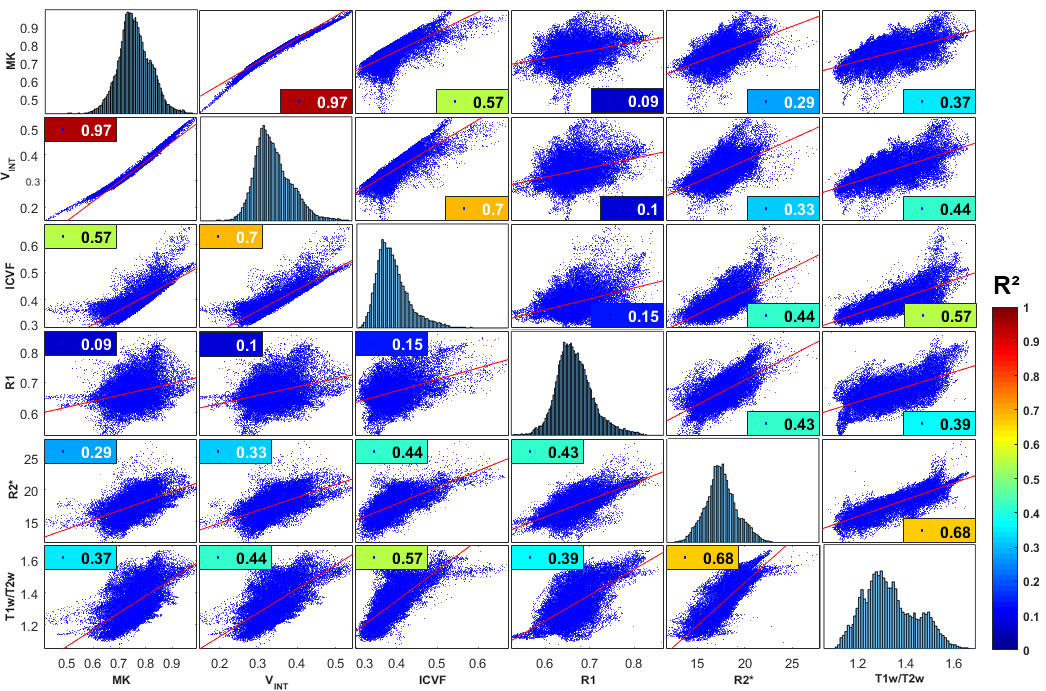
Figure 5 shows the vertex-wise scatter plot correlation between each pair of parametric maps. Of all the maps, T1w/T2w showed the greatest overall correlation with every other parameter (R²=0.37-0.68). R1 correlated poorly with diffusion-derived parameters (R²=0.09-0.15), but strongly with R2* (R²=0.43). R2* showed a moderate to strong correlation with diffusion metrics (R²=0.29-0.44). All diffusion parameters were strongly correlated. Most striking is the correlation between MK and Vint (R²=0.97).
DISCUSSION
Using a multi-modal MRI acquisition, we saw a globally similar cortical contrast between different parametric maps. We suggest that this could be explained because each metric is sensitive to some characteristics of the same underlying environment, with all chosen markers being affected to various degrees by the cyto- and myeloarchitecture. Despite these resemblances, we also showed how R1 and diffusion metrics are poorly correlated across the entire cortex, but seem to be related on a more local basis. This suggests that combining diffusion data with quantitative relaxometry might prove useful in characterizing the microstructure, by exploiting the sensitivity of these measures to different underlying physical properties of the cortex. On the other hand, combining any of the diffusion metrics analyzed here would presumably prove of little interest, as all showed a very strong correlation. The near perfect match between MK and Vint is well-explained by the theoretical relationship between kurtosis and the volume fraction of a two compartment model, as described in Jensen (2010)14.
One potential limitation of this pilot study is the heterogeneity of the population composed of normal volunteers and epileptic patients spanning a wide age range. One should also be careful not to overinterpret this data, as some correlations between metrics could be mediated by other factors, such as cortical thickness and partial volume effects.
CONCLUSION
Multimodal MRI currently allows the study of several metrics sensitive to different cortical microstructure properties. Despite several correlations between metrics, some notable differences were also observed. This complementary nature of multimodal MRI could prove useful in the identification of cortical pathology and age-related changes. This study also emphasizes the importance of better understanding and characterising the relationship between these different metrics and how they can be related to the underlying cyto- and myeloarchitecture of cortical gray matter.Acknowledgements
This study was funded by the Quebec Bio-Imaging Network (QBIN) pilot project grant number 13.19 and by the Savoy Foundation for epilepsy.
References
1. Dodd JW, Chung AW, Van Den Broek MD, Barrick TR, Charlton RA, Jones PW. Brain structure and function in chronic obstructive pulmonary disease: A multimodal cranial magnetic resonance imaging study. Am J Respir Crit Care Med. 2012;186(3):240-245. doi:10.1164/rccm.201202-0355OC.
2. Hasan KM, Walimuni IS, Abid H, Datta S, Wolinsky JS, Narayana PA. Human brain atlas-based multimodal MRI analysis of volumetry, diffusimetry, relaxometry and lesion distribution in multiple sclerosis patients and healthy adult controls: implications for understanding the pathogenesis of multiple sclerosis and consolidat. J Neurol Sci. 2012;313(1-2):99-109. doi:10.1016/j.jns.2011.09.015.
3. Cherubini A, Spoletini I, Péran P, et al. A multimodal MRI investigation of the subventricular zone in mild cognitive impairment and Alzheimer’s disease patients. Neurosci Lett. 2010;469(2):214-218. doi:10.1016/j.neulet.2009.11.077.
4. Di Paola M, Luders E, Cherubini A, et al. Multimodal MRI analysis of the corpus callosum reveals white matter differences in presymptomatic and early Huntington’s disease. Cereb Cortex. 2012;22(12):2858-2866. doi:10.1093/cercor/bhr360.
5. Vasung L, Fischi-Gomez E, Hüppi PS. Multimodality evaluation of the pediatric brain: DTI and its competitors. Pediatr Radiol. 2013;43(1):60-68. doi:10.1007/s00247-012-2515-y.
6. Le Bihan D. Looking into the functional architecture of the brain with diffusion MRI. Nat Rev Neurosci. 2003;4(6):469-480. doi:10.1038/nrn1119.
7. Song S-K, Sun S-W, Ramsbottom MJ, Chang C, Russell J, Cross AH. Dysmyelination Revealed through MRI as Increased Radial (but Unchanged Axial) Diffusion of Water. Neuroimage. 2002;17(3):1429-1436. doi:10.1006/nimg.2002.1267.
8. Neema M, Stankiewicz J, Arora A, et al. T1- and T2-Based MRI Measures of Diffuse Gray Matter and White Matter Damage in Patients with Multiple Sclerosis. J Neuroimaging. 2007;17(s1):16S-21S. doi:10.1111/j.1552-6569.2007.00131.x.
9. Harkins KD, Xu J, Dula AN, et al. The microstructural correlates of t 1 in white matter. Magn Reson Med. 2015;0(February):n/a-n/a. doi:10.1002/mrm.25709.
10. Lutti A, Dick F, Sereno MI, Weiskopf N. Using high-resolution quantitative mapping of R1 as an index of cortical myelination. Neuroimage. 2014;93:176-188. doi:10.1016/j.neuroimage.2013.06.005.
11. Cohen-Adad J. What can we learn from T2* maps of the cortex? Neuroimage. 2014;93:189-200. doi:10.1016/j.neuroimage.2013.01.023.
12. Mangeat G, Govindarajan ST, Mainero C, Cohen-Adad J. Multivariate combination of magnetization transfer, T2* and B0 orientation to study the myelo-architecture of the in vivo human cortex. Neuroimage. 2015;119:89-102. doi:http://dx.doi.org/10.1016/j.neuroimage.2015.06.033.
13. Jutras J-D, Wachowicz K, Gilbert G, De Zanche N. SNR Efficiency of Combined Bipolar Gradient Echoes: Comparison of 3D FLASH, MPRAGE, and Multi-Parameter Mapping with VFA-FLASH and MP2RAGE. Magn Reson Med. 2016;In Press(January). doi:10.1002/mrm.26306.
14. Jensen JH, Helpern JA. MRI quantification of non-Gaussian water diffusion by kurtosis analysis. NMR Biomed. 2010;23(7):698-710. doi:10.1002/nbm.1518.
15. Zhang H, Schneider T, Wheeler-Kingshott CA, Alexander DC. NODDI: practical in vivo neurite orientation dispersion and density imaging of the human brain. Neuroimage. 2012;61(4):1000-1016. doi:10.1016/j.neuroimage.2012.03.072.
16. Kaden E, Kelm ND, Carson RP, Does MD, Alexander DC. Multi-compartment microscopic diffusion imaging. Neuroimage. 2016;139:346-359. doi:10.1016/j.neuroimage.2016.06.002.
17. Glasser MF, Van Essen DC. Mapping human cortical areas in vivo based on myelin content as revealed by T1- and T2-weighted MRI. J Neurosci. 2011;31(32):11597-11616. doi:10.1523/JNEUROSCI.2180-11.2011.
Figures