2403
BrainVis: A cloud-connected 3D exploration and visualization tool for multi-modal neuroimaging data1Mint Labs, Barcelona, Spain
Synopsis
Diffusion MRI tractography is central to the study of complex brain circuitry since it is the only non-invasive technique capable of measuring the brain’s wiring. Data visualization gets increasingly complex as tractography is combined with morphometric results in structural connectomes, and even more so when coupled with functional information from fMRI techniques. Such complex imagery, aggregating multi-modal information, 3D meshes, and statistical maps is often visualized using research tools with complicated user interfaces (UIs) and cluttered visualizations.
BrainVis is a sophisticated, free 3D neuroimaging visualization tool with a simple UI aimed for effective exploration of neuroimaging data towards demonstrating neurobiological findings.
Purpose
Data visualization is an important aspect of neuroimaging: paramount for correct and intuitive interpretation of results and key for neurosurgical planning. However, there is a lack of standardization in the current viewers, with various file types and data structures. Many viewers lack truly interactive 3D view and consistent or specialized development support.
We developed BrainVis1 to alleviate these problems: it is a fully interactive 3D viewer, where multiple modalities can be shown simultaneously. Advanced tools are provided such as surface rendering and interactive exploration of tractography streamlines. Seamless integration with a cloud-system provides transparent fetching and processing of data. For user interface (UI) simplicity, it features adaptive menus that only show the options applicable to the current data. It can be coupled with Leap Motion2 hardware for intuitive touchless interaction.
Results
Neuroimaging Analysis
Various tools exist for computing different aspects of neuroimaging data, from structural morphometric maps (brain tissue segmentation, cortical volumes, cortical thickness), to structural connectivity (e.g., dMRI tractography), and structural connectomes or resting state functional connectomes. In parallel, we developed a cloud-based platform providing a standardized place for neuroimaging data management and image processing pipelines. All computations can be run in the cloud environment, and the generated result files are kept in a managed data warehouse. All files (input and output) can be retrieved through an application programming interface (API).
Desktop Application Implementation
BrainVis is a freely available desktop application developed to display the processed data in 3D for Windows, Linux and MacOS. With an active Internet connection, BrainVis can search and download the processed neuroimaging studies (e.g., brain tissue segmentation, tractography, structural connectomes) and visualize the respective data. Data files can also be downloaded from the cloud platform through the web browser. The cross-platform components for data handling and graphics are written in C# and Javascript within Unity3D engine.
Features and User Interface
BrainVis is seamlessly integrated with the cloud infrastructure. The user simply selects which analysis to download and visualize, and all necessary files are automatically retrieved without manual selection of the different files and parameters. BrainVis has three main components:
1. Adaptive options menu: The available options are automatically enabled if the corresponding data is available. For example, the 3D region-of-interest (ROI) selection for tractography is only visible if tractography maps are loaded. This way a simple and sleek UI is ensured.
2. Interactive 3D view: The application is focused on maximizing the 3D view and exploration. It allows multi-modal visualization of structural data, as well as overlays of segmentation analysis, lesion masks, tumor masks, FA maps, and tractography maps. It also provides 3D surface mesh generation for cortical region visualization and advanced fiber selection options.
3. 2D slices view: also interactive allowing users to click on a plane and the respective 2D position sets the 3D cursor in the view.
Multi-modal data is seamlessly enabled, the cursor position is checked against cortical label map, and the corresponding brain region is highlighted and thus can be used to select fiber-tracts.
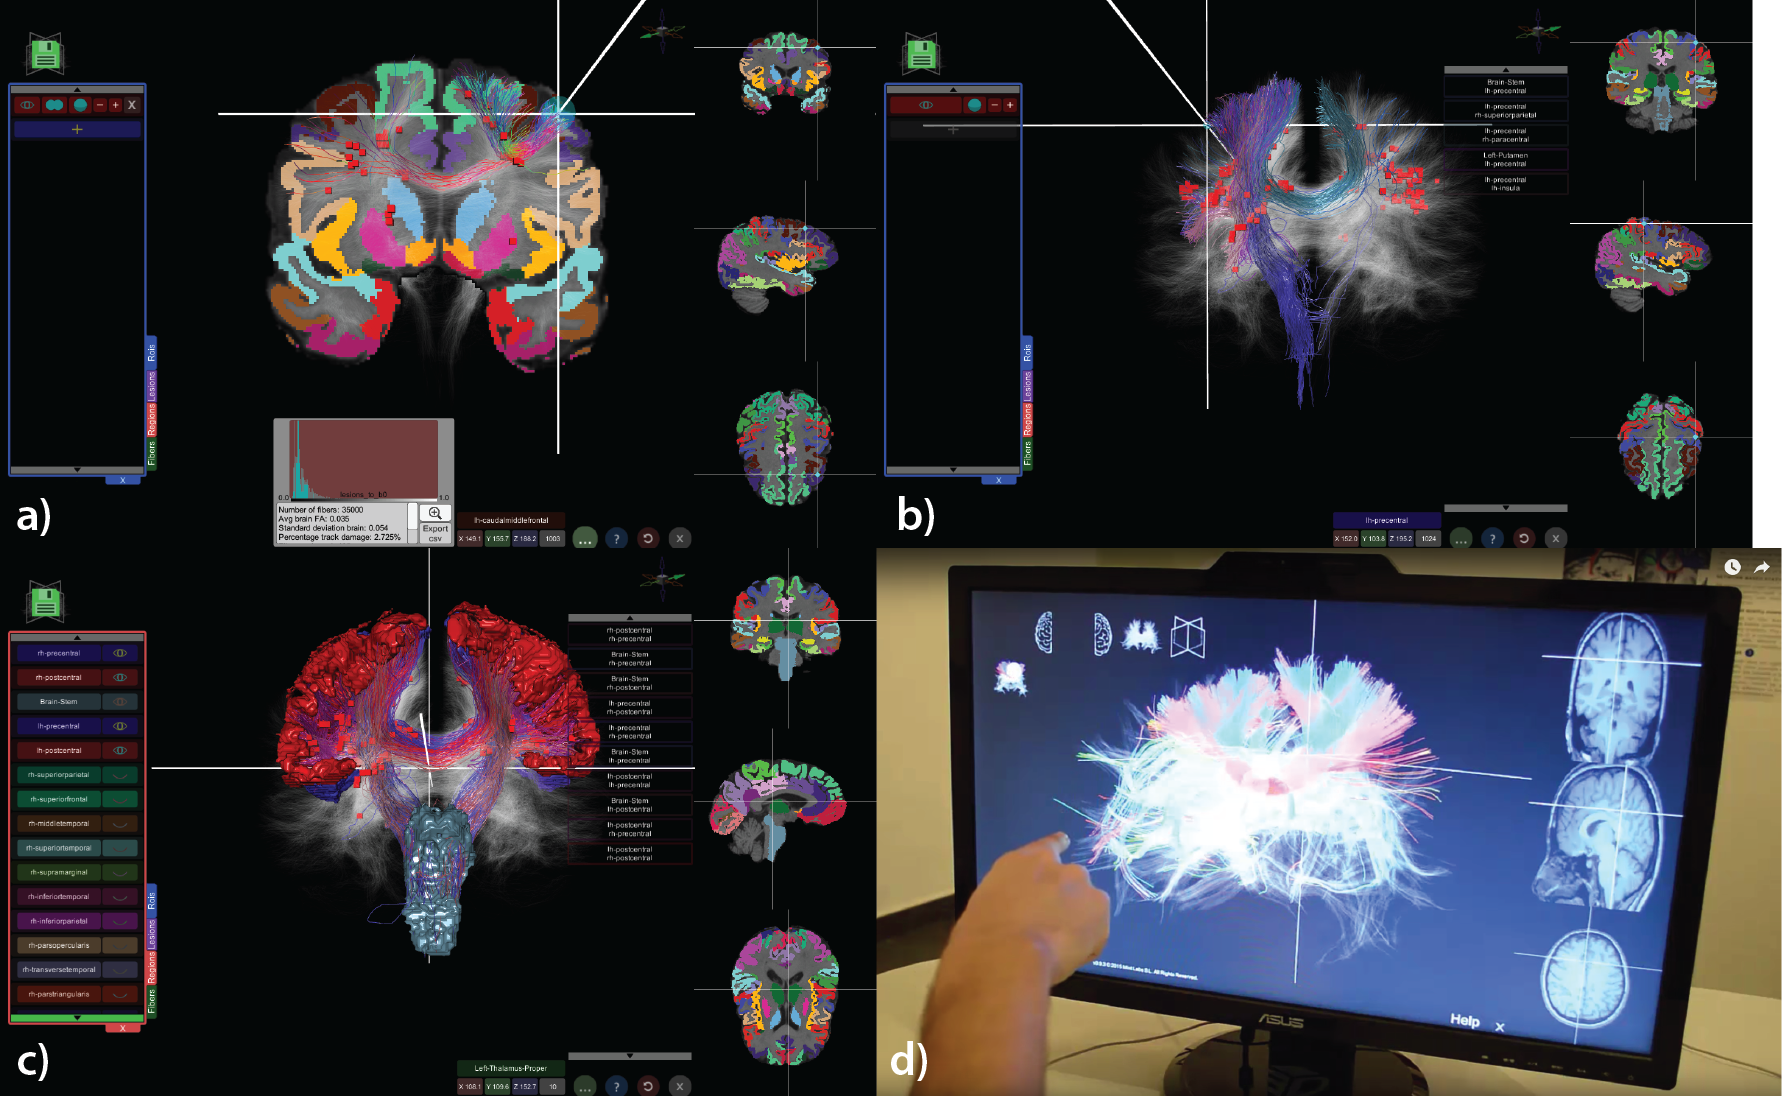
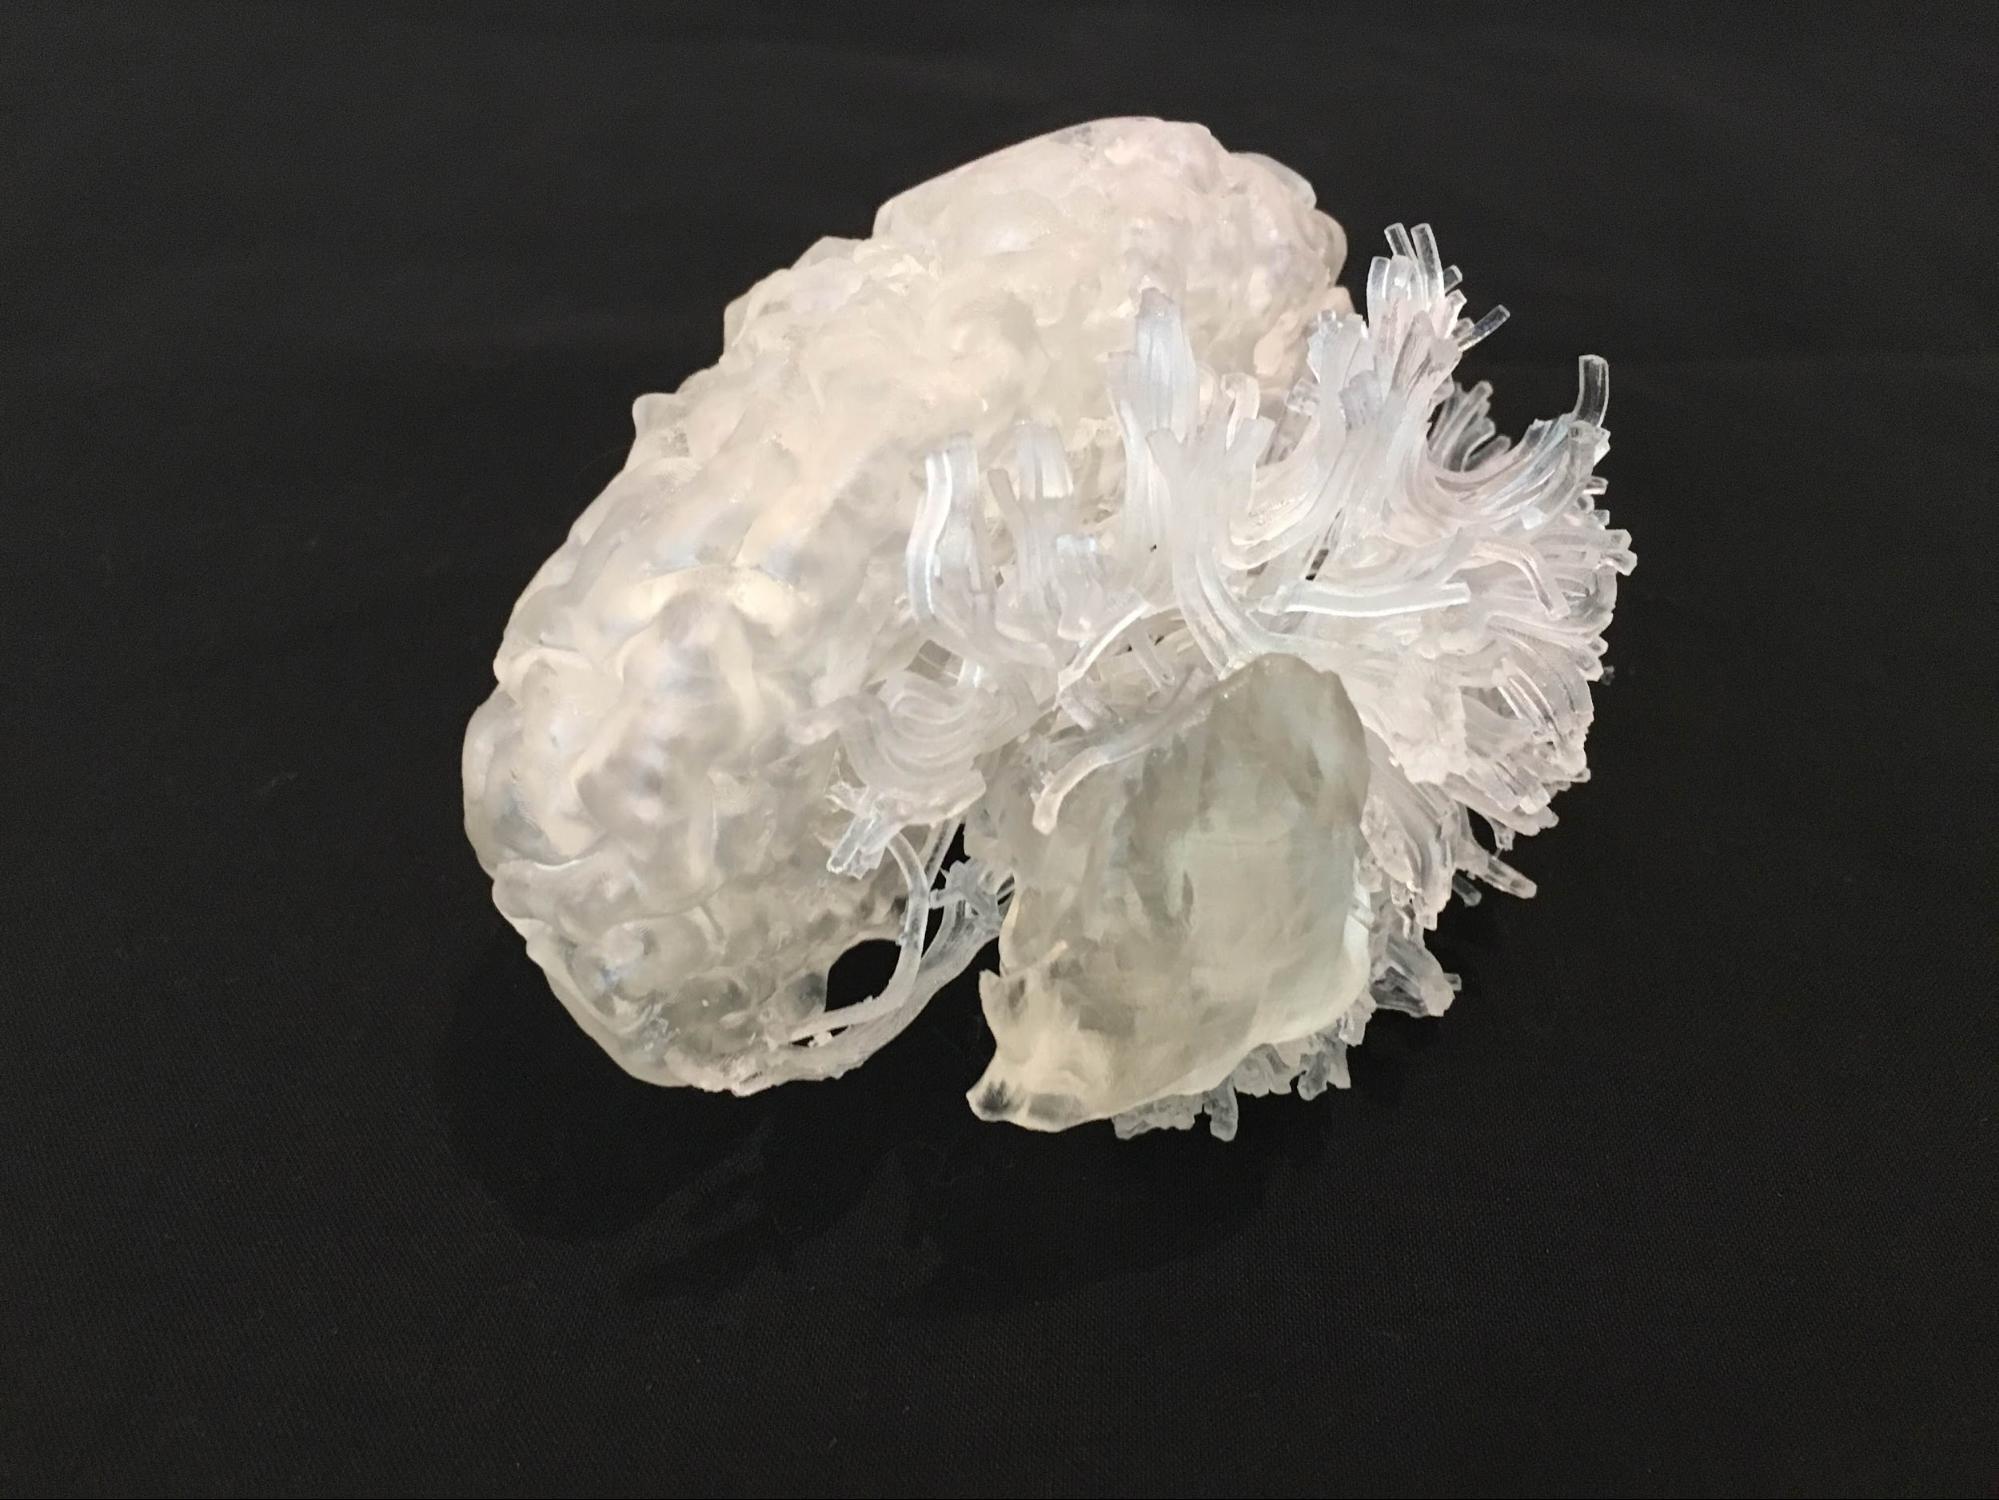
There are several options for Interactive Fiber Selection: 2D plane fiber selection; Spherical ROI with AND/OR filtering options (Figure 1a); Highlighting bundles in ROI (Figure 1b); Filtering by cortical regions (Figure 1c). Exporting fiber selections to external tools and applications (e.g., export to .stl format for 3D printing as in Figure 2).
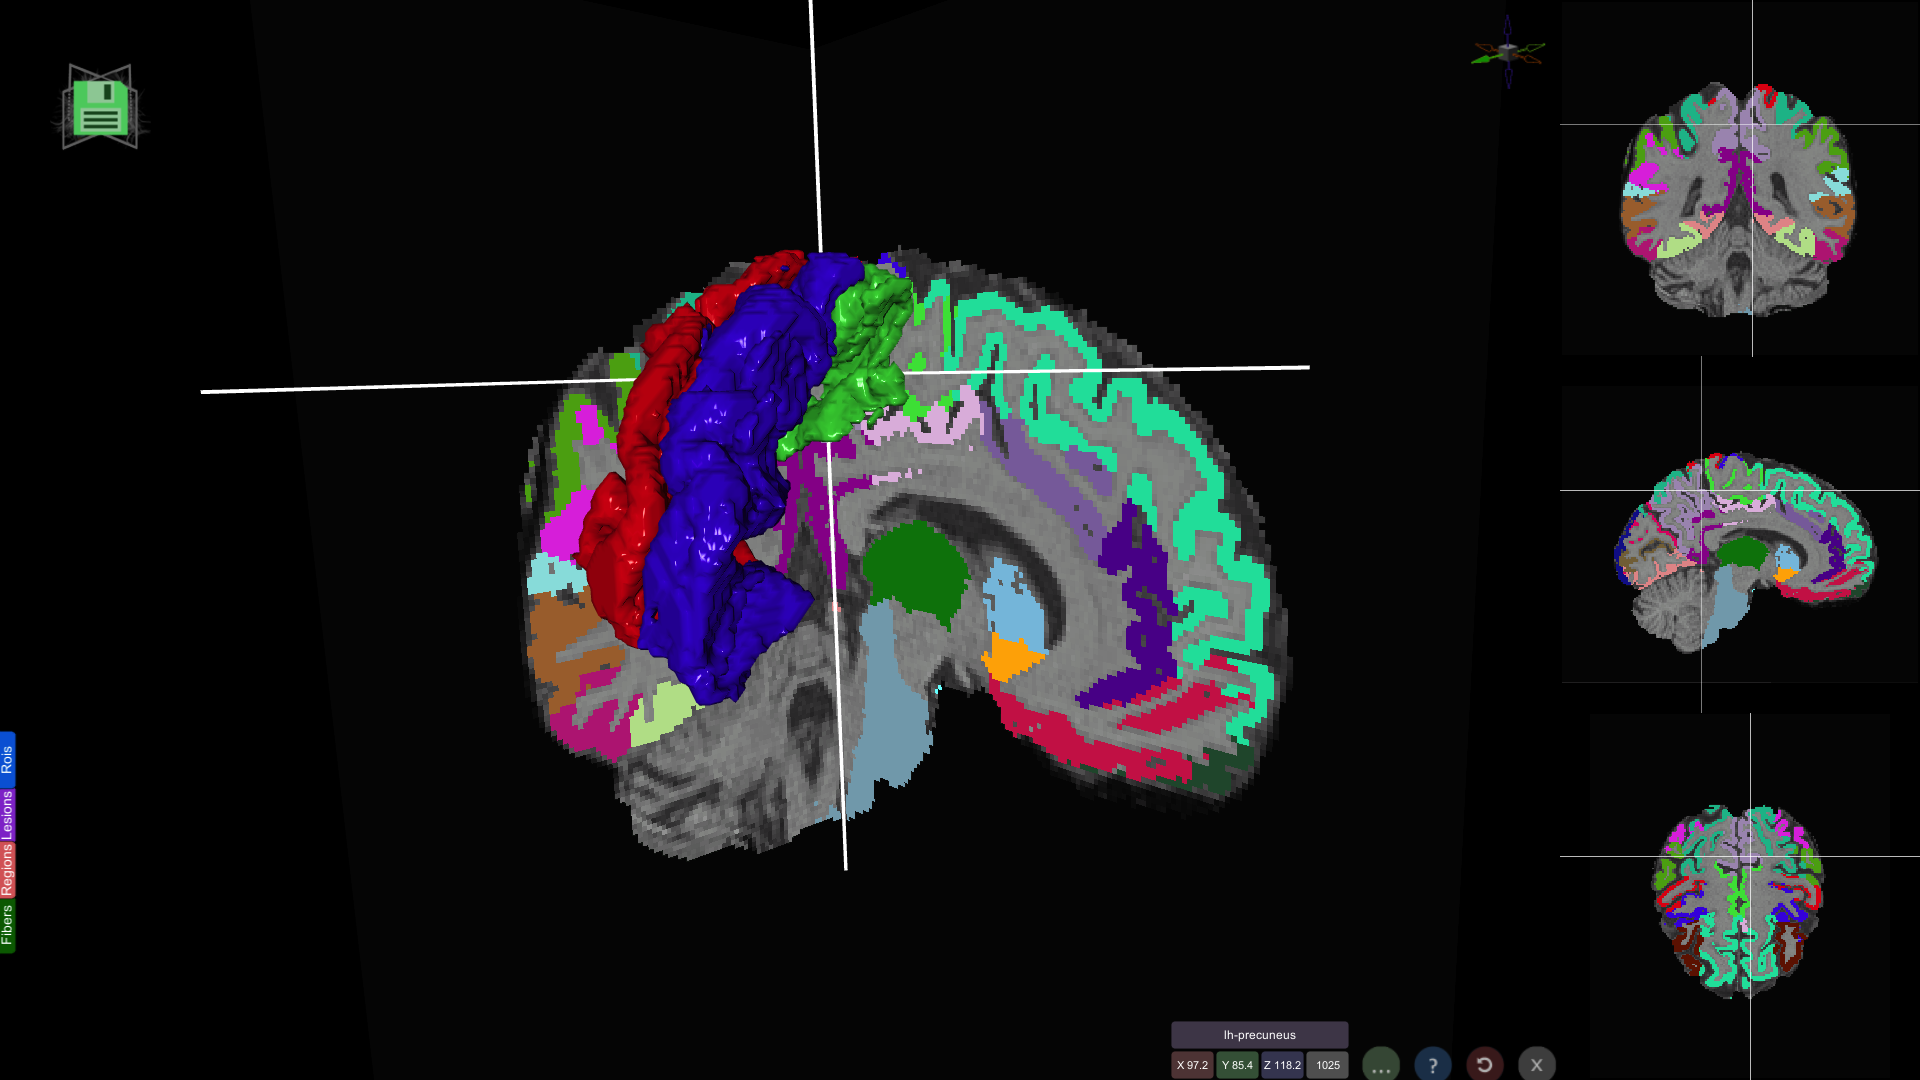
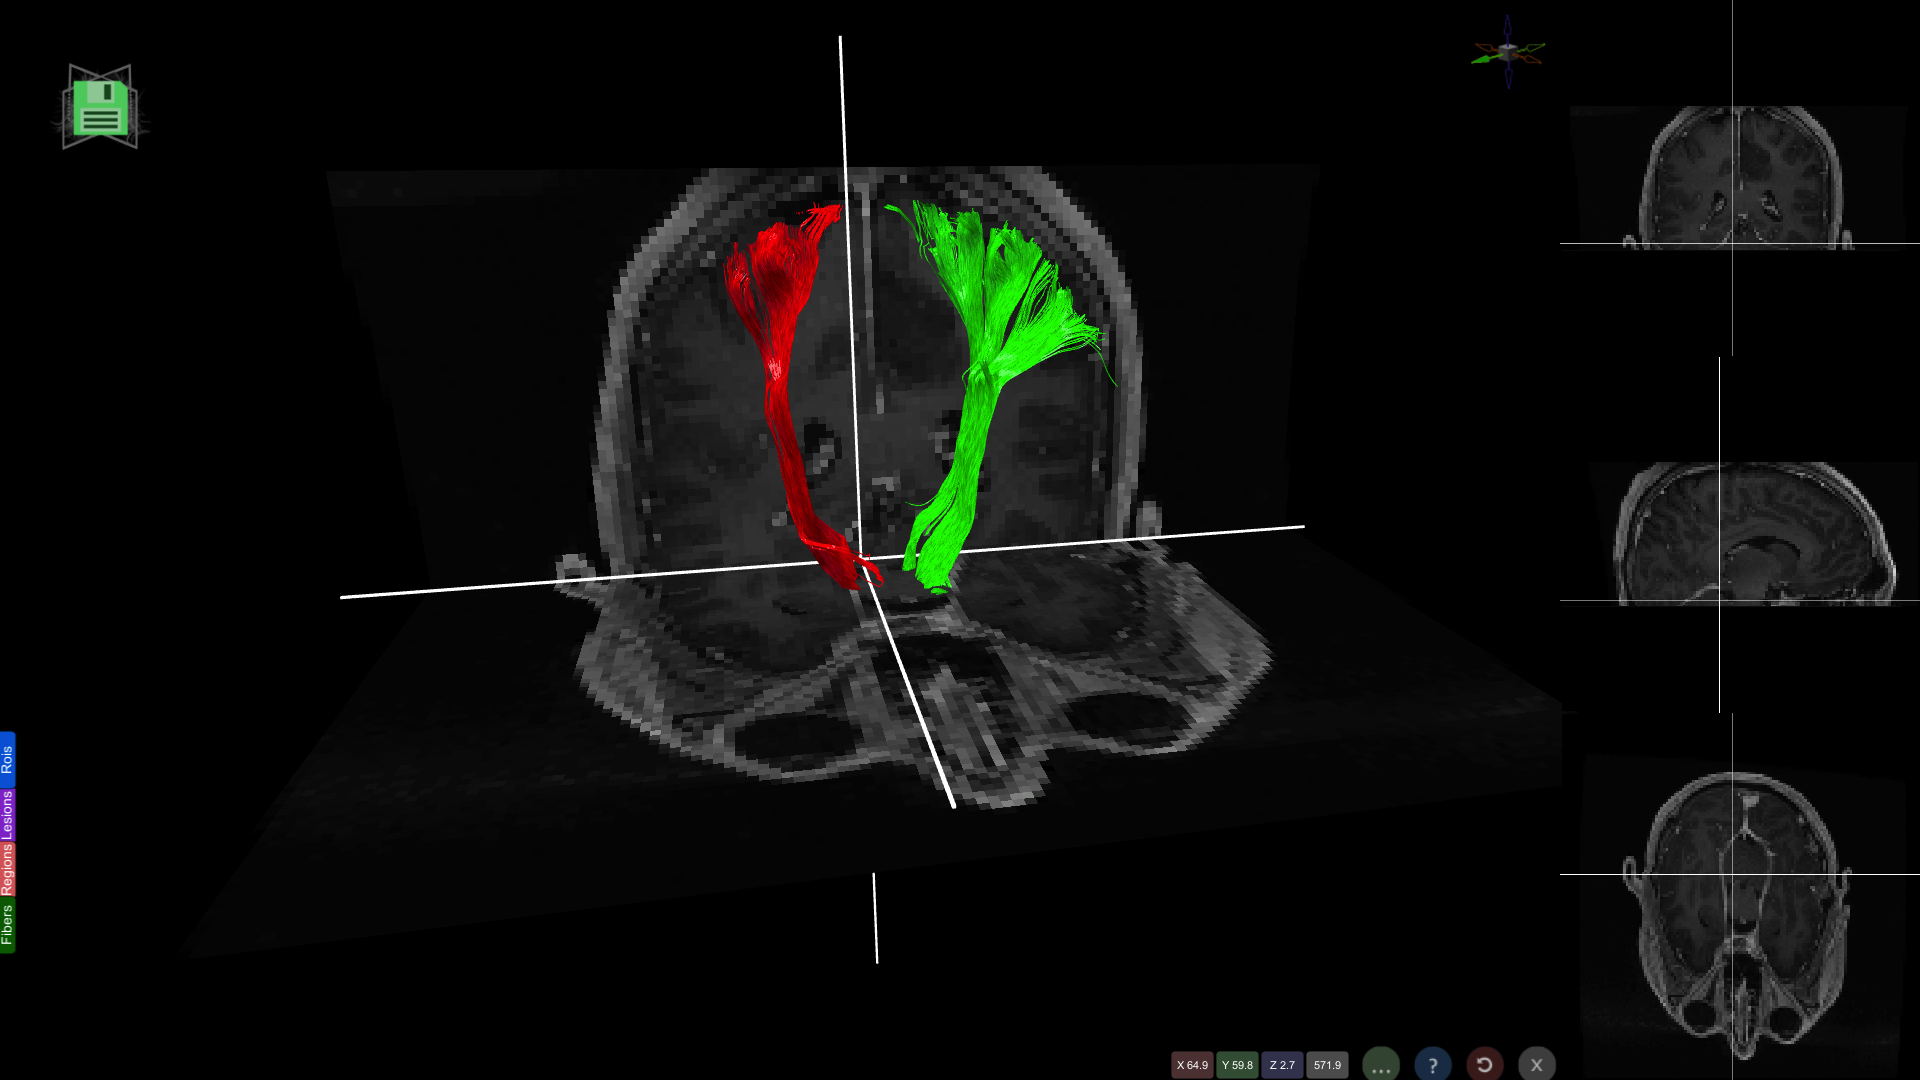
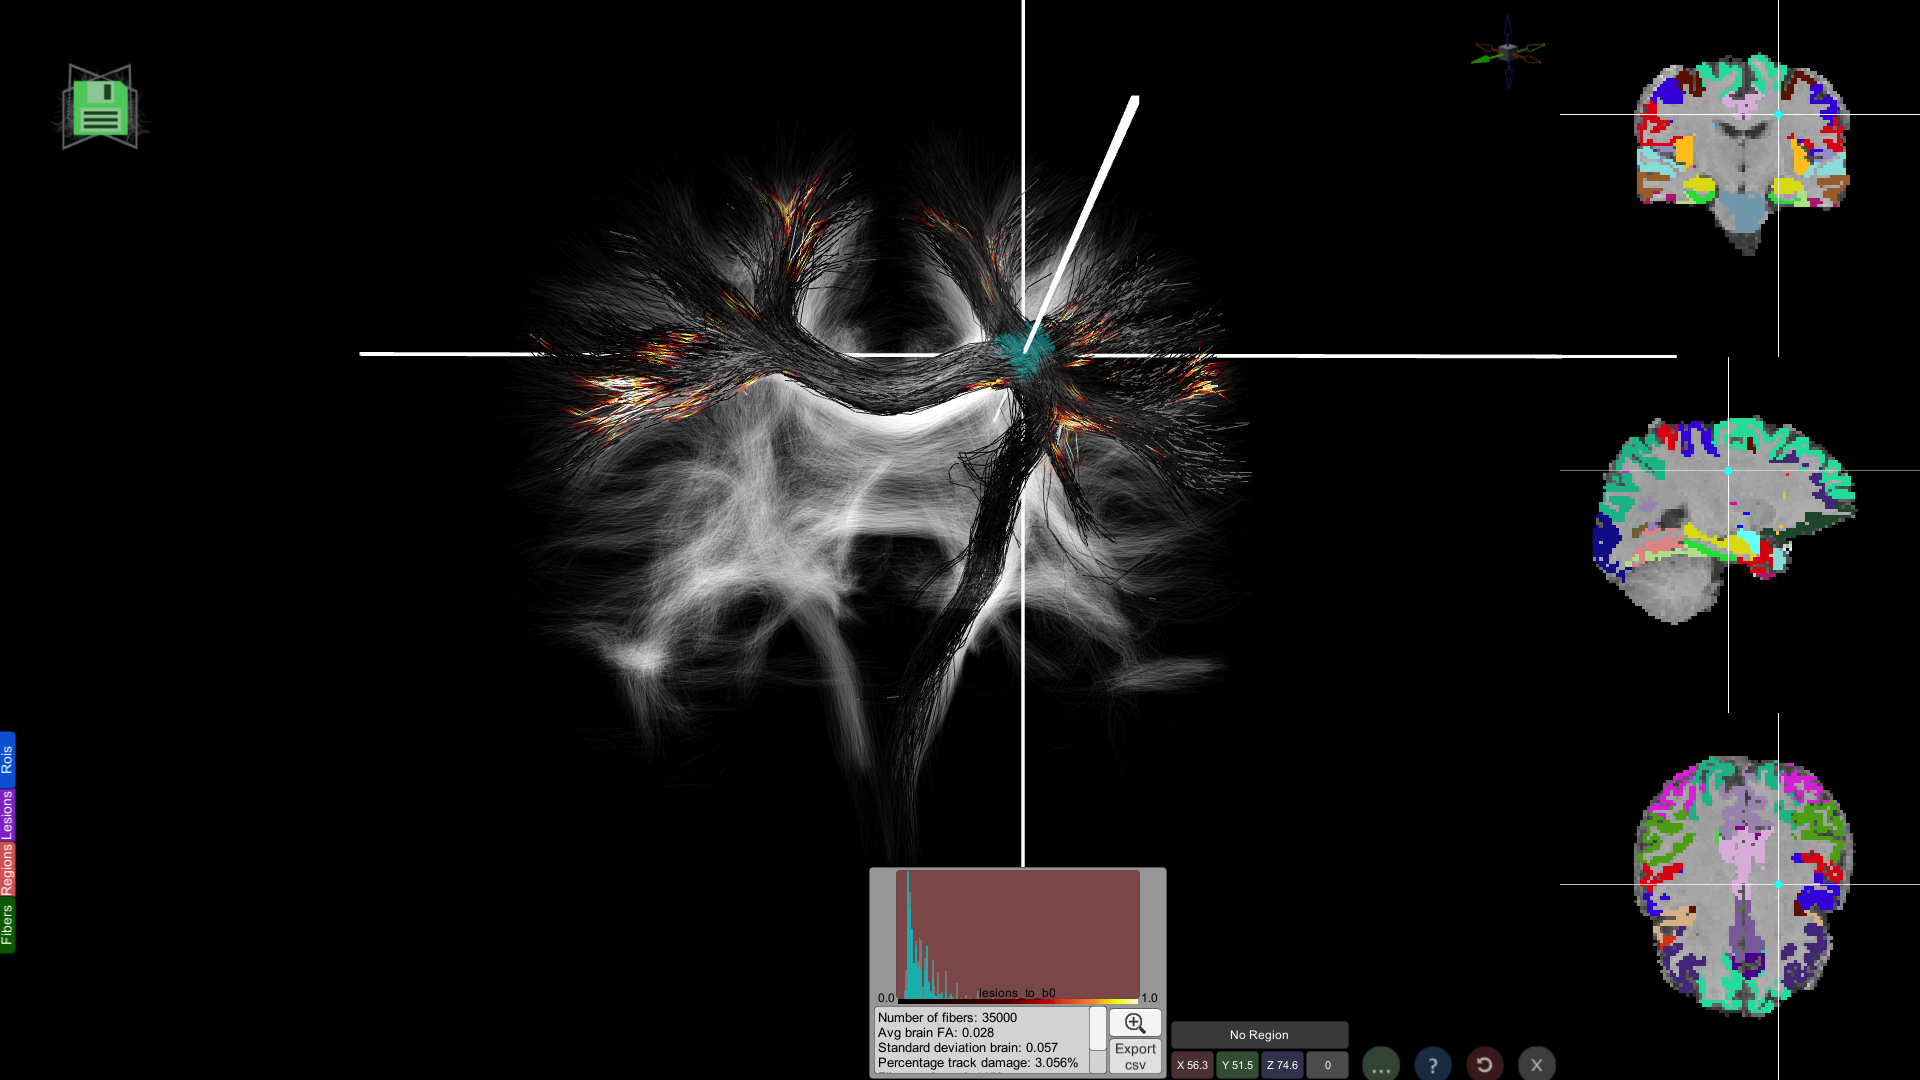
All these capabilities make BrainVis a flexible tool suited for multiple scenarios. Several use-case examples follow: Figure 3 illustrates the visualization of morphometric analysis pipeline applied to a healthy subject; Figure 4 shows a tumor case where the fibers are automatically generated by seeding from an fMRI motor task and in Figure 5 the lesions of a patient with multiple sclerosis have been projected onto tractography streamlines helping elucidate what connections might be more severely affected by the disease.
Touchless interaction
In order to provide a better solution for the physicians and specifically neurosurgeons for the data visualization, we offer a fully touchless interface (Figure 1d). We use Leap Motion tracking device that detects and tracks hands, fingers, and finger-like tools. This touchless interface provides an intuitive and natural way to explore 3D brain maps, especially towards precise moving of the ROI in 3D space, and has a direct application potential in neurosurgery.
Discussion
BrainVis offers a well-rounded option for various neuroimaging visualization needs. It offers convenient access to the detailed 3D-neuroimaging data and the ability to perform data-mining and visualization of neuroanatomy in an integrated manner. This should greatly increase the power and benefit of neuroimaging informatics for the researchers in this field.Acknowledgements
No acknowledgement found.References
1. http://www.mint-labs.com/latest
2. https://www.leapmotion.com
Figures