2402
In-vivo 3D T1rho mapping of the whole Brain: Multi-component Analysis1Bernard and Irene Schwartz Center for Biomedical Imaging, Department of Radiology, New York University Langone Medical Center, New York, NY, United States
Synopsis
In this study, we demonstrate the in vivo feasibility of multicomponent 3D-T1rho relaxation mapping of whole brain using 3T MRI in five healthy subjects. Our preliminary results suggest that the bi-exponential model better represents the relaxation behavior in white matter and has potential to differentiate between different water compartments associated with myelin bound water (short component) and intra-extracellular water (long component).
INTRODUCTION
The human brain at a cellular level consists of multiple macromolecular environments that changes during a disease process. In brain tissue, T1r mapping holds particular promise because of its quantitative nature, and sensitivity to chemical exchange and pH (1). Previous work has looked into using T2 (2) and T1ρ (3) relaxation mapping using mono-exponential decay model in the brain. The purpose of this work is to evaluate the in-vivo feasibility of biexponential analysis of T1ρ relaxation times of whole brain using 3T MRI in clinically feasible scan times.METHODS
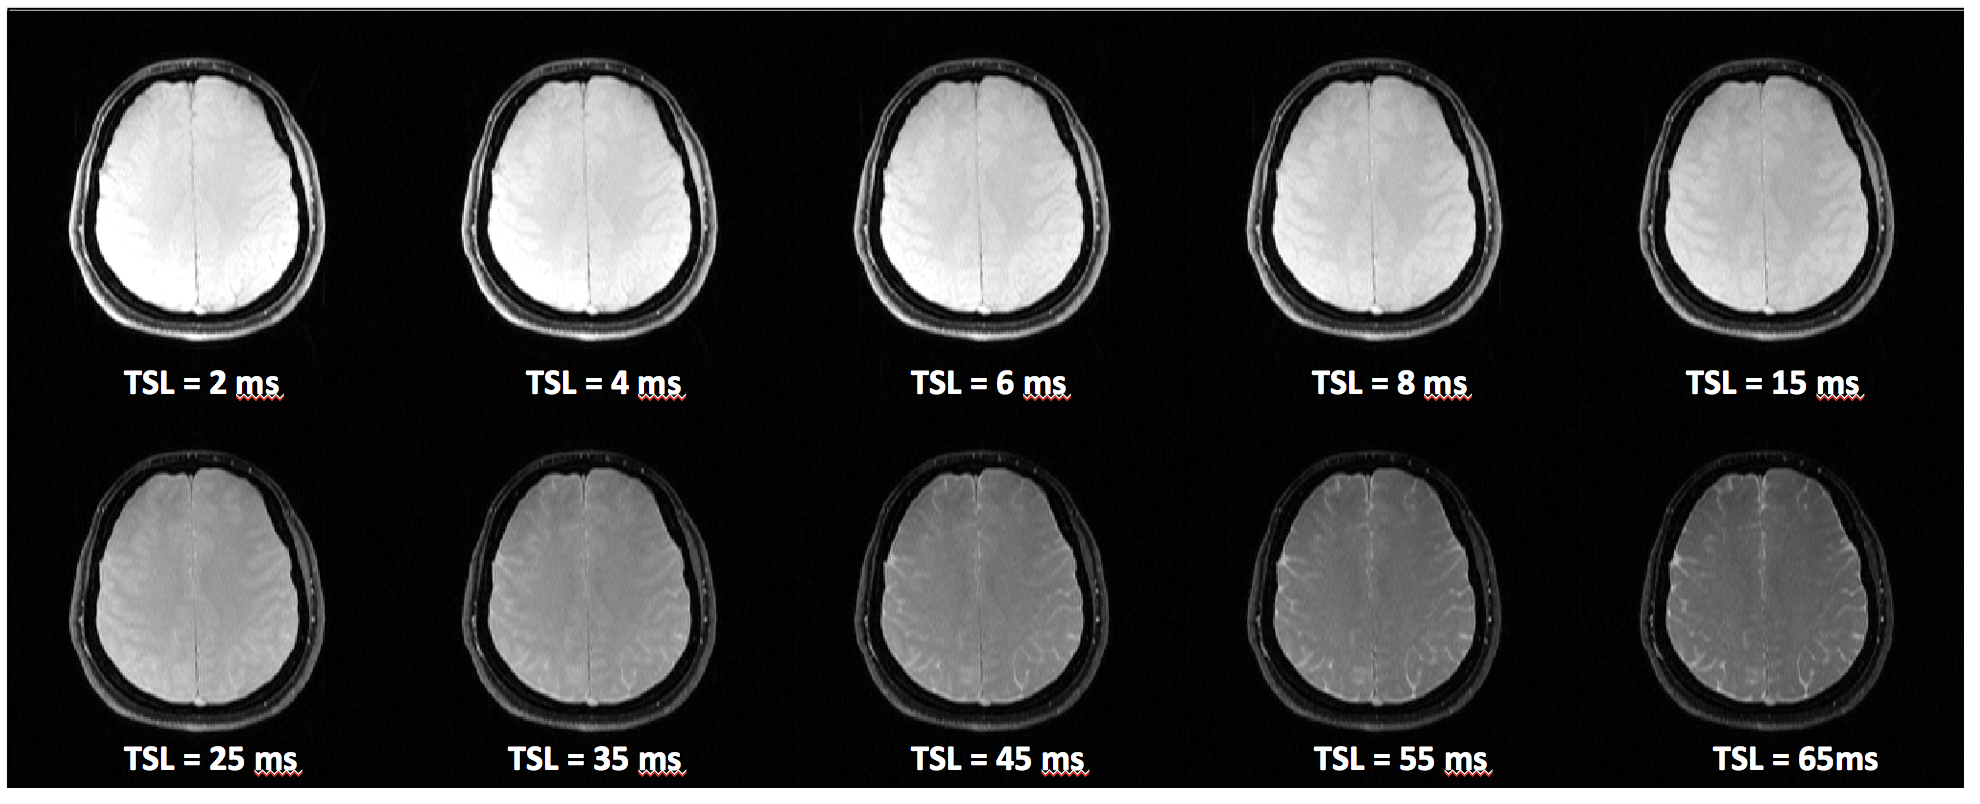
The study was approved by the Institutional Review Board (IRB). Five healthy human volunteers (3-Female/2 Male)(mean age=26.6 ± 4.1) were recruited following written consent. All scans were performed on a clinical 3T MR scanner (Prisma, Siemens Healthcare, Germany), with a 32 channel head coil. A 3D Cartesian turbo-Flash sequence was customized to enable T1ρ imaging with varying spin-lock times. To compensate the effect of B0 and B1 inhomogeneities, the spin-lock pulse was divided into four segments with alternative phase and a refocusing pulse was applied between two pairs. 3D-T1ρ weighted images were acquired at 10 different TSLs: 2/4/6/8/15/25/35/45/55/65ms (Fig.1). For each spin lock duration (TSL), a 3D dataset was acquired with 0.9x0.9x2 mm3 resolution. A GRAPPA acceleration factor of 2 was used, with TR=1500ms, TE=4ms, flip angle=8°, matrix size=256x128x64, spin lock frequency = 500 Hz, field of view (FOV)=240mm2, with a total acquisition time of 18 minutes.
The T1ρ mapping was done offline using custom MATLAB (MathWorks, Natick, MA) scripts. The T1ρ mapping was performed by fitting process on a pixel-by-pixel basis. The mono-exponential relaxation times were fitted according to:
y=Ame(-t/T)+y0,
where Am is the amplitude of the exponential term, t is the spin lock duration, TSL, and y0 is a constant that is set to be equal to the mean noise value. A bi-exponential fit of the same data was performed using: y=Ase(-t/Ts)+Ale(-t/Tl)+y0,
where As and Al are amplitude terms for the short and long components, and Ts and Tl are the short and long relaxation times, respectively. From As and Al, the fractional contributions of the short and long components were also calculated. To analyze the source of the multicomponent decay terms, the brain was segmented using Statistical Parametric Mapping, (SPM12) to generate masks for white and gray matter regions, and were applied to the T1ρ maps.
RESULTS
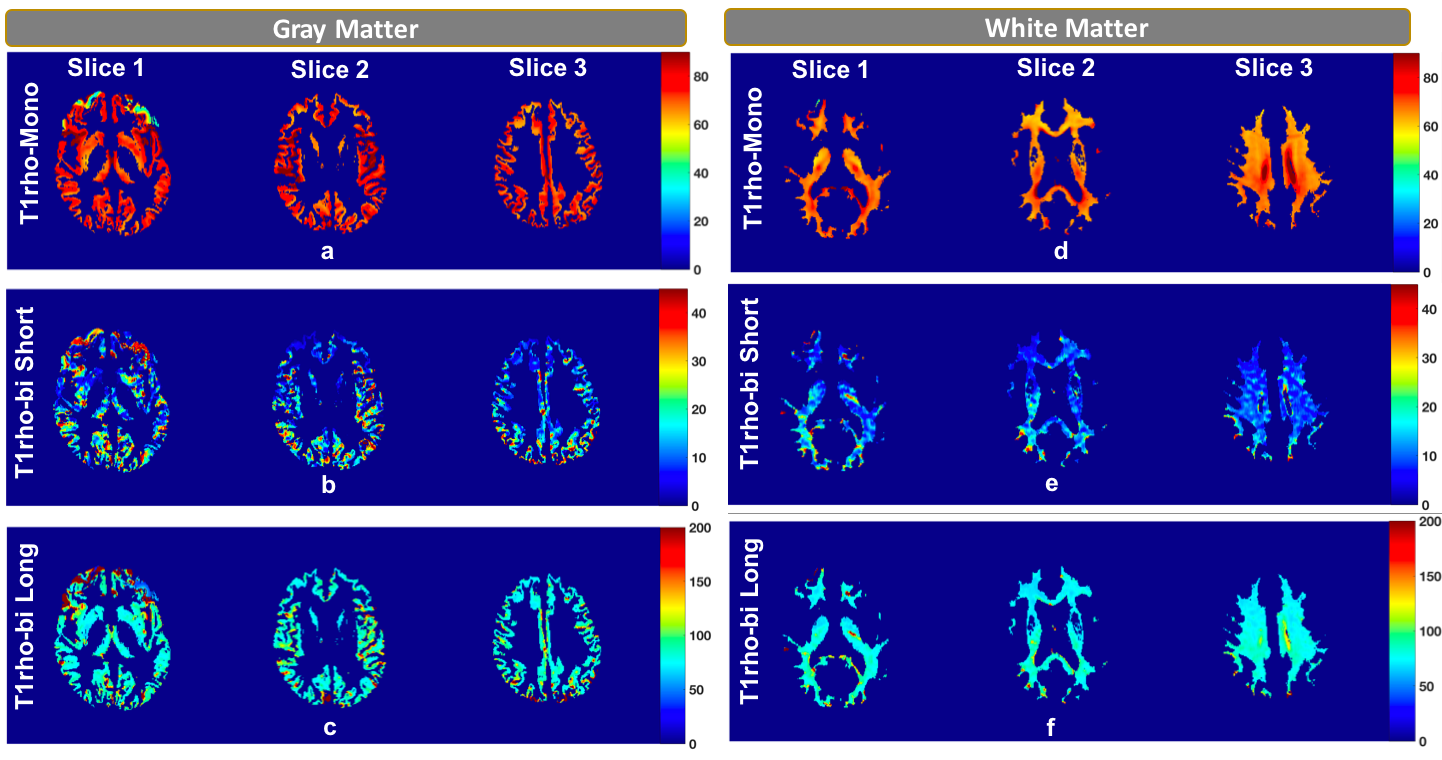
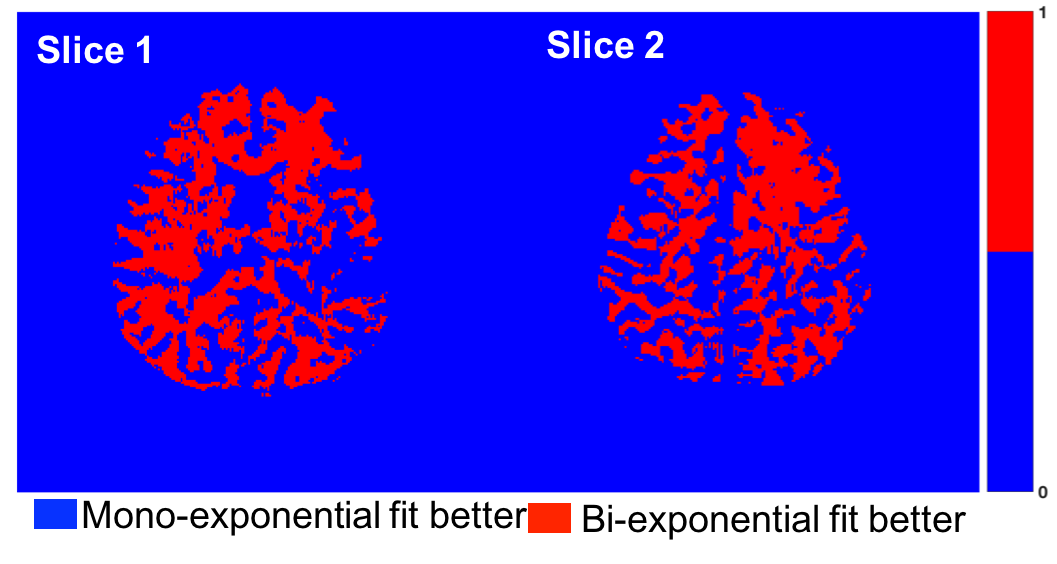
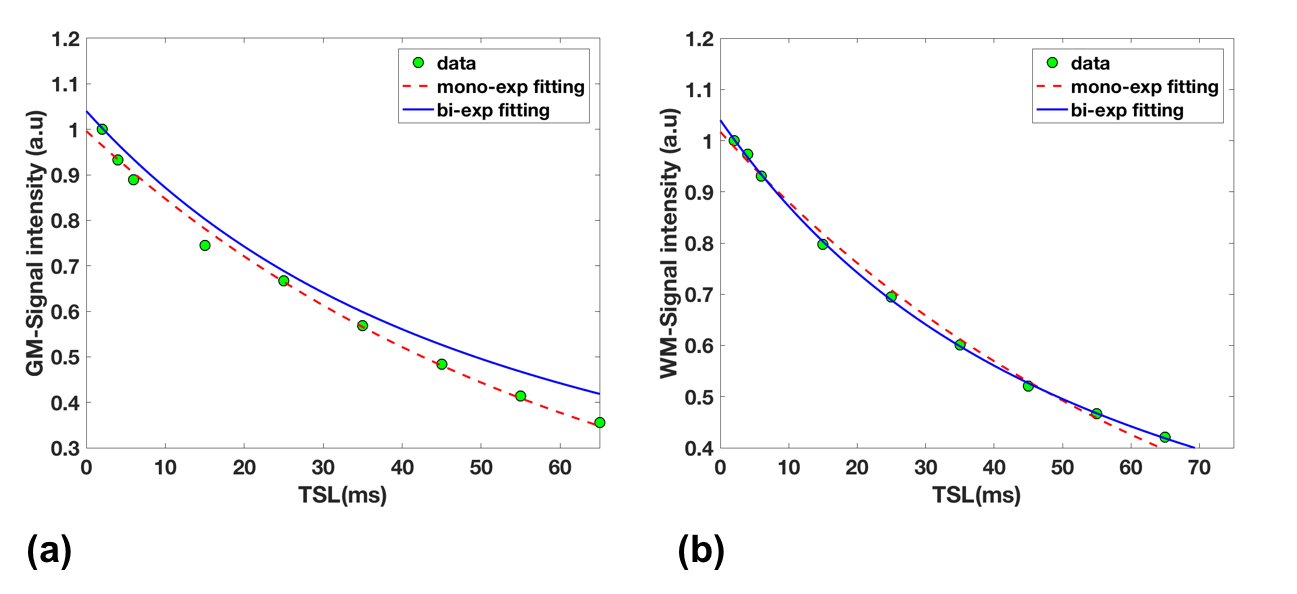
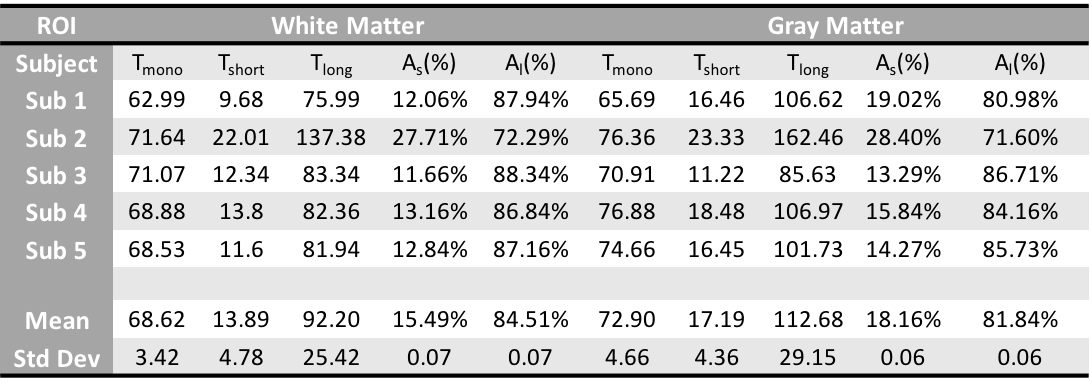
Figure 2 shows T1ρ maps for 3 representative slices in the gray matter (a-c), and in the white matter (d-f). Mono-exponential decay maps (a,d), and bi-exponential decay maps with short (b,e) and long components (c,f) in the gray and white matter regions are shown in each row. The mean mono-exponential relaxation rate in the white matter was 68.62 ± 3.42ms. The mean bi-exponential short component was 13.89 ± 4.78ms, while the mean long component was 92.20 ± 25.42ms. Corresponding gray matter values are as shown in Table 1.) Figure 3 shows a binary map made from the least error for each pixel between the mono-exponential fit and bi-exponential fit. Figure 4 shows the mono and bi-exponential fits in the gray and white matter regions of the brain. Data from Figure 3 and 4 suggest that a bi-exponential fit is better in the white matter, reflecting the multi-compartment relaxation. The gray matter of the brain, however, primarily exhibited mono-exponential relaxation processes. No significant statistical differences between in T1ρ were noted between GM and WM, at a significance threshold of P < 0.05.DISCUSSION AND CONCLUSION
Preliminary data suggests that we can use T1ρ mapping to detect multi-compartment relaxation that may occur in the brain . The long relaxation component mainly corresponds to the intra and extracellular water while the short component is thought to attributed to water trapped between myelin bilayers. The multicomponent T1rho mapping of whole has potential for non-invasive assessment of myelin water fraction in multiple sclerosis and other neuro-diseases.Acknowledgements
This study was supported by NIH grants R01-AR060238, R01 AR067156, and R01 AR068966, and was performed under the rubric of the Center of Advanced Imaging Innovation and Research (CAI2R), a NIBIB Biomedical Technology Resource Center (NIH P41 EB017183).References
1. Kopple KD, Wang YS, Cheng AG, Bhandary KK. Conformations of cyclic octapeptides. 5. Crystal structure of cyclo (Cys-Gly-Pro-Phe) 2 and rotating frame relaxation (T1. rho.) NMR studies of internal mobil- ity in cyclic octapeptides. J Am Chem Soc 1988;110:4168–4176.
2. Vasilescu V, Katona E, Simplaceanu V, Demco D. Water compart- ments in the myelinated nerve. III. Pulsed NMR results. Experientia 1978;34:1443–1444.
3. Whittall KP, MacKay AL, Graeb DA, Nugent RA, Li DK, Paty DW. In vivo measurement of T2 distributions and water contents in normal human brain. Magn Reson Med. 1997 Jan;37(1):34-43.
4. Mitrea BG, Krafft AJ, Song R, Loeffler RB, Hillenbrand CM. Paired self-compensated spin-lock preparation for improved T1r quantification. Journal of Magnetic Resonance 2016;268:49-57.
Figures