2397
Diffusion Tensor imaging assessment for the spinal cord injury using 9.4 Tesla1Centre for Advanced Imaging, The University of Queensland, Brisbane, Australia, 2Radiology department, College of applied medical sciences, Najran University, Najran, Saudi Arabia, 3Radiology Department, King Fahad Medical City, Ministry of health, Riyadh, Saudi Arabia, 4Radiology Department, King Saud for Chest and Respiratory diseases, Ministry of health, Riyadh, Saudi Arabia, 5Laboratory for Neural Injury and Repair, School of Biomedical Science, University of QLD, Brisbane, Australia
Synopsis
Spinal cord injury (SCI) is a devastating damage that can result in permanent disabilities. MRI provides precise details of spinal cord post traumatic compression, which are useful for the diagnosis of the injury, surgical planning, post-surgical measurements and estimation long-term outcomes (Kramer, Freund, & Curt, 2014). In this study, 4 SCI mice were scanned at the 9.4T to acquire high-resolution images and diffusion tensor imaging at two b-values. The area of both white and gray matter were measured in several slices and compared to the pre-injury imaging. Spinal cord white and gray matters were also examined using DTI.
Introduction
MRI is able to assess the severity of the injury and identify many of the associated pathological changes, including atrophy, hemorrhage, edema, and cyst/syrinx formation (Bozzo, Marcoux, Radhakrishna, Pelletier, & Goulet, 2011). Advanced quantitative MR technique such as diffusion weighted imaging (DWI) has great potentials for research on SCI, providing functional and microstructural level assessment at the injury site and the surrounding area (Abdel-Aziz & Ciccarelli, 2014). Limited study investigated the mice SCI using ultra high field. The measurements of axial diffusivity in ventral white matter demonstrates differences between mild, moderate and severe SCI that also correlates histological findings (Loy et al., 2007). Kim et al. described spared normal ventro-lateral WM as hyperacute axial diffusion (3 hours post injury), with good correlation was found with histological analysis (Kim, Wu, Budde, Lee, & Song, 2011). Brennan et al 2013, reported that MD decreased after SCI but it returned to the control level at 30 days post injury. A significant decrease in FA and axial diffusivity has been also visualized at the injury site. Additionally, acute alterations in FA suggested to be primarily contributed by a reduction in axial diffusivity caused by axonal degeneration. With time, glial scarring and myelin loss led to significant increase in radial diffusivity, which results in further decrease in FA (Brennan, Cowin, Kurniawan, & Ruitenberg, 2013).
Aims
This study mainly aimed to assess the sensitivity of high-resolution anatomical MRI and DTI to study SCI in a mouse model of SCI, and to use the developed methods for the diagnosis and monitoring of SCI patients.Methods
Animal and SCI experiment: 4 (C57BL6/J) mice aged between 12-16 weeks, kept individually under standard conditions (12h bright-dark cycle, free access to food and water). Before surgical laminectomy and sever contusive SCI, mice were anesthetised using xylazine (10mg/kg i.p.) and zolazepam (50mg/kg i.p.). Dorsal incision was made along the lower thoracic Medline. After the impact, mice’s muscles and skin were sutured and post operation animal care included daily dose of gentamicin (1mg/kg) for the first five days and one dose of buprenorphine (0.05mg/kg) diluted in 1ml of Hartmann's solution. During the experiment, mice’s bladder was expressed twice a day. Mice locomotor recovery was performed using the Basso Mouse Scale (BMS) at multiple time-points post- SCI (Basso et al., 2006). Image acquisition: Scanner: 9.4T Bruker MRI, 4x4cm phase array receive coil of 4 coils combined with an 86mm transmit only quadrature coil. Mice were anesthetised (isoflurane and oxygen mixtures) and placed lying on the service coil tail supine position. High-resolution T1-images were acquired using FLASH sequence. SE-DWI was also acquired. T1 parameters: TR=400ms, TE=3.08ms, 2averages, resolution=0.078mm, scan time= 3.24minutes. DWI parameters: TR=700ms, TE= 19.48ms, 3averages, b-values= 1500, 650, scan time= 36.45 minutes. MRI data were collected in multiple time point including: pre-injury, 2 hours post injury, 1 day, 3 days, 7 days and 30 days post operation. Image processing: All ROI’s were drawn using ITK-snap. For the T1 images, the areas of white, gray matter (WM, GM) and whole cord were measured. DTI parameters were generated using MRTrix2 and the ROI’s were drawn accordingly.
Results and discussion
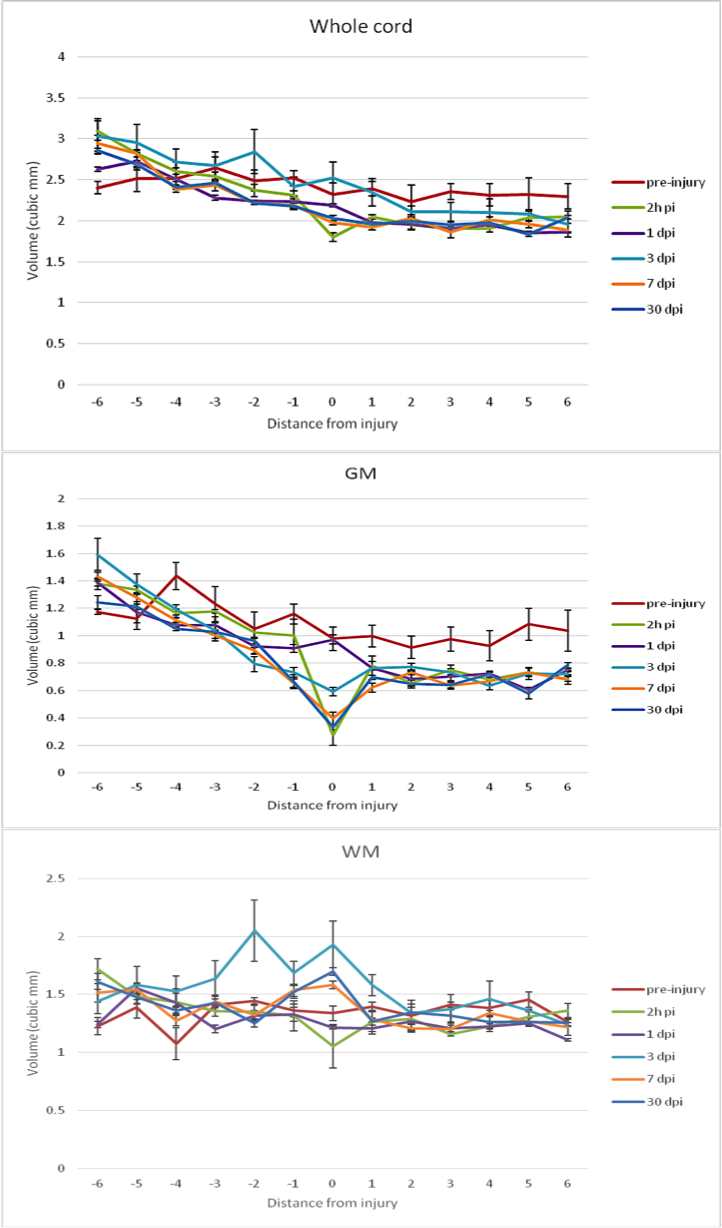
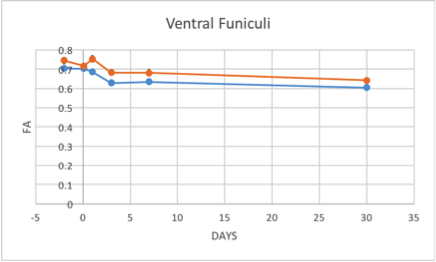
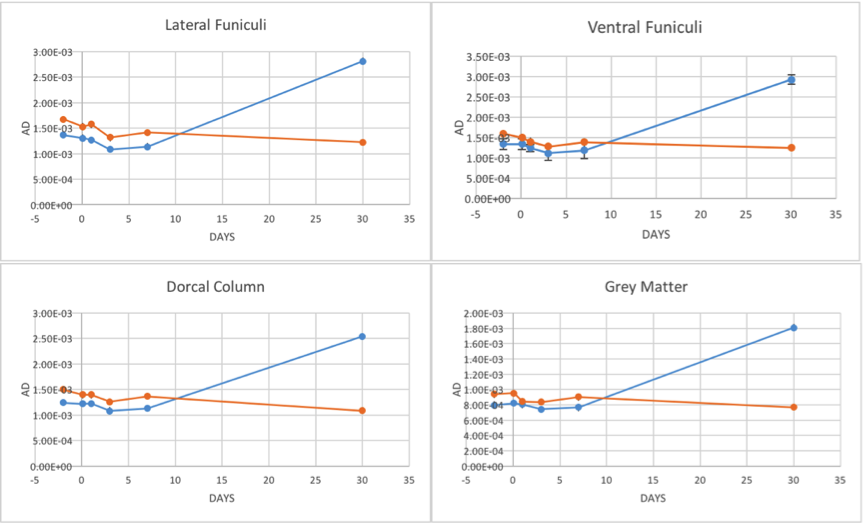
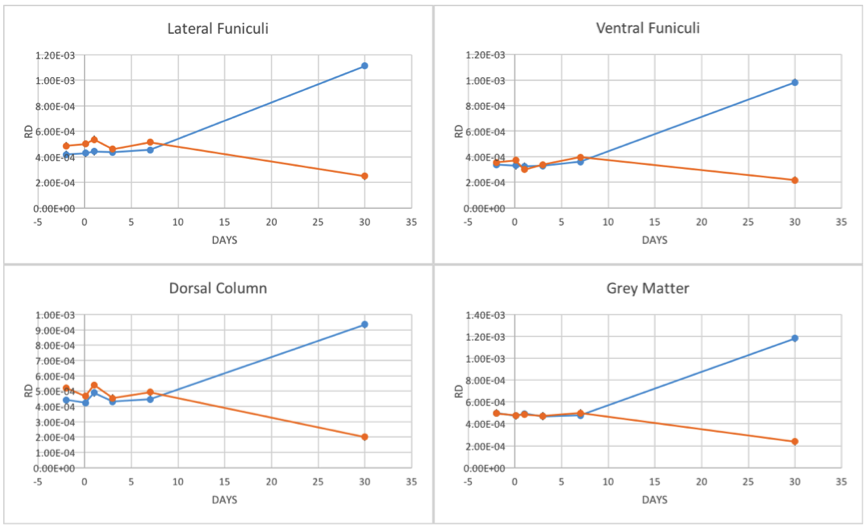
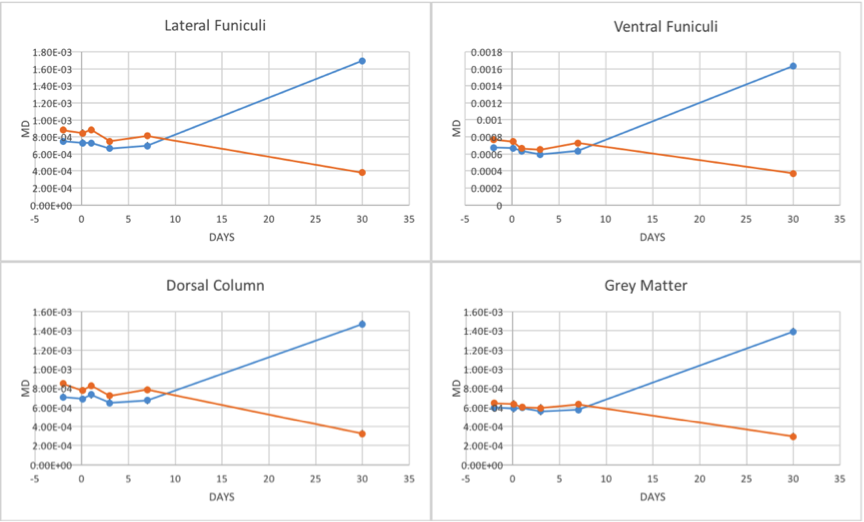
The structural MRI assessment showed shrinkage on the spinal cord structure post SCI compared to pre-SCI. At the chronic phase of the injury, tissue atrophy was noticed as a reduction in the spinal cord cross-sectional area after the injury (Figure1). The changes in the lesion core can be elaborated as an indication of general tissue atrophy as well as early cytotoxic oedema (Nelson, Poonawalla, Hou, Wolinsky & Narayana, 2008). FA showed a gradual decrease after SCI in LF segmentation of WM whereas VF and DC values were fluctuated as well as GM values (Figure2). In most WM segments AD were dropped until the 7th day post-SCI (Figure3). On the 30th day post-SCI b-650 curves all parameters were severely increased while b-1500 curves values were slightly decreased. RD values in all WM areas showed fluctuated curves after the injury but on the 30th day post-SCI RD showed a severe increase with b-650 and a decrease with b-1500 (Figure4). MD values were scattered in WM immediately after the spinal cord injury until the last day of the experiment where b-650 showed increases and b-1500 showed dramatical decline (Figure5). GM remained steady through pre- and post-SCI days but on the 30th day b-650 curve increased while b-1500 slightly dropped.
Acknowledgements
Research reported in this study is supported by SpinalCure Australia and the National Health and Medical Research Council of Australia (Project Grant 1060538).References
Abdel-Aziz, K., & Ciccarelli, O. (2014). Chapter 1.1 - Rationale for Quantitative MRI of the Human Spinal Cord and Clinical Applications. In J. C.-A. A. M. Wheeler-Kingshott (Ed.), Quantitative MRI of the Spinal Cord (pp. 3-21). San Diego: Academic Press. Bozzo, A., Marcoux, J., Radhakrishna, M., Pelletier, J., & Goulet, B. (2011). The role of magnetic resonance imaging in the management of acute spinal cord injury. Journal of neurotrauma, 28(8), 1401-1411. Brennan, F. H., Cowin, G. J., Kurniawan, N. D., & Ruitenberg, M. J. (2013). Longitudinal assessment of white matter pathology in the injured mouse spinal cord through ultra-high field (16.4 T) in vivo diffusion tensor imaging. Neuroimage, 82, 574-585. Kim, J. H., Wu, T. H., Budde, M. D., Lee, J. M., & Song, S. K. (2011). Noninvasive detection of brainstem and spinal cord axonal degeneration in an amyotrophic lateral sclerosis mouse model. NMR in Biomedicine, 24(2), 163-169. Loy, D. N., Kim, J. H., Xie, M., Schmidt, R. E., Trinkaus, K., & Song, S.-K. (2007). Diffusion tensor imaging predicts hyperacute spinal cord injury severity. Journal of neurotrauma, 24(6), 979-990.Figures