2395
Quantitative Susceptibility Mapping in Mild Traumatic Brain Injury1Department of Medical Imaging, Taipei Medical University Hospital, Taipei Medical University, Taipei, Taiwan, 2Translational Imaging Research Center, College of Medicine, Taipei Medical University, Taipei, Taiwan, 3School of Biomedical Engineering, College of Biomedical Engineering, Taipei Medical University, Taipei, Taiwan, 4Department of Radiology, School of Medicine, College of Medicine, Taipei Medical University, Taipei, Taiwan, 5Department of Biomedical Imaging and Radiological Sciences, National Yang-Ming University, Taipei, Taiwan, 6Department of Medical Research, Taipei Medical University Hospital, Taipei Medical University, Taipei, Taiwan
Synopsis
The present study investigated whether quantitative susceptibility mapping is able to identify particular characteristics of alterations in white matter and other brain regions in patients with mild traumatic brain injury (mTBI). Our study suggests that quantitative susceptibility mapping is capable of indicating iron and myelin disturbances in white matter and thalamus for patients with mTBI.
Purpose
Previous animal and human studies have demonstrated that white matter (WM) abnormalities are a common consequence of mTBI1. While much of the work investigating WM abnormalities following mTBI has focused on the conventional diffusion tensor imaging (DTI) parameters, those parameters may be confounded by cerebral edema2. Myelin is a significant contributor to tissue susceptibility in white matter and quantitative susceptibility mapping (QSM) has been suggested to provide a potentially useful marker for myelination3. To this end, the present study aims to investigate whether QSM is able to identify particular characteristics of white matter alterations in patients with mTBI.Methods
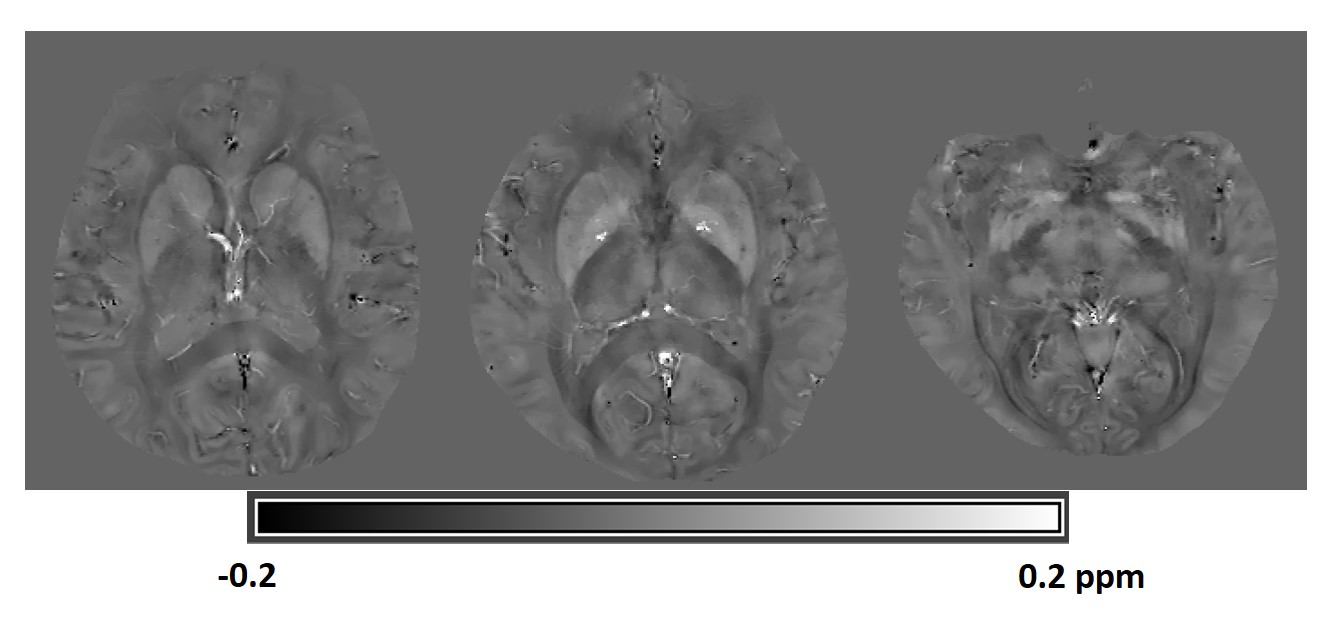
Sixteen patients with mTBI (age: 42.44 ± 12.18 years, 4 males) within 2 weeks after brain injury and 23 healthy control subjects (age: 37.95 ± 11.69 years, 9 males) were included in this analysis. QSM complex data were acquired on a Siemens 3T scanner with a 3D flow-compensated spoiled gradient-recalled echo (flip angle/ echo time/ pixel bandwidth/ repetition time =15/ 25 ms/ 120 Hz / 35 ms) with voxel resolution of 0.6✕0.6✕1.5 mm3 for whole brain coverage. Multi-channel complex data were combined for optimal phase reconstruction and phase data were unwrapped with a Laplacian-based approach. The background field was removed using the SHARP method4. Magnetic susceptibility was obtained from the local tissue phase using the orthogonal and right triangular decomposition (LSQR)5. Representative QSM imaging is shown in Figure 1. Group-level voxel-wise differences in QSM between patients and controls were assessed using ANCOVA6. Age and sex were used as covariates of no interest. Results were considered significant for P<0.05, after correction for multiple comparisons (family-wise error, FWE). Evaluations of post-concussive symptoms and cognitive functions were also performed for those subjects.Results
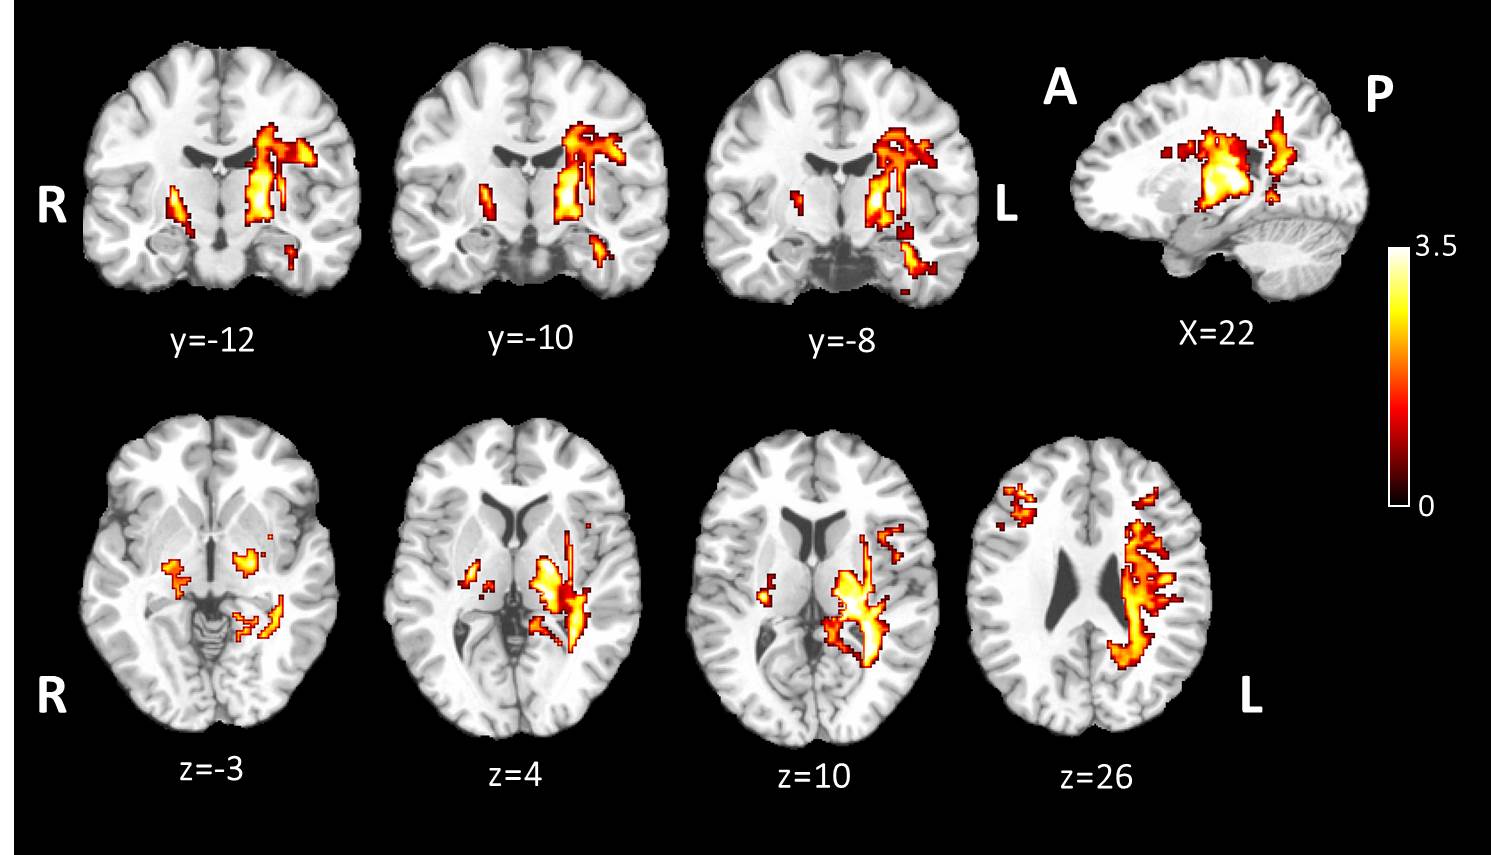
As expected in the assessment of post-concussive symptoms and cognitive functions, patients with mTBI performed worse in sleep quality (Pittsburgh Sleep Quality Index, P < 0.001), dizziness (Dizziness Handicap Inventory, P=0.046), post-concussion symptoms (Rivermead Post Concussion Symptoms Questionnaire, P=0.008), cognitive impairment (Mini-Mental State Examination, P=0.003), processing speed (Wechsler Adult Intelligence Scale IV Processing Speed, P=0.02) and anxiety (Beck Anxiety Inventory, P=0.023). In the group comparison of QSM analysis, patients with mTBI showed significant increased susceptibility in extensive white matter areas including left superior and posterior corona radiata, left superior longitudinal fasciculus, left posterior thalamic radiation, left retrolentricular part of internal capsule and bilateral posterior limb of internal capsule (Figure 2). mTBI also showed significant susceptibility changes in the bilateral thalamus (FWE cluster corrected P<0.05).Discussion
This study employed QSM to detect white matter pathology in patients with mTBI. We found extensive susceptibility changes in the areas of white matter and thalamus in patients with mTBI. The observed magnetic susceptibility alterations are in line with microstructural white matter changes as reported in previous studies using DTI7. Thalamus is a complex deep gray matter mass that consists of many nuclei and white matter bundles8. It plays a central role in neurobehavior and its extensive connections to the cerebral cortex render it sensitive to concussive damage9. Previous study has indicated that patients with mTBI suffer from disruption in their thalamic resting-state networks and those abnormal thalamic resting-state networks are associated with decreased neurocognitive performance8. Our findings may have implications about the demyelination and iron accumulation in the thalamocortical functional-related networks for patients with mTBI. These brain regions are intimately connected and generally considered important serving different cognitive functions, so the widespread distribution of susceptibility changes in patients with mTBI could lead to a functional sum effect of all regions involved as observed in the present study. A larger sample size will be required in the future study to validate this preliminary observation and to correlate susceptibility changes with neuropsychiatric measurements. Identification of diamagnetic myelin and paramagnetic iron accumulation in those brain areas will also be needed to be established in the future study by combing QSM with myelin water imaging or other techniques to model the contributions of myelin and iron in those findings of tissue contrasts.Conclusion
Our preliminary results suggest that QSM may provide an opportunity for detecting iron and myelin disturbances in white matter and thalamus of mTBI patients at early stage. However, a longitudinal study design with larger cohorts and exploratory correlation analyses with neurocognitive performances will be needed to evaluate its usefulness as diagnostic and monitoring biomarker in mTBI.Acknowledgements
This work was supported in part by the Ministry of Science and Technology, R.O.C (grants MOST104-2923-B-038-003-MY3, MOST105-2218-E-038-003-MY2 and MOST 105-2221-E-038-007-MY3 ).
References
1. Meier TB, Bergamino M, Bellgowan PS, et al. Longitudinal assessment of white matter abnormalities following sports-related concussion. Hum Brain Mapp 2016; 37: 833-845.
2. Li W, Long JA, Watts L, et al. Spatiotemporal changes in diffusion, T2 and susceptibility of white matter following mild traumatic brain injury. NMR Biomed 2016; 29: 896-903.
3. Liu C, Li W, Tong KA, et al. Susceptibility-weighted imaging and quantitative susceptibility mapping in the brain. J Magn Reson Imaging 2015; 42: 23-41.
4. Schweser F, Deistung A, Lehr BW, et al. Quantitative imaging of intrinsic magnetic tissue properties using MRI signal phase: an approach to in vivo brain iron metabolism? Neuroimage 2011; 54: 2789-2807.
5. Li W, Wu B, Liu C. Quantitative susceptibility mapping of human brain reflects spatial variation in tissue composition. Neuroimage 2011; 55: 1645-1656.
6. Acosta-Cabronero J, Williams GB, Cardenas-Blanco A, et al. In Vivo Quantitative Susceptibility Mapping (QSM) in Alzheimer's Disease. PLoS One 2013; 8: e81093.
7. Davenport ND, Lim KO, Armstrong MT, et al. Diffuse and spatially variable white matter disruptions are associated with blast-related mild traumatic brain injury. Neuroimage 2012; 59: 2017-2024.
8. Tang L, Ge Y, Sodickson DK, et al. Thalamic resting-state functional networks: disruption in patients with mild traumatic brain injury. Radiology 2011; 260: 831-840.
9. Kirov I, Fleysher L, Babb JS, et al. Characterizing 'mild' in traumatic brain injury with proton MR spectroscopy in the thalamus: Initial findings. Brain Inj 2007; 21: 1147-1154.
Figures